. 2022 Aug 31;75(3):416-424.
doi: 10.1093/cid/ciab979.

Maintenance of Measles Elimination Status in the United States for 20 Years Despite Increasing Challenges

Affiliations

Maintenance of Measles Elimination Status in the United States for 20 Years Despite Increasing Challenges

Adria D Mathis et al. Clin Infect Dis. .

Abstract

Background: Measles elimination (interruption of endemic measles virus transmission) in the United States was declared in 2000; however, the number of cases and outbreaks have increased in recent years. We characterized the epidemiology of measles outbreaks and measles transmission patterns after elimination to identify potential gaps in the US measles control program.

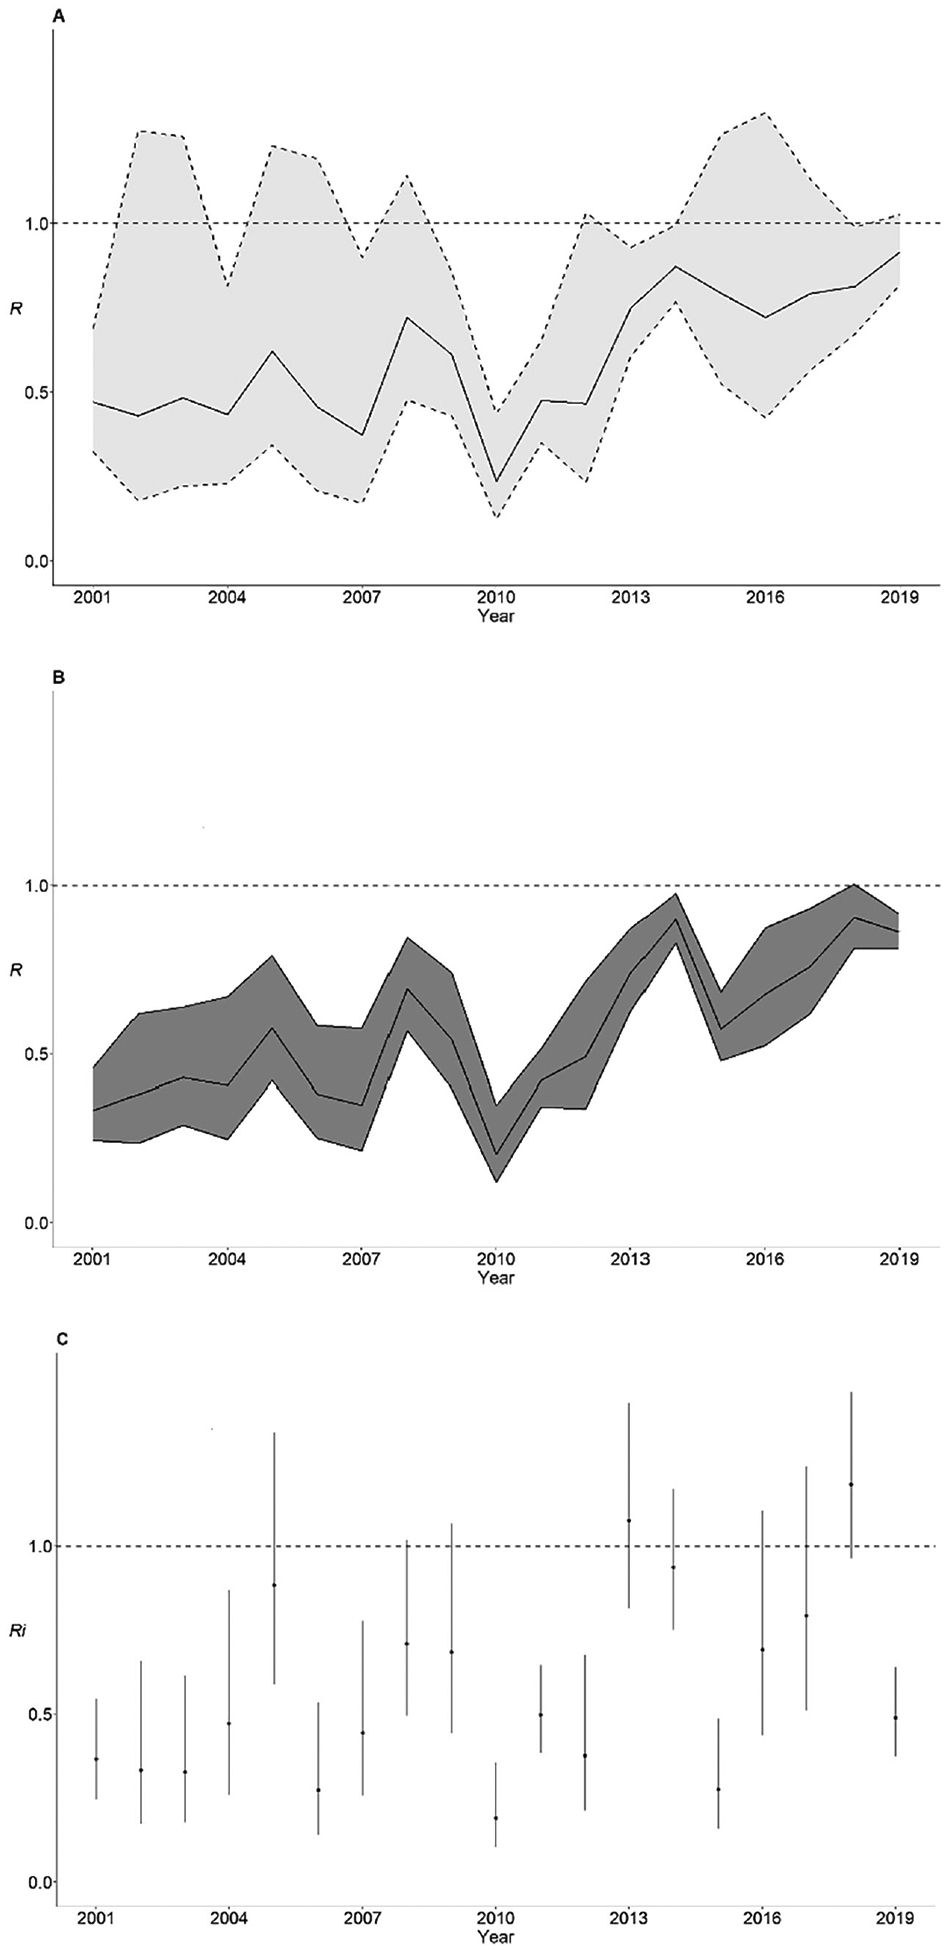
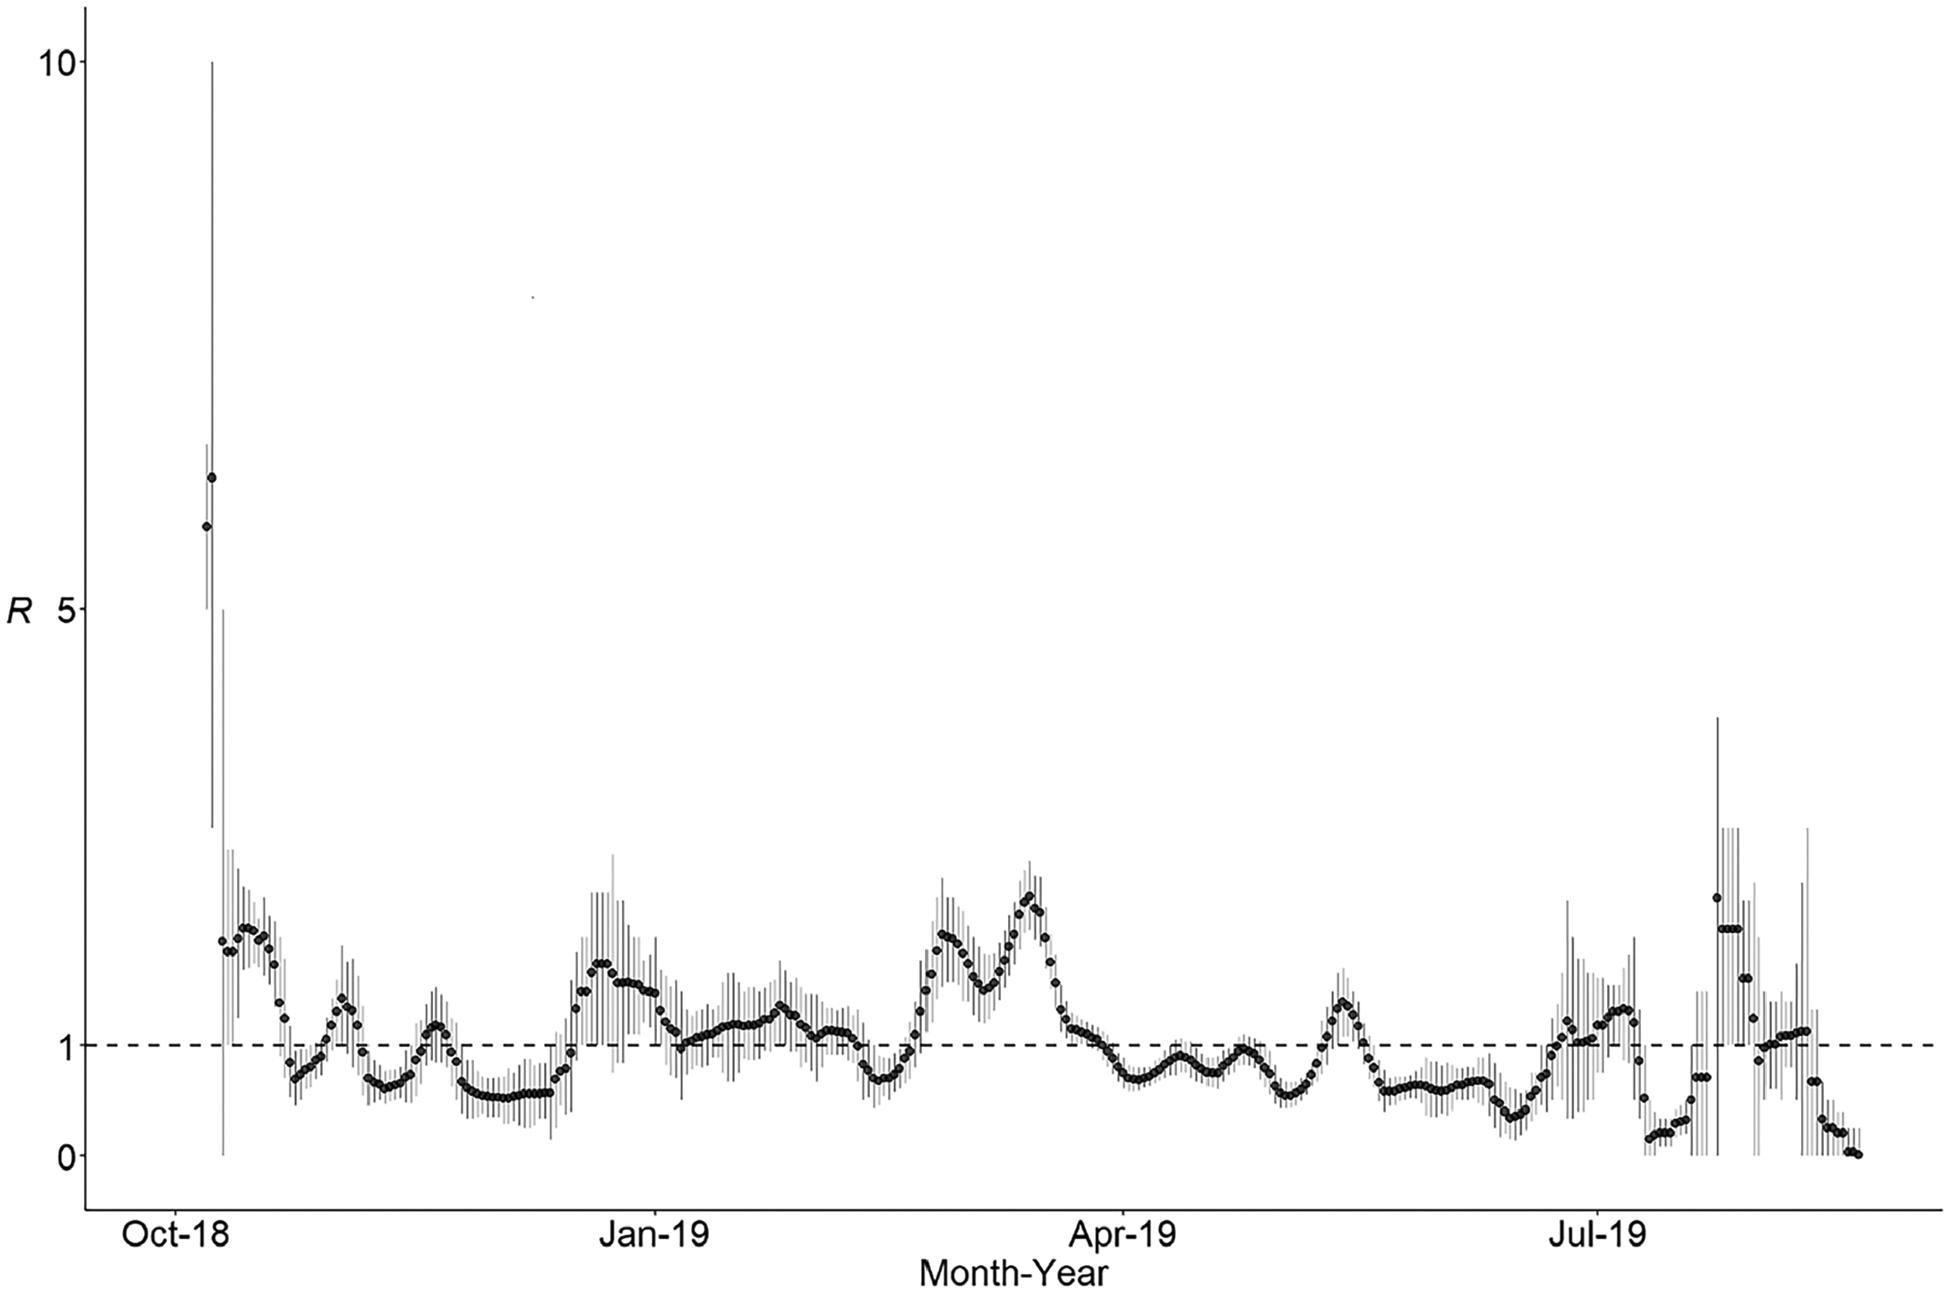
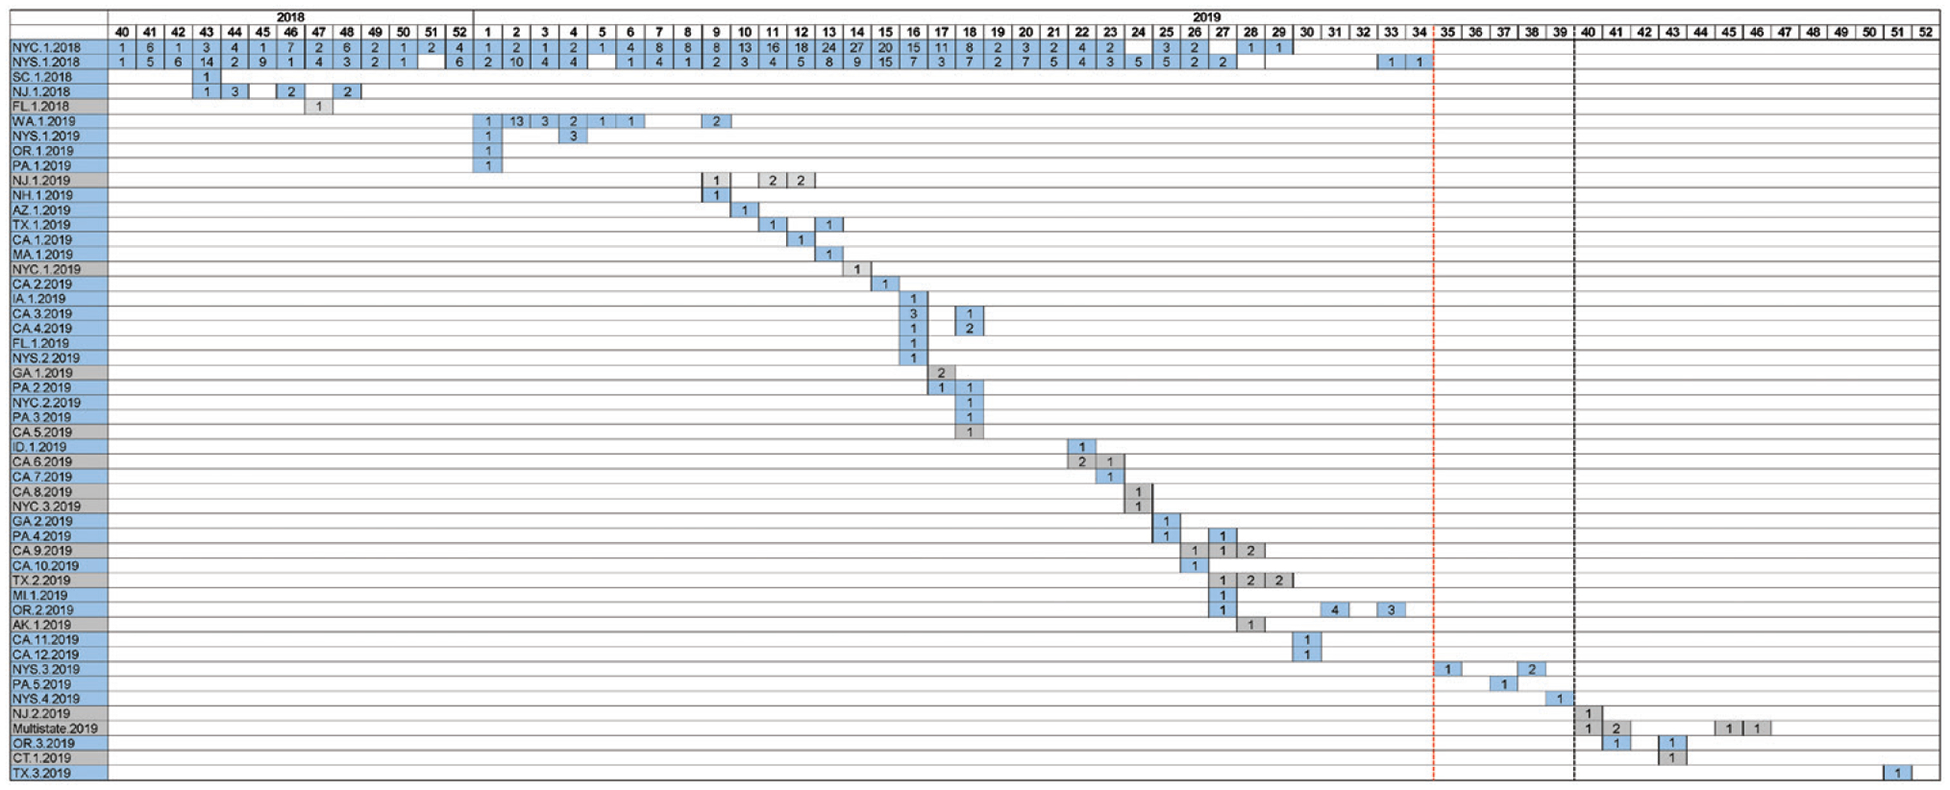
Methods: We analyzed national measles notification data from 1 January 2001 to 31 December 2019. We defined measles infection clusters as single cases (isolated cases not linked to additional cases), 2-case clusters, or outbreaks with ≥3 linked cases. We calculated the effective reproduction number (R) to assess changes in transmissibility and reviewed molecular epidemiology data.

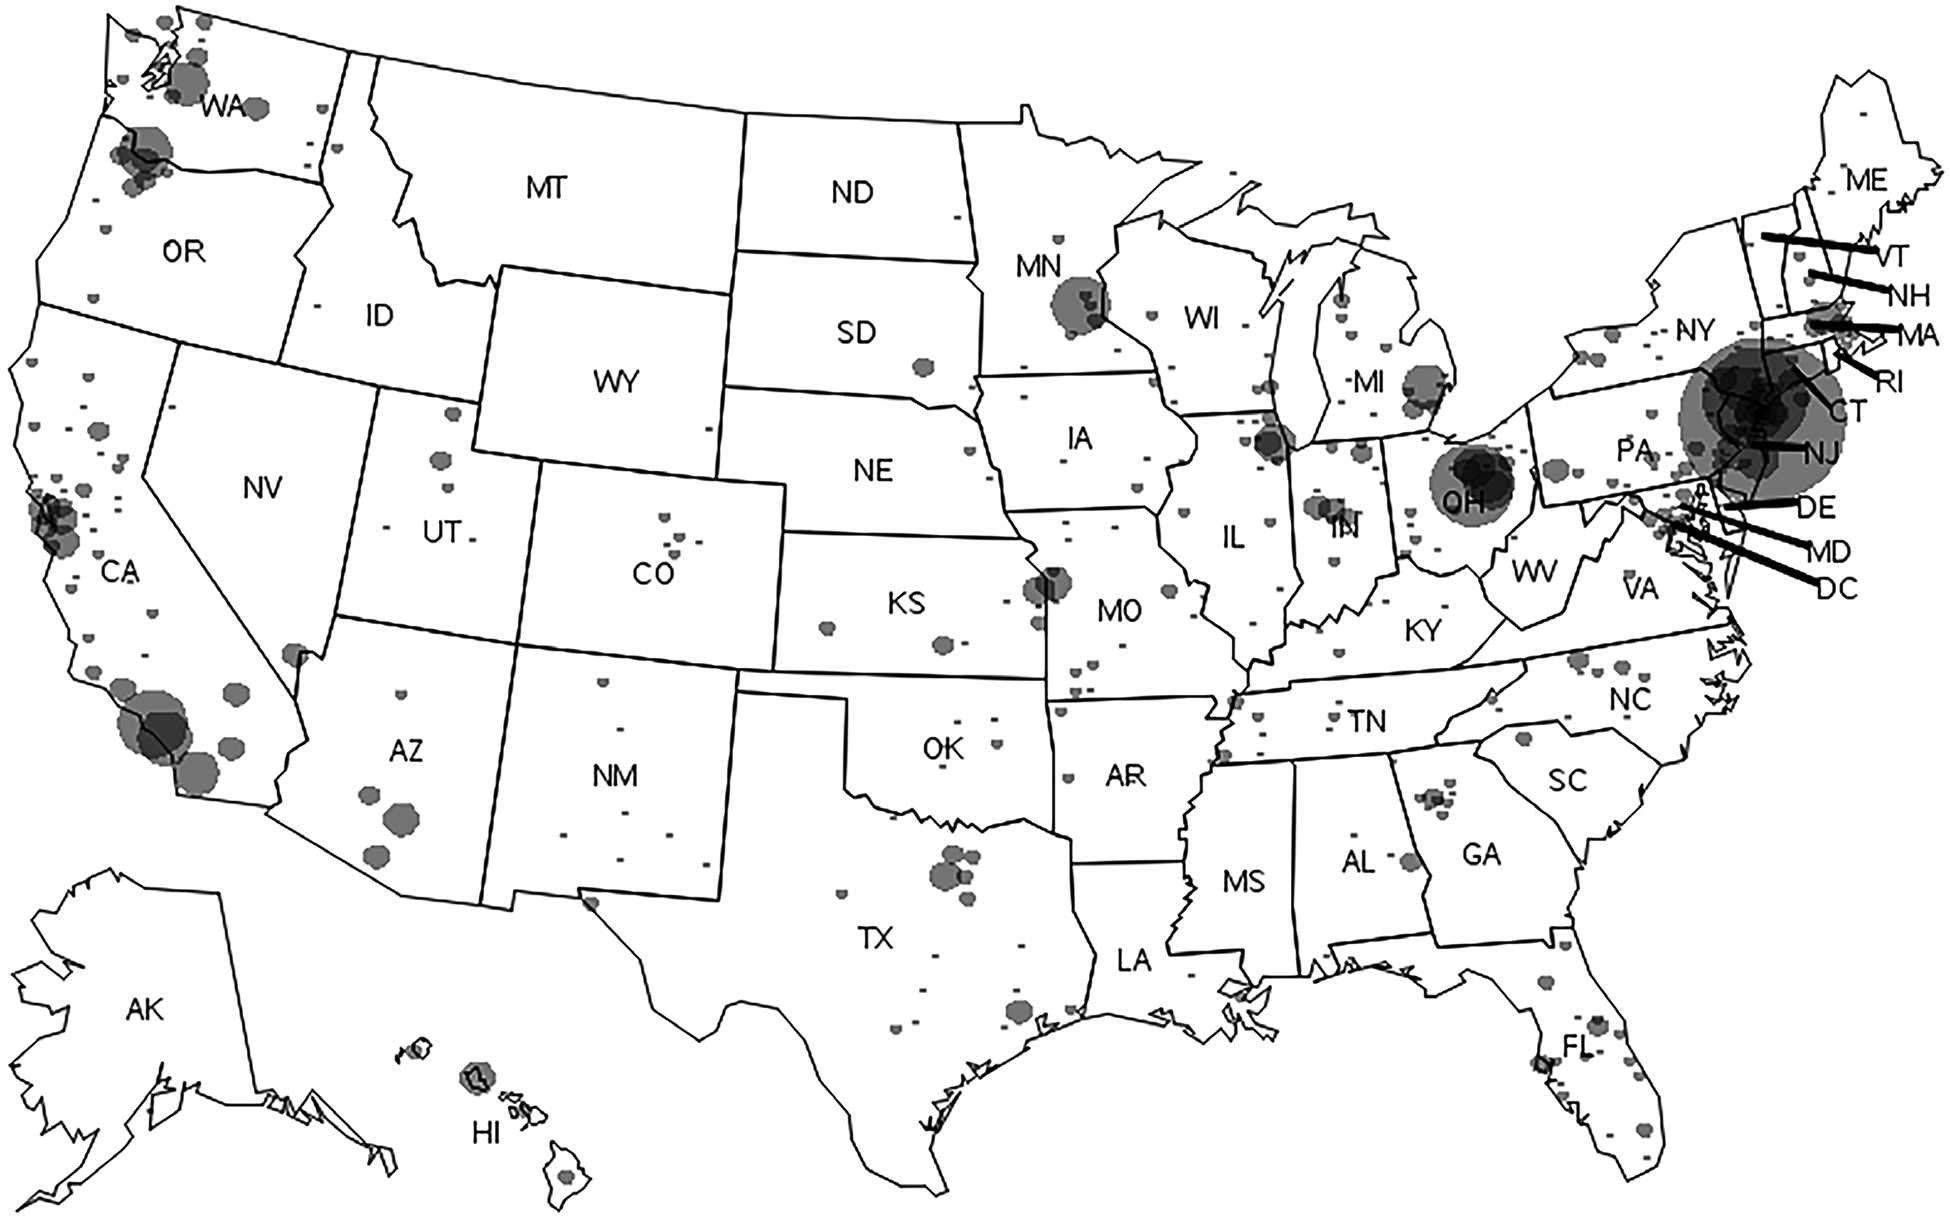
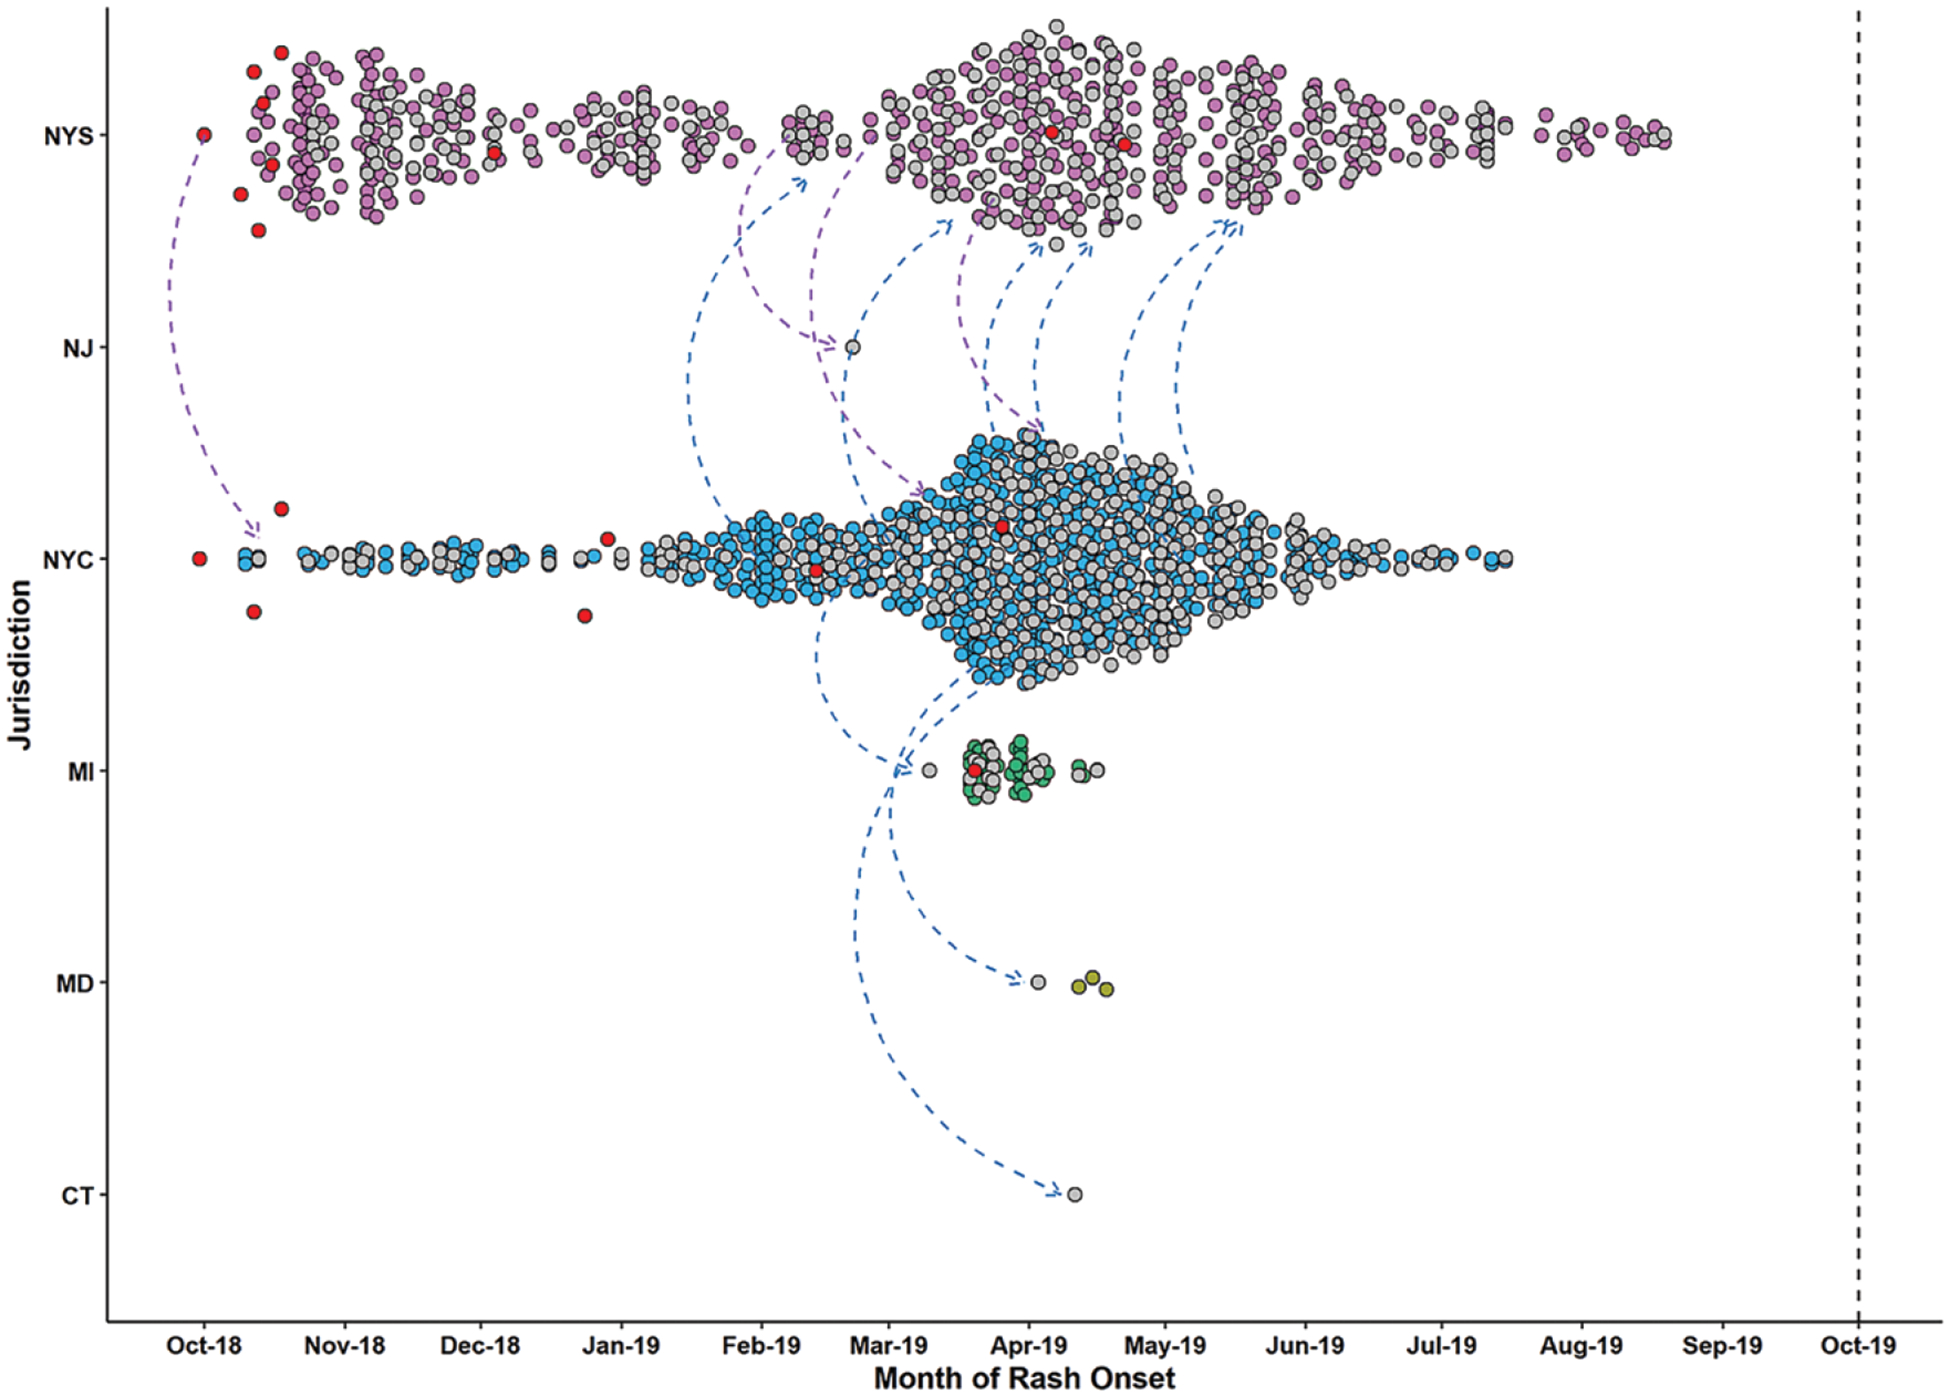
Results: During 2001-2019, a total of 3873 measles cases, including 747 international importations, were reported in the United States; 29% of importations were associated with outbreaks. Among 871 clusters, 69% were single cases and 72% had no spread. Larger and longer clusters were reported since 2013, including 7 outbreaks with >50 cases lasting >2 months, 5 of which occurred in known underimmunized, close-knit communities. No measles lineage circulated in a single transmission chain for >12 months. Higher estimates of R were noted in recent years, although R remained below the epidemic threshold of 1.

Conclusions: Current epidemiology continues to support the interruption of endemic measles virus transmission in the United States. However, larger and longer outbreaks in recent postelimination years and emerging trends of increased transmission in underimmunized communities emphasize the need for targeted approaches to close existing immunity gaps and maintain measles elimination.

Keywords: MMR vaccine; measles; measles outbreak.


Conflict of interest statement

Potential conflicts of interest. The authors: No reported conflicts of interest. All authors have submitted the ICMJE Form for Disclosure of Potential Conflicts of Interest.

Figures

Figure 1.
Figure 1.
Measles cases by county of residence, United States, 2001–2019. Measles cases have been reported in 48 states, including the District of Columbia (DC), with a range of 1–1352 cases by state. Circle size is proportional to the number of cases. Abbreviations: AK, Alaska; AL, Alabama; AR, Arkansas; AZ, Arizona; CA, California; CO, Colorado; CT, Connecticut; DE, Delaware; FL, Florida; GA, Georgia; HI, Hawaii; IA, Iowa; ID, Idaho; IL, Illinois; IN, Indiana; KS, Kansas; KY, Kentucky; LA, Louisiana; MA, Massachusetts; MD, Maryland; ME, Maine; MI, Michigan; MN, Minnesota; MO, Missouri; MS, Mississippi; MT, Montana; NC, North Carolina; ND, North Dakota; NE, Nebraska; NH, New Hampshire; NJ, New Jersey; NM, New Mexico; NV, Nevada; NY, New York; OH, Ohio; OK, Oklahoma; OR, Oregon; PA, Pennsylvania; RI, Rhode Island; SC, South Carolina; SD, South Dakota; TN, Tennessee; TX, Texas, UT, Utah; VA, Virginia; VT, Vermont; WA, Washington; WI, Wisconsin; WV, West Virginia; WY, Wyoming.
Figure 2.
Figure 2.
Estimates of the effective reproduction number (R) for measles by year in the United States, 2001–2019. A, Estimates of R according to the distribution of cluster sizes. B, C, Estimates of R for all cases (B) and index cases (Ri) (C), according to the Wallinga-Teunis method. Shaded light gray areas represent 95% confidence intervals obtained by likelihood profiling; shaded dark gray areas and vertical bars, 95% confidence intervals given by the quantiles of the distribution of reproduction numbers; and horizontal dashed lines, threshold value R = 1 (elimination is demonstrated by maintenance of R < 1 and is accomplished by keeping high levels of population immunity). For estimation of R based on the distribution of cluster sizes, cases in clusters spanning 2 years were divided based on their year of rash onset. For estimation of R and Ri based on the Wallinga-Teunis method, the algorithm assigns singleton cases an R value of 0.
Figure 3.
Figure 3.
Measles transmission in the United States during the 2018–2019 New York State (NYS) and New York City (NYC) outbreaks. Included are all cases known to be related to these outbreaks (1105 cases from 6 jurisdictions: New York City [649 cases], New York State [407 cases], Michigan [MI; 42 cases], Maryland [MD; 5 cases], Connecticut [CT; 1 case], and New Jersey [NJ; 1 case]; 2 cases [1 from New York State and 1 from Maryland] are not pictured because they did not have information on the date of rash onset). Each case is represented by a circle and plotted based on the reporting jurisdiction (y-axis) and the rash onset date (x-axis). Cases reported by distinct jurisdictions are shown in separate colors. Internationally imported cases are shown in red (14 from Israel and 1 each from Ukraine, the United Kingdom, United Kingdom/Belgium, and Ukraine/Israel). Gray circles represent cases with an unknown source (ie, cases without a direct epidemiological link to another case); arrows, known or potential exportation of measles from one jurisdiction to another; vertical dashed line, date for 12 months of continuous transmission.
Figure 4.
Figure 4.
Daily estimates of the effective reproduction number (R) during the 2018 and 2019 New York outbreaks. Calculations were based on all cases known to be related to these outbreaks; a total of 1105 cases from 6 jurisdictions: New York City (649 cases), New York State (407 cases), Michigan (42 cases), Maryland (5 cases), Connecticut (1 case), and New Jersey (1 case). Two cases (1 from New York State and 1 from Maryland) were not included in this analysis because they did not have information on the date of rash onset. Black circles show the mean estimate; vertical bars, 0.25 and 0.75 quantiles; and horizontal dashed line, the threshold value R = 1 (control of an outbreak is demonstrated by maintenance of R < 1). Estimates are presented over sliding 7-day windows, with the estimates plotted on the last day of the window. Here we accounted for the 18 separate importations associated with these outbreaks in the calculation of R; importations could not be attributed to any of the prior cases but could be the source of any subsequent case.
Figure 5.
Figure 5.
MVs/Gir Somnath.IND/42.16 D8 measles virus sequences identified in the United States, from 30 September 2018 to 31 December 2019 (n = 545). The numbers shown within individual squares indicate the total number of cases in which the named strain, MVs/Gir Somnath.IND/42.16, was identified, plotted based on the reported epidemiological week and year (columns) and the individual infection cluster (rows). Individual clusters are labeled using the reporting jurisdiction letter abbreviations, a chronological number per reporting jurisdiction, and the year in which the cluster started. Clusters with known sources (ie, in which an importation was identified) are shown in blue, and clusters with no known source are shown in gray. The red vertical dashed line represents the date of rash onset for the last case in New York State; the black vertical dashed line, the date that outbreak was declared to be over (ie, 42 days or 2 maximum incubation periods after the date of rash onset for the last case). Eight infection clusters were identified after the last case in the New York State outbreak; 3 did not have a known source (2 single cases and a 12-case multistate outbreak). Abbreviations: AK, Alaska; AZ, Arizona; CA, California; CT, Connecticut; FL, Florida; GA, Georgia; IA, Iowa; ID, Idaho; MA, Massachusetts; MI, Michigan; NH, New Hampshire; NJ, New Jersey; NYC, New York City; NYS, New York State (outside New York City); OR, Oregon; PA, Pennsylvania; SC, South Carolina; TX, Texas; WA, Washington.

References

    1. Dixon MG, Ferrari M, Antoni S, et al. Progress toward regional measles elimination - worldwide, 2000–2020. MMWR Morb Mortal Wkly Rep 2021; 70:1563–9. - PMC - PubMed
    1. Lee AD, Clemmons NS, Patel M, Gastañaduy PA. International importations of measles virus into the United States during the postelimination era, 2001–2016. J Infect Dis 2019; 219:1616–23. - PMC - PubMed
    1. Clemmons NS, Wallace GS, Patel M, Gastanaduy PA. Incidence of measles in the United States, 2001–2015. JAMA 2017; 318:1279–81. - PMC - PubMed
    1. Patel M, Lee AD, Clemmons NS, et al. National update on measles cases and outbreaks—United States, January 1-October 1, 2019. MMWR Morb Mortal Wkly Rep 2019; 68:893–6. - PMC - PubMed
    1. Truelove SA, Graham M, Moss WJ, Metcalf CJE, Ferrari MJ, Lessler J. Characterizing the impact of spatial clustering of susceptibility for measles elimination. Vaccine 2019; 37:732–41. - PMC - PubMed

Substances