Coronary flow reserve and cardiovascular outcomes: a systematic review and meta-analysis
- PMID: 34849697
- PMCID: PMC9020988
- DOI: 10.1093/eurheartj/ehab775
Coronary flow reserve and cardiovascular outcomes: a systematic review and meta-analysis
Erratum in
-
Erratum to: Coronary flow reserve and cardiovascular outcomes: a systematic review and meta-analysis.Eur Heart J. 2023 Jan 1;44(1):27. doi: 10.1093/eurheartj/ehac628. Eur Heart J. 2023. PMID: 36437227 Free PMC article. No abstract available.
Abstract
Aims: This meta-analysis aims to quantify the association of reduced coronary flow with all-cause mortality and major adverse cardiovascular events (MACE) across a broad range of patient groups and pathologies.
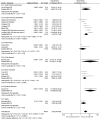
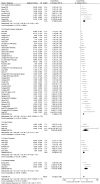
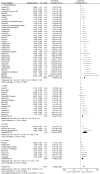
Methods and results: We systematically identified all studies between 1 January 2000 and 1 August 2020, where coronary flow was measured and clinical outcomes were reported. The endpoints were all-cause mortality and MACE. Estimates of effect were calculated from published hazard ratios (HRs) using a random-effects model. Seventy-nine studies with a total of 59 740 subjects were included. Abnormal coronary flow reserve (CFR) was associated with a higher incidence of all-cause mortality [HR: 3.78, 95% confidence interval (CI): 2.39-5.97] and a higher incidence of MACE (HR 3.42, 95% CI: 2.92-3.99). Each 0.1 unit reduction in CFR was associated with a proportional increase in mortality (per 0.1 CFR unit HR: 1.16, 95% CI: 1.04-1.29) and MACE (per 0.1 CFR unit HR: 1.08, 95% CI: 1.04-1.11). In patients with isolated coronary microvascular dysfunction, an abnormal CFR was associated with a higher incidence of mortality (HR: 5.44, 95% CI: 3.78-7.83) and MACE (HR: 3.56, 95% CI: 2.14-5.90). Abnormal CFR was also associated with a higher incidence of MACE in patients with acute coronary syndromes (HR: 3.76, 95% CI: 2.35-6.00), heart failure (HR: 6.38, 95% CI: 1.95-20.90), heart transplant (HR: 3.32, 95% CI: 2.34-4.71), and diabetes mellitus (HR: 7.47, 95% CI: 3.37-16.55).
Conclusion: Reduced coronary flow is strongly associated with increased risk of all-cause mortality and MACE across a wide range of pathological processes. This finding supports recent recommendations that coronary flow should be measured more routinely in clinical practice, to target aggressive vascular risk modification for individuals at higher risk.
Keywords: Cardiology; Cardiovascular risk; Coronary flow reserve; Interventional; Microvascular disease.
© The Author(s) 2021. Published by Oxford University Press on behalf of the European Society of Cardiology.
Figures


Comment in
-
Coronary flow reserve: a versatile tool for interrogating pathophysiology, and a reliable marker of cardiovascular outcomes and mortality.Eur Heart J. 2022 Apr 19;43(16):1594-1596. doi: 10.1093/eurheartj/ehac001. Eur Heart J. 2022. PMID: 35134171 No abstract available.
References
-
- Gould KL, Lipscomb K. Effects of coronary stenoses on coronary flow reserve and resistance. Am J Cardiol 1974;34:48–55. - PubMed
-
- Kern MJ, Bach RG, Mechem CJ et al. Variations in normal coronary vasodilatory reserve stratified by artery, gender, heart transplantation and coronary artery disease. J Am Coll Cardiol 1996;28:1154–1160. - PubMed
-
- Kern MJ, Lerman A, Bech JW et al. ; American Heart Association Committee on Diagnostic and Interventional Cardiac Catheterization, Council on Clinical Cardiology. Physiological assessment of coronary artery disease in the cardiac catheterization laboratory: a scientific statement from the American Heart Association Committee on Diagnostic and Interventional Cardiac Catheterization, Council on Clinical Cardiology. Circulation 2006;114:1321–1341. - PubMed
-
- Cortigiani L, Rigo F, Gherardi S et al. Coronary flow reserve during dipyridamole stress echocardiography predicts mortality. JACC Cardiovasc Imaging 2012;5:1079–1085. - PubMed
-
- Herzog BA, Husmann L, Valenta I et al. Long-term prognostic value of 13N-ammonia myocardial perfusion positron emission tomography added value of coronary flow reserve. J Am Coll Cardiol 2009;54:150–156. - PubMed
Publication types
MeSH terms
Grants and funding
LinkOut - more resources
Full Text Sources
Other Literature Sources
Medical

