

A dense linkage map for a large repetitive genome: discovery of the sex-determining region in hybridizing fire-bellied toads (Bombina bombina and Bombina variegata)
- PMID: 34849761
- PMCID: PMC8664441
- DOI: 10.1093/g3journal/jkab286
A dense linkage map for a large repetitive genome: discovery of the sex-determining region in hybridizing fire-bellied toads (Bombina bombina and Bombina variegata)
Abstract
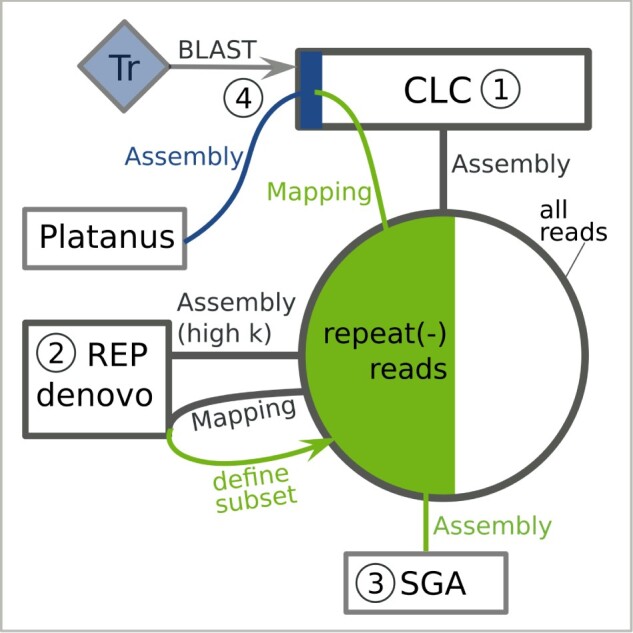
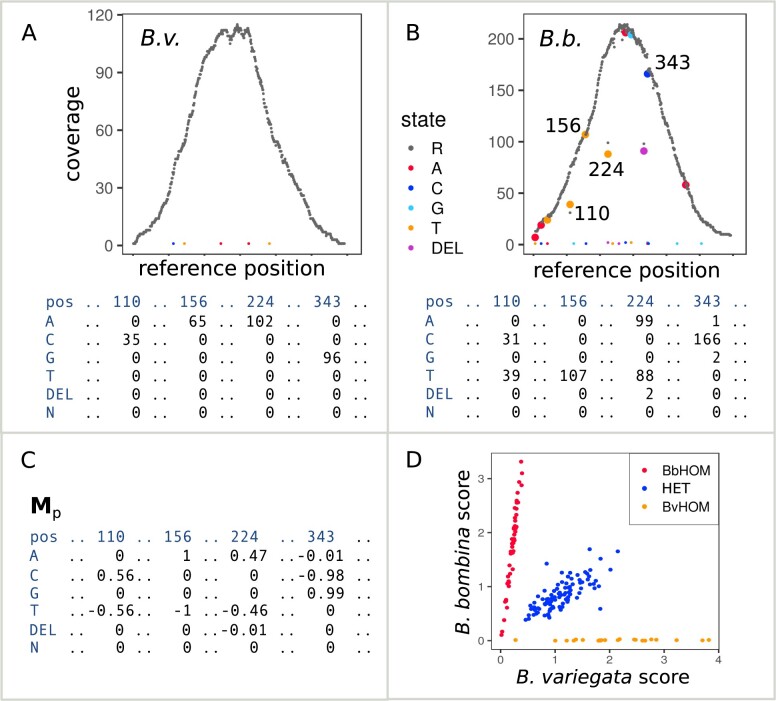
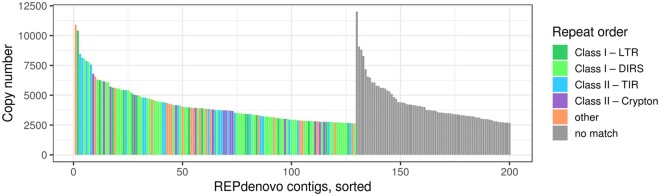
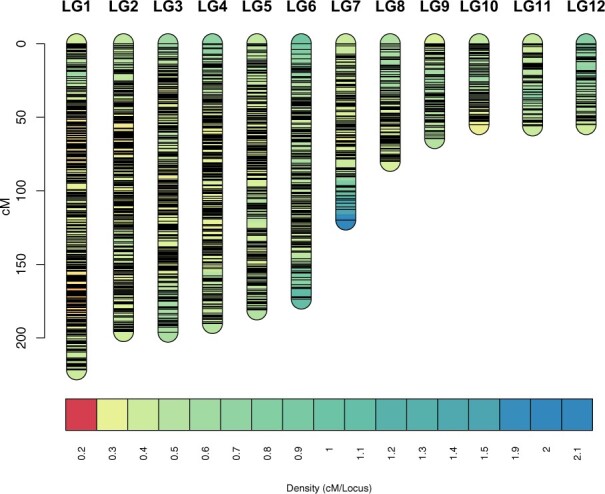
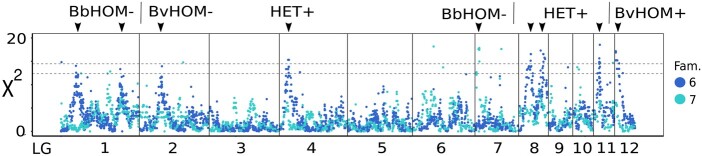
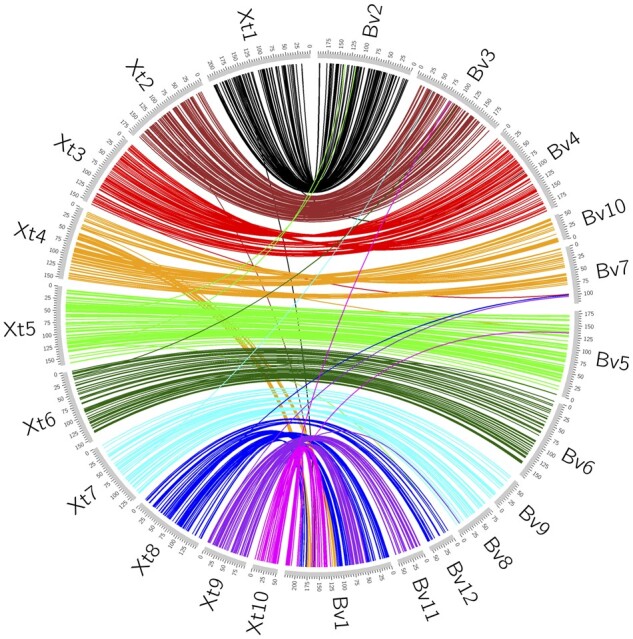
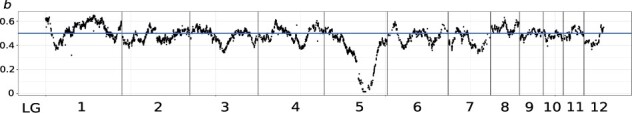
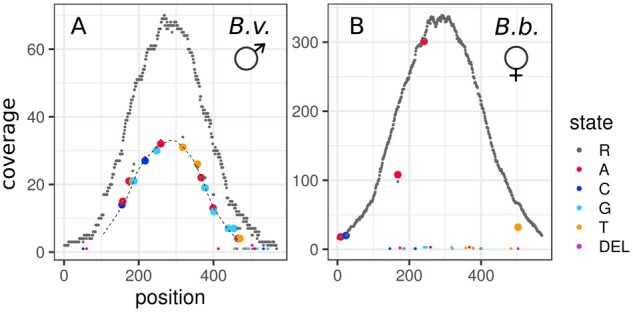
Genomic analysis of hybrid zones offers unique insights into emerging reproductive isolation and the dynamics of introgression. Because hybrid genomes consist of blocks inherited from one or the other parental taxon, linkage information is essential. In most cases, the spectrum of local ancestry tracts can be efficiently uncovered from dense linkage maps. Here, we report the development of such a map for the hybridizing toads, Bombina bombina and Bombina variegata (Anura: Bombinatoridae). Faced with the challenge of a large (7-10 Gb), repetitive genome, we set out to identify a large number of Mendelian markers in the nonrepetitive portion of the genome that report B. bombina vs B. variegata ancestry with appropriately quantified statistical support. Bait sequences for targeted enrichment were selected from a draft genome assembly, after filtering highly repetitive sequences. We developed a novel approach to infer the most likely diplotype per sample and locus from the raw read mapping data, which is robust to over-merging and obviates arbitrary filtering thresholds. Validation of the resulting map with 4755 markers underscored the large-scale synteny between Bombina and Xenopus tropicalis. By assessing the sex of late-stage F2 tadpoles from histological sections, we identified the sex-determining region in the Bombina genome to 7 cM on LG5, which is homologous to X. tropicalis chromosome 5, and inferred male heterogamety. Interestingly, chromosome 5 has been repeatedly recruited as a sex chromosome in anurans with XY sex determination.
Keywords: anurans; genome assembly; hybrid zone; large-scale synteny; linkage map; population pileups diplotyping; segregation distortion; sex-determining region; targeted capture.
© The Author(s) 2021. Published by Oxford University Press on behalf of Genetics Society of America.
Figures
Similar articles
-
A linkage map for the hybridising toads Bombina bombina and B. variegata (Anura: Discoglossidae).Heredity (Edinb). 2003 Aug;91(2):136-42. doi: 10.1038/sj.hdy.6800291. Heredity (Edinb). 2003. PMID: 12886280
-
Para-allopatry in hybridizing fire-bellied toads (Bombina bombina and B. variegata): Inference from transcriptome-wide coalescence analyses.Evolution. 2016 Aug;70(8):1803-18. doi: 10.1111/evo.12978. Epub 2016 Jul 8. Evolution. 2016. PMID: 27282112 Free PMC article.
-
The maintenance of reproductive isolation in a mosaic hybrid zone between the fire-bellied toads Bombina bombina and B. variegata.Evolution. 2003 Aug;57(8):1876-88. doi: 10.1111/j.0014-3820.2003.tb00595.x. Evolution. 2003. PMID: 14503629
-
Complete mitochondrial genomes resolve phylogenetic relationships within Bombina (Anura: Bombinatoridae).Mol Phylogenet Evol. 2013 Oct;69(1):63-74. doi: 10.1016/j.ympev.2013.05.007. Epub 2013 May 21. Mol Phylogenet Evol. 2013. PMID: 23707701
-
Phylogeography of the fire-bellied toads Bombina: independent Pleistocene histories inferred from mitochondrial genomes.Mol Ecol. 2007 Jun;16(11):2301-16. doi: 10.1111/j.1365-294X.2007.03309.x. Mol Ecol. 2007. PMID: 17561892
Cited by
-
A Chromosome-level genome assembly of the American bullfrog (Aquarana catesbeiana).Sci Data. 2025 Mar 10;12(1):413. doi: 10.1038/s41597-025-04697-3. Sci Data. 2025. PMID: 40064910 Free PMC article.
-
Sex chromosomes as supergenes of speciation: why amphibians defy the rules?Philos Trans R Soc Lond B Biol Sci. 2022 Aug;377(1856):20210202. doi: 10.1098/rstb.2021.0202. Epub 2022 Jun 13. Philos Trans R Soc Lond B Biol Sci. 2022. PMID: 35694748 Free PMC article. Review.
-
Widespread Adaptive Introgression of Major Histocompatibility Complex Genes across Vertebrate Hybrid Zones.Mol Biol Evol. 2024 Oct 4;41(10):msae201. doi: 10.1093/molbev/msae201. Mol Biol Evol. 2024. PMID: 39324637 Free PMC article.
-
Conserved chromatin and repetitive patterns reveal slow genome evolution in frogs.Nat Commun. 2024 Jan 17;15(1):579. doi: 10.1038/s41467-023-43012-9. Nat Commun. 2024. PMID: 38233380 Free PMC article.
-
Tadpoles of hybridising fire-bellied toads (B. bombina and B. variegata) differ in their susceptibility to predation.PLoS One. 2020 Dec 7;15(12):e0231804. doi: 10.1371/journal.pone.0231804. eCollection 2020. PLoS One. 2020. PMID: 33285552 Free PMC article.
References
-
- Baird SJE. 1995. A simulation study of multilocus clines. Evolution. 49:1038–1045. - PubMed
-
- Baker RJ, Bickham JW.. 1980. Karyotypic evolution in bats: evidence of extensive and conservative chromosomal evolution in closely related taxa. Syst Biol. 29:239–253. 10.1093/sysbio/29.3.239. - DOI
-
- Barton NH. 1979. Gene flow past a cline. Heredity. 43:333–339.
Publication types
MeSH terms
Grants and funding
LinkOut - more resources
Full Text Sources
Miscellaneous