. 2021 Dec 10;219(4):iyab160.
doi: 10.1093/genetics/iyab160.

Identification of Mep1a as a susceptibility gene for atherosclerosis in mice

Affiliations

Identification of Mep1a as a susceptibility gene for atherosclerosis in mice

Andrew T Grainger et al. Genetics. .

Abstract

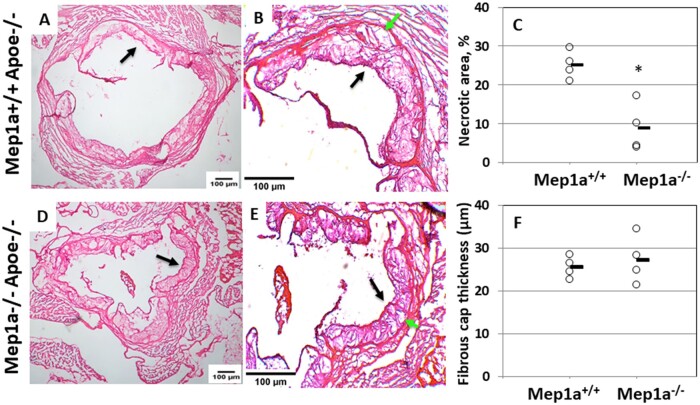
Atherosclerosis is the underlying cause of heart attack, ischemic stroke and peripheral arterial disease, and genetic factors involved remain mostly unidentified. We previously identified a significant locus on mouse chromosome 17 for atherosclerosis, Ath49, in an intercross between BALB/c and SM strains. Ath49 partially overlaps in the confidence interval with Ath22 mapped in an AKR × DBA/2 intercross. Bioinformatics analysis prioritized Mep1a, encoding meprin 1α metalloendopeptidase, as a likely candidate gene for Ath49. To prove causality, Mep1a-/-Apoe-/- mice were generated and compared with Mep1a+/+Apoe-/- mice for atherosclerosis development. Mep1a was found abundantly expressed in atherosclerotic lesions but not in healthy aorta and liver of mice. Mep1a-/- Apoe-/- mice exhibited significant reductions in both early and advanced lesion sizes. Loss of Mep1a led to decreased necrosis but increased macrophage and neutrophil contents in advanced lesions, reduced plasma levels of CXCL5 and an oxidative stress biomarker. In addition, Mep1a-/- mice had significantly reduced triglyceride levels on a chow diet. Thus, Mep1a is a susceptibility gene for atherosclerosis and aggravates atherosclerosis partially through action on oxidative stress and inflammation.

Keywords: Mep1a; Atherosclerosis; metalloendopeptidase; mice; oxidative stress.


Figures

Figure 1
Figure 1
Overlapping of the confidence interval of QTL for atherosclerotic lesions on mouse chromosome 17 (Chr17). Ath49, mapped in an intercross between BALB-Apoe−/− and SM-Apoe−/− mice, overlaps with Ath22 mapped in AKR-Apoe−/− and DBA/2-Apoe−/− mice in the confidence interval from 43 to 53 Mb.
Figure 2
Figure 2
A through F, Corresponding staining of adjacent cross-sections of the aortic root of an Apoe−/− mouse shows co-location of Mep1a and Oil Red O positive areas pointed by arrows. The top row is microimages that include the entire aortic cross section (original magnification: 4x), and the bottom row is microimages that show a representative region at a high magnification (10x). Scale bars are shown in the figure. G, Western blot analysis of Mep1a and ß-actin proteins in the aorta, liver, and kidney of 6-week-old Mep1a+/+Apoe−/− mice. Kidney samples from Mep1a−/− Apoe−/− mice were used as a negative control for Mep1a. Each lane represents an individual mouse. L, ladder.
Figure 3
Figure 3
Atherosclerotic lesion areas in the aortic root of female Mep1a−/−Apoe−/− and Mep1a+/+Apoe−/− control mice fed a chow or Western diet. Each circle represents the lesion size of an individual mouse. The horizontal short line represents the mean lesion size of an entire group. * P < 0.05 compared with Mep1a+/+Apoe−/− mice on the same diet.
Figure 4
Figure 4
Influence of Mep1a deficiency on stability of advanced atherosclerotic lesions in Apoe−/− mice. Sections were stained with H&E. A, B, D, E: Representative images of H&E stained sections of a Mep1a−/−Apoe−/− and a Mep1a+/+Apoe−/− mouse fed 12 weeks of Western diet. Black arrow points at the fibrous cap, and green arrow at necrotic area. A, D: 4x; B, E: 10x. C, Quantification of necrotic atherosclerotic lesion areas on H&E stained sections from Mep1a−/−Apoe−/− and Mep1a+/+Apoe−/− mice fed 12 weeks of Western diet. The magnitude of necrosis is expressed as a percentage of the unstained area relative to the entire lesion area on the same aortic cross section for 4 Mep1a+/+Apoe−/− and 4 Mep1a−/− Apoe−/− mice. * P < 0.05 vs Mep1a+/+Apoe−/− mice. F, Average fibrous cap thickness of advanced atherosclerotic lesions measured on H&E stained sections from Mep1a−/−Apoe−/− and Mep1a+/+Apoe−/− mice fed 12 weeks of Western diet. Each circle represents the measurement of an individual mouse, and the horizontal short line represents the mean value of an entire group.
Figure 5
Figure 5
The collagen content in atherosclerotic lesions determined by trichrome staining for Mep1a−/−Apoe−/− and Mep1a+/+Apoe−/− mice fed 12 weeks of Western diet. A, B, C, D: Representative images of trichrome stained atherosclerotic lesions of a Mep1a+/+Apoe−/− and a Mep1a−/− Apoe−/− mouse. Red and blue stain areas are highlighted by black and green arrows, respectively. A, C: 4x; B, D: 10x. E, Quantification of collagen content in atherosclerotic lesions on trichrome stained aortic root sections from Mep1a−/−Apoe−/− and Mep1a+/+Apoe−/− mice fed 12 weeks of Western diet. The amount of collagen content is expressed as a percentage of the blue stain area relative to the entire lesion area on the same section for 4 Mep1a+/+Apoe−/− or 4 Mep1a−/− Apoe−/− mice. Each circle represents the measurement of an individual mouse, and the horizontal short line represents the mean value of an entire group.
Figure 6
Figure 6
Immunofluorescence analysis of cellular components in atherosclerotic lesions of Mep1a−/− Apoe−/− and Mep1a+/+Apoe−/− mice. Representative immunofluorescence images showing staining for macrophages (green color), vascular smooth muscle cell (red), Mep1a (magenta), and nuclei (blue). Macrophages (E) and smooth muscle cells (F) in atherosclerotic lesions of Mep1a+/+Apoe−/− and Mep1a−/− Apoe−/− mice were quantified. The density of either cell type was expressed as a percentage of positive stained cells relative to all stained nuclei (DAPI) in an image. Results are expressed as individual values for 8 Mep1a+/+Apoe−/− mice and 8 Mep1α−/− Apoe−/− mice. The horizontal short line represents the mean value of an entire group. *P < 0.05.
Figure 7
Figure 7
Chromogenic immunohistochemical analysis of Mac3 (macrophages), Ly6G (neutrophils), and CXCL5 antigens in advanced atherosclerotic lesions of Mep1a+/+ Apoe−/− (A through H) and Mep1a−/− Apoe−/− mice (I through P). Top row is microimages taken at a lower magnification (4x), bottom row is microimages taken at a high magnification (10x) for both genotypes of mice. Arrows point at stained lesion areas. Note the difference in the intensity of Mac3 staining between the two genotypes of mice.
Figure 8
Figure 8
Immunofluorescence detection of CXCL5 and neutrophils (Ly6g) in atherosclerotic lesions of Mep1a−/− Apoe−/− and Mep1a+/+Apoe−/− mice. Representative immunofluorescence images showing staining for CXCL5 and neutrophils in atherosclerotic lesions of Mep1a+/+Apoe−/− (A–C) and Mep1a−/− Apoe−/− mice (D–F). CXCL5 was stained red, neutrophils stained green, and nuclei stained blue. G, Neutrophils in atherosclerotic lesions were quantified and expressed as a percentage of positive stained area relative to the lesion area in the same images for 6 Mep1a+/+Apoe−/− mice and 7 Mep1a−/− Apoe−/− mice. H, Expression of CXCL5 was expressed as a percentage of positive stained area over the lesion area on the same images for 4 Mep1a+/+Apoe−/− mice and 5 Mep1a−/− Apoe−/− mice. * P < 0.05. Each circle represents the measurement of a mouse, and the horizontal short line represents the mean value of a group. Arrows point at stained areas.
Figure 9
Figure 9
Plasma levels of MCP-1 (A), CXCL5 (B), and MDA (C) in Mep1a−/− Apoe−/− and Mep1a+/+Apoe−/− mice when fed a chow or Western diet. Results are means ± SE of 7 to 10 mice per group. * P < 0.05 vs Mep1a+/+Apoe−/− mice; + P < 0.05 vs chow diet.

References

    1. Arnold P, Otte A, Becker-Pauly C.. 2017. Meprin metalloproteases: molecular regulation and function in inflammation and fibrosis. Biochim Biophys Acta Mol Cell Res. 1864:2096–2104. doi:10.1016/j.bbamcr.2017.05.011. - PubMed
    1. Banerjee S, Oneda B, Yap LM, Jewell DP, Matters GL, et al.2009. MEP1A allele for meprin A metalloprotease is a susceptibility gene for inflammatory bowel disease. Mucosal Immunol. 2:220–231. doi:10.1038/mi.2009.3. - PMC - PubMed
    1. Bankus JM, Bond JS.. 1996. Expression and distribution of meprin protease subunits in mouse intestine. Arch Biochem Biophys. 331:87–94. doi:10.1006/abbi.1996.0286. - PubMed
    1. Bennett BJ, Davis RC, Civelek M, Orozco L, Wu J, et al.2015. Genetic architecture of atherosclerosis in mice: a systems genetics analysis of common inbred strains. PLoS Genet. 11:e1005711.doi:10.1371/journal.pgen.1005711. - PMC - PubMed
    1. Broder C, Arnold P, Vadon-Le Goff S, Konerding MA, Bahr K, et al.2013. Metalloproteases meprin α and meprin β are C- and N-procollagen proteinases important for collagen assembly and tensile strength. Proc Natl Acad Sci USA. 110:14219–14224. doi:10.1073/pnas.1305464110. - PMC - PubMed

Publication types