

An overview of the National COVID-19 Chest Imaging Database: data quality and cohort analysis
- PMID: 34849869
- PMCID: PMC8633457
- DOI: 10.1093/gigascience/giab076
An overview of the National COVID-19 Chest Imaging Database: data quality and cohort analysis
Erratum in
-
Erratum to: An overview of the National COVID-19 Chest Imaging Database: data quality and cohort analysis.Gigascience. 2021 Dec 1;10(12):giab083. doi: 10.1093/gigascience/giab083. Gigascience. 2021. PMID: 34850874 Free PMC article. No abstract available.
Abstract
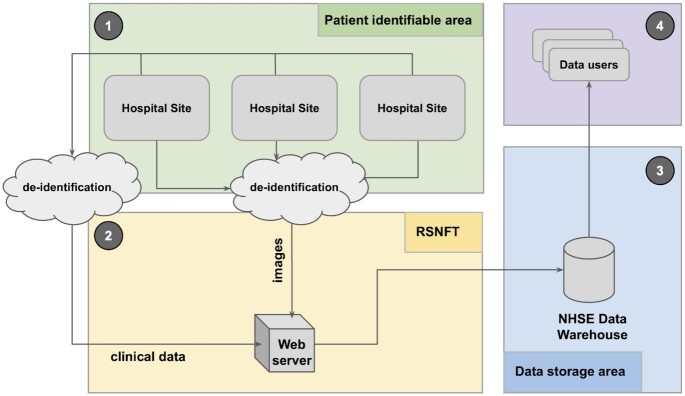
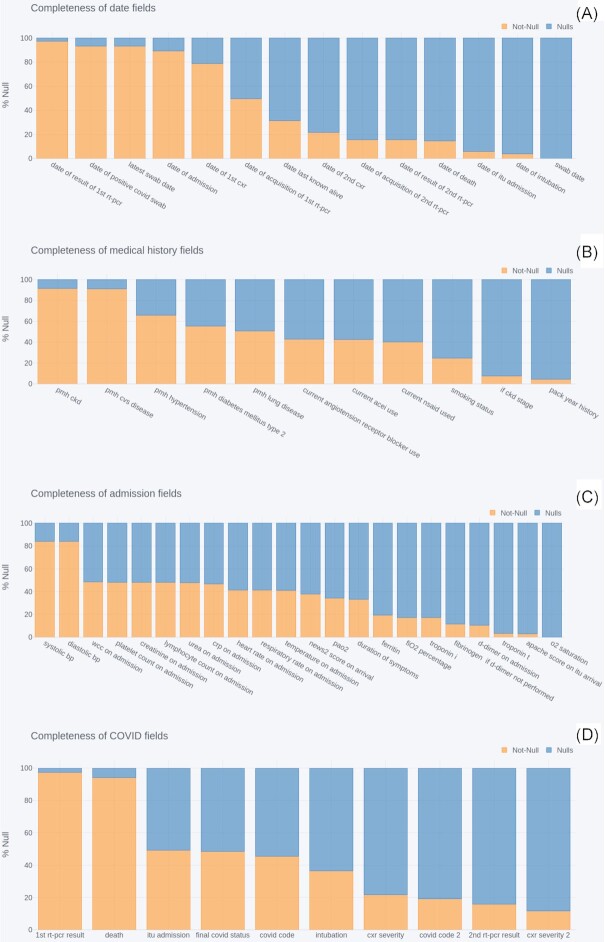
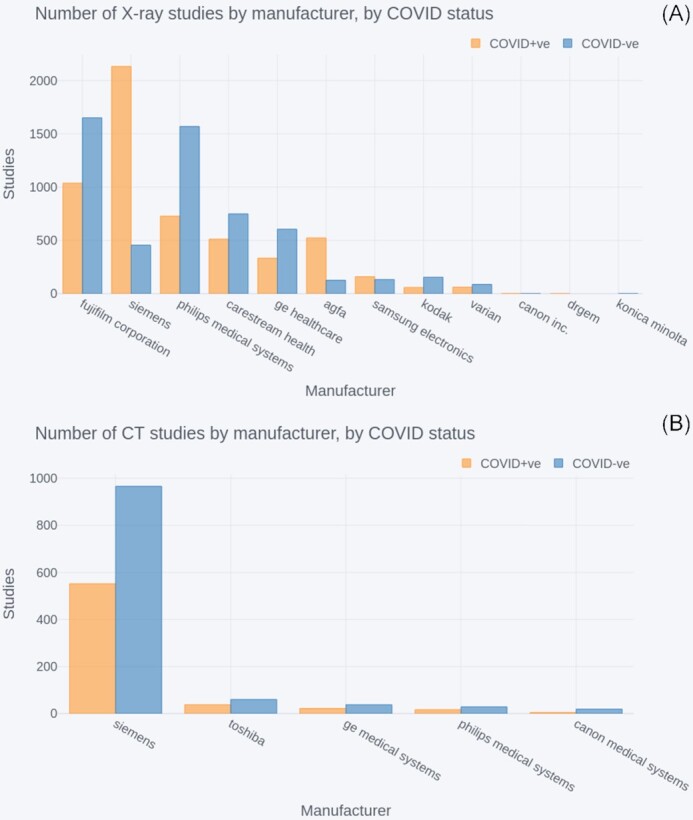
Background: The National COVID-19 Chest Imaging Database (NCCID) is a centralized database containing mainly chest X-rays and computed tomography scans from patients across the UK. The objective of the initiative is to support a better understanding of the coronavirus SARS-CoV-2 disease (COVID-19) and the development of machine learning technologies that will improve care for patients hospitalized with a severe COVID-19 infection. This article introduces the training dataset, including a snapshot analysis covering the completeness of clinical data, and availability of image data for the various use-cases (diagnosis, prognosis, longitudinal risk). An additional cohort analysis measures how well the NCCID represents the wider COVID-19-affected UK population in terms of geographic, demographic, and temporal coverage.
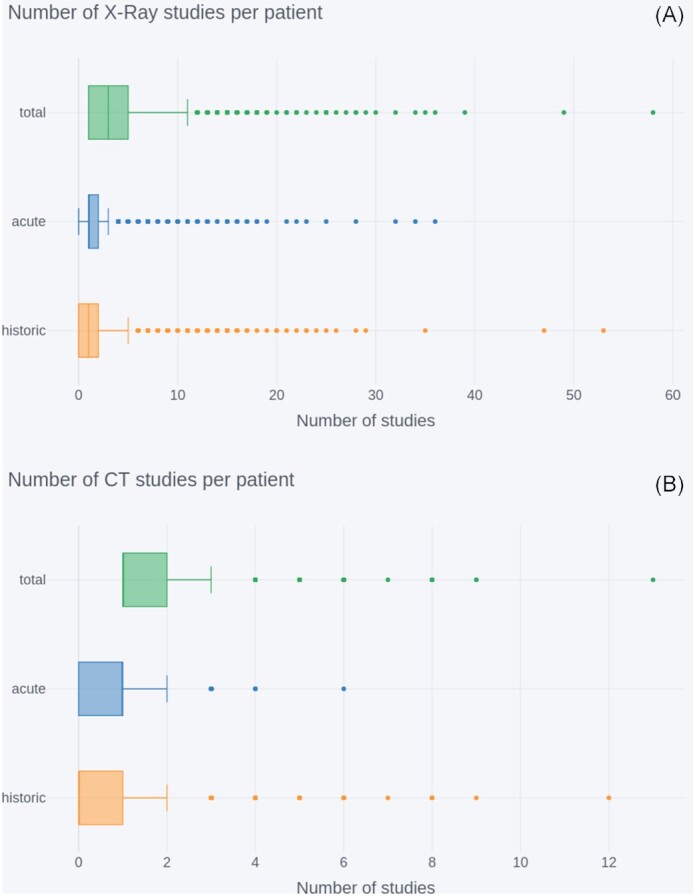
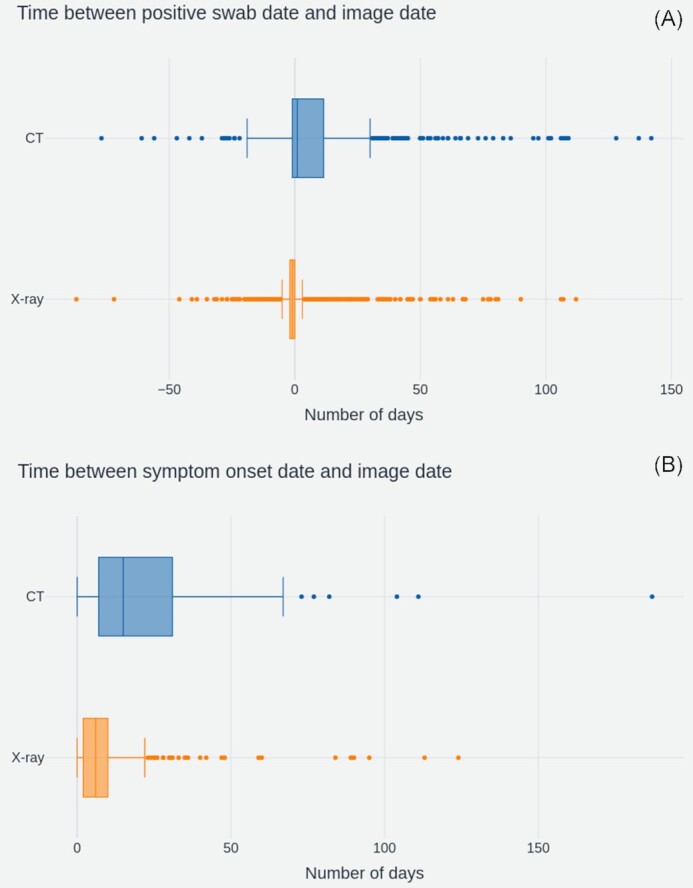
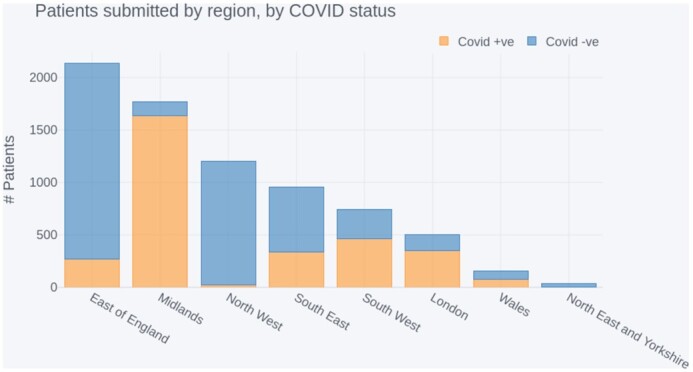
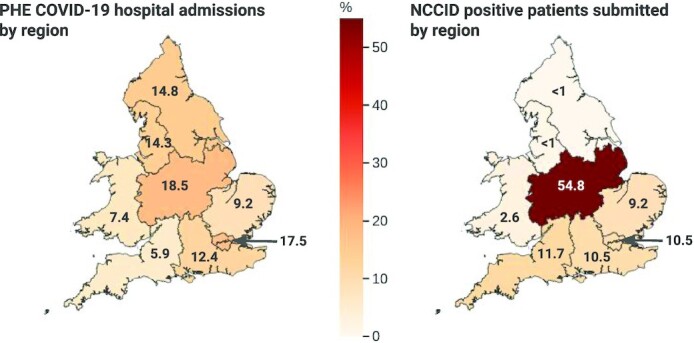
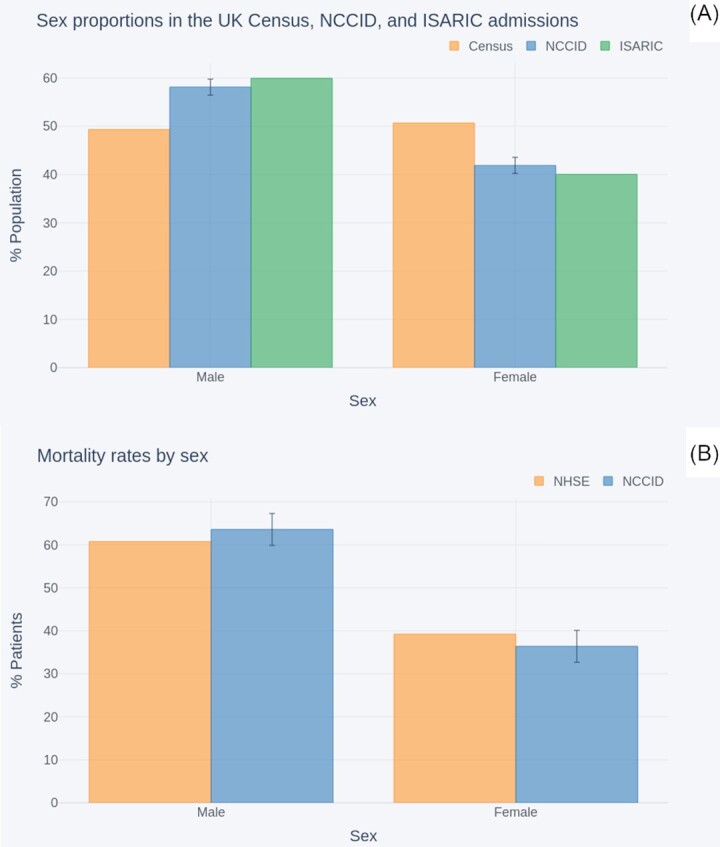
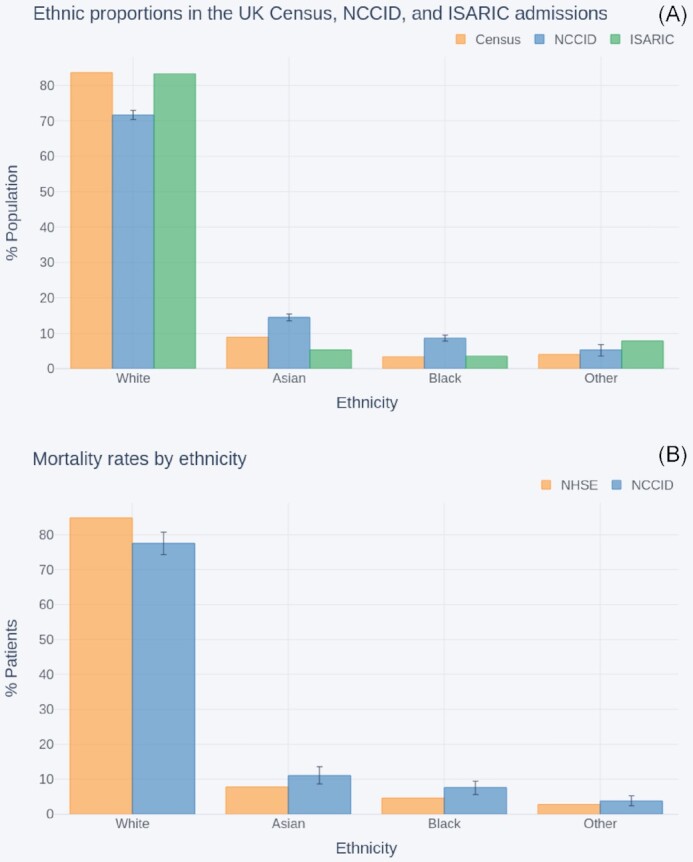
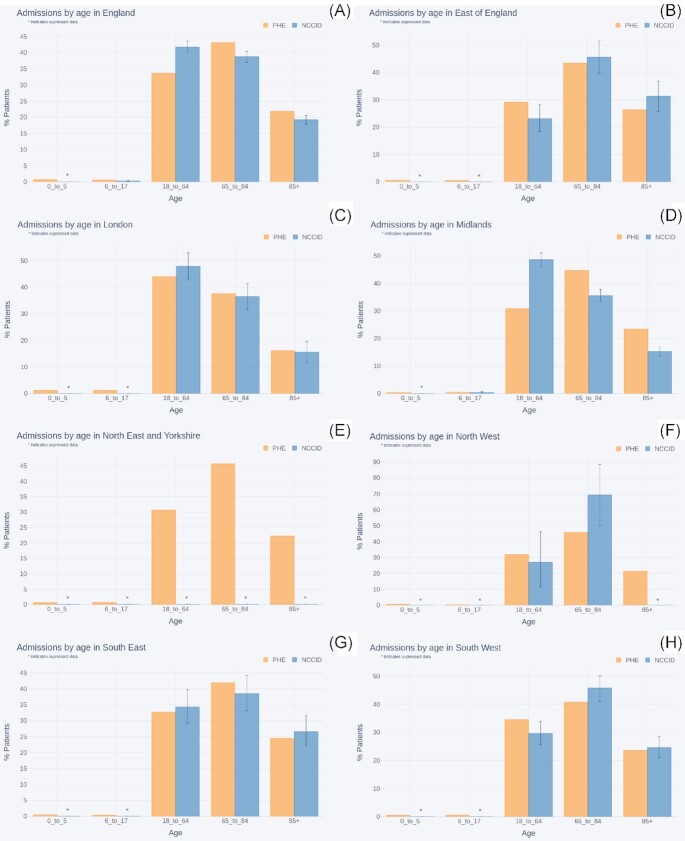
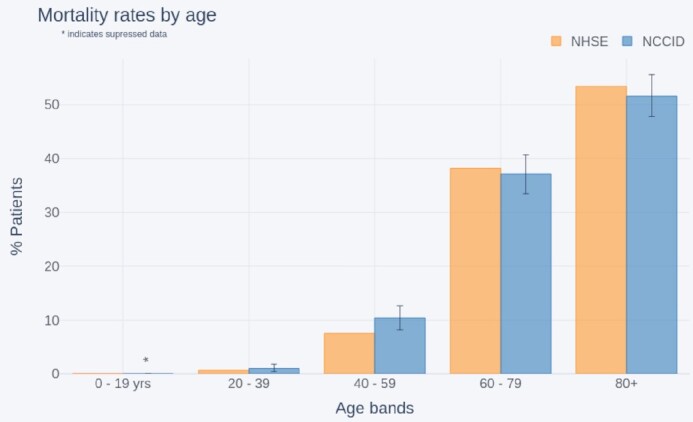
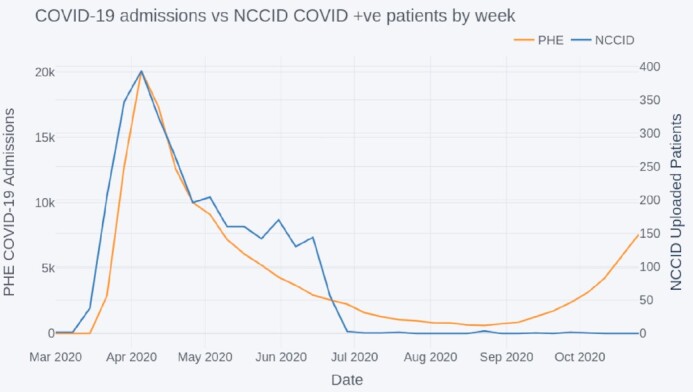
Findings: The NCCID offers high-quality DICOM images acquired across a variety of imaging machinery; multiple time points including historical images are available for a subset of patients. This volume and variety make the database well suited to development of diagnostic/prognostic models for COVID-associated respiratory conditions. Historical images and clinical data may aid long-term risk stratification, particularly as availability of comorbidity data increases through linkage to other resources. The cohort analysis revealed good alignment to general UK COVID-19 statistics for some categories, e.g., sex, whilst identifying areas for improvements to data collection methods, particularly geographic coverage.
Conclusion: The NCCID is a growing resource that provides researchers with a large, high-quality database that can be leveraged both to support the response to the COVID-19 pandemic and as a test bed for building clinically viable medical imaging models.
Keywords: COVID-19; SARS-CoV2; machine learning; medical imaging; thoracic imaging.
© The Author(s) 2021. Published by Oxford University Press GigaScience.
Conflict of interest statement
The authors declare that they have no competing interests.
Figures
References
-
- Hosseiny M, Kooraki S, Gholamrezanezhad A, et al. Radiology perspective of coronavirus disease 2019 (COVID-19): lessons from severe acute respiratory syndrome and Middle East respiratory syndrome. Am J Roentgenol. 2020;214(5):1078–82. - PubMed
Publication types
MeSH terms
Grants and funding
LinkOut - more resources
Full Text Sources
Medical
Miscellaneous
