

Mitochondrial mutations in Caenorhabditis elegans show signatures of oxidative damage and an AT-bias
- PMID: 34849888
- PMCID: PMC8633081
- DOI: 10.1093/genetics/iyab116
Mitochondrial mutations in Caenorhabditis elegans show signatures of oxidative damage and an AT-bias
Abstract
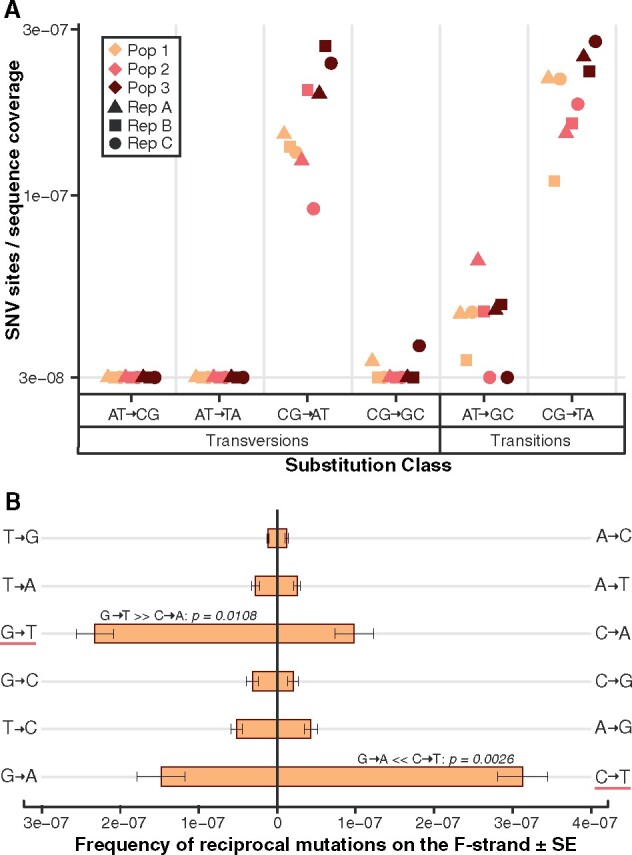
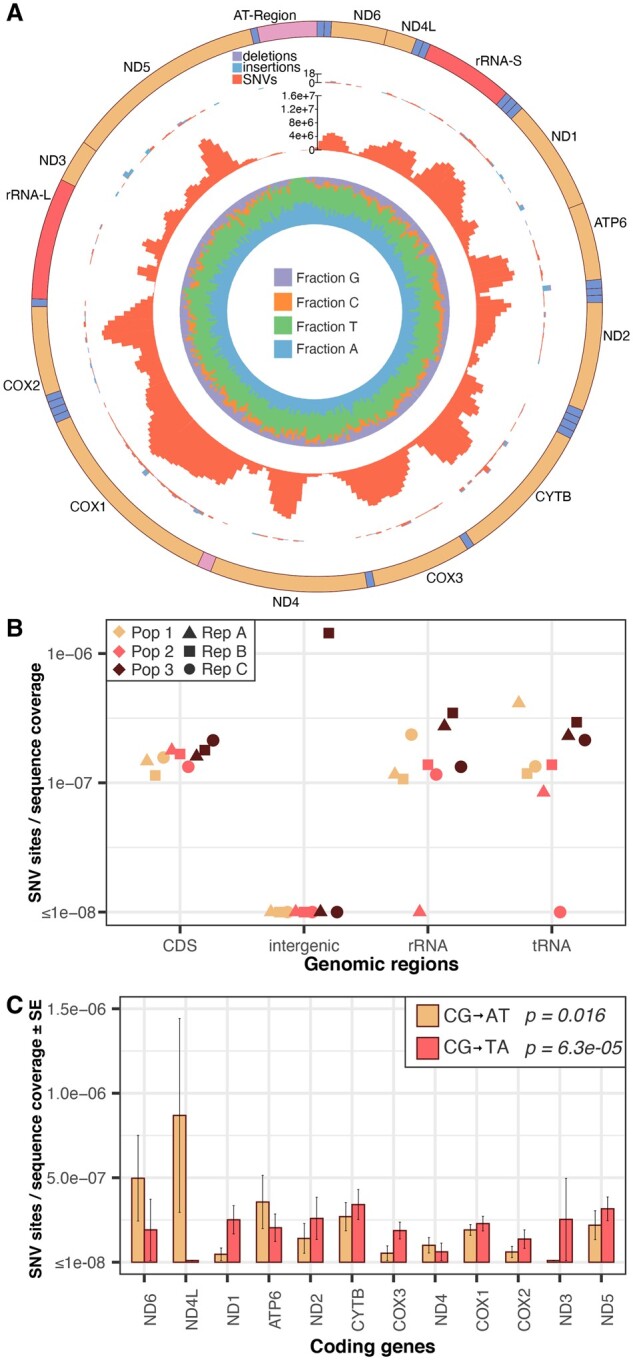
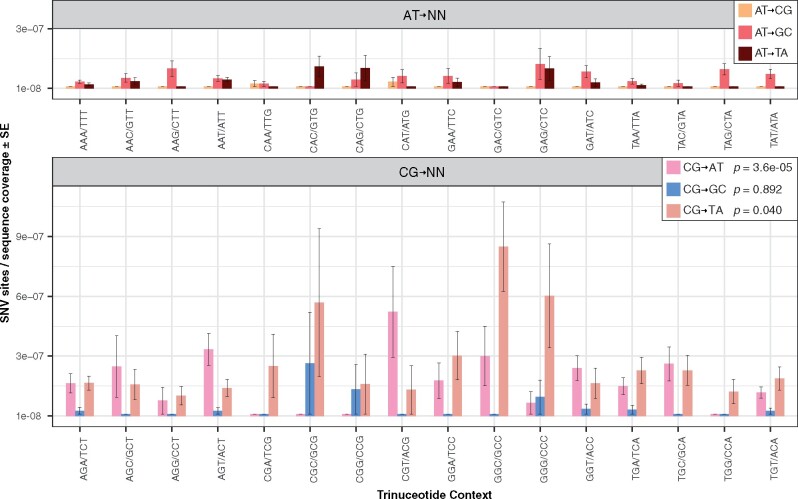
Rapid mutation rates are typical of mitochondrial genomes (mtDNAs) in animals, but it is not clear why. The difficulty of obtaining measurements of mtDNA mutation that are not biased by natural selection has stymied efforts to distinguish between competing hypotheses about the causes of high mtDNA mutation rates. Several studies which have measured mtDNA mutations in nematodes have yielded small datasets with conflicting conclusions about the relative abundance of different substitution classes (i.e., the mutation spectrum). We therefore leveraged Duplex Sequencing, a high-fidelity DNA sequencing technique, to characterize de novo mtDNA mutations in Caenorhabditis elegans. This approach detected nearly an order of magnitude more mtDNA mutations than documented in any previous nematode mutation study. Despite an existing extreme AT bias in the C. elegans mtDNA (75.6% AT), we found that a significant majority of mutations increase genomic AT content. Compared to some prior studies in nematodes and other animals, the mutation spectrum reported here contains an abundance of CG→AT transversions, supporting the hypothesis that oxidative damage may be a driver of mtDNA mutations in nematodes. Furthermore, we found an excess of G→T and C→T changes on the coding DNA strand relative to the template strand, consistent with increased exposure to oxidative damage. Analysis of the distribution of mutations across the mtDNA revealed significant variation among protein-coding genes and as well as among neighboring nucleotides. This high-resolution view of mitochondrial mutations in C. elegans highlights the value of this system for understanding relationships among oxidative damage, replication error, and mtDNA mutation.
Keywords: Duplex Sequencing; cytosine deamination; low-frequency variant; metazoan mtDNA; mitochondrial mutation; mutation accumulation; mutation spectra; oxidative damage; oxidized guanine; replication error.
© The Author(s) 2021. Published by Oxford University Press on behalf of Genetics Society of America. All rights reserved. For permissions, please email: journals.permissions@oup.com.
Figures
Similar articles
-
Resistance of mitochondrial DNA to cadmium and Aflatoxin B1 damage-induced germline mutation accumulation in C. elegans.Nucleic Acids Res. 2022 Aug 26;50(15):8626-8642. doi: 10.1093/nar/gkac666. Nucleic Acids Res. 2022. PMID: 35947695 Free PMC article.
-
Ultra-sensitive sequencing reveals an age-related increase in somatic mitochondrial mutations that are inconsistent with oxidative damage.PLoS Genet. 2013;9(9):e1003794. doi: 10.1371/journal.pgen.1003794. Epub 2013 Sep 26. PLoS Genet. 2013. PMID: 24086148 Free PMC article.
-
The mitochondrial genomes of two nematodes, Caenorhabditis elegans and Ascaris suum.Genetics. 1992 Mar;130(3):471-98. doi: 10.1093/genetics/130.3.471. Genetics. 1992. PMID: 1551572 Free PMC article.
-
Different faces of mitochondrial DNA mutators.Biochim Biophys Acta. 2015 Nov;1847(11):1362-72. doi: 10.1016/j.bbabio.2015.05.016. Epub 2015 May 23. Biochim Biophys Acta. 2015. PMID: 26014346 Review.
-
Mitochondrial theory of aging matures--roles of mtDNA mutation and oxidative stress in human aging.Zhonghua Yi Xue Za Zhi (Taipei). 2001 May;64(5):259-70. Zhonghua Yi Xue Za Zhi (Taipei). 2001. PMID: 11499335 Review.
Cited by
-
Investigating low frequency somatic mutations in Arabidopsis with Duplex Sequencing.bioRxiv [Preprint]. 2024 Feb 1:2024.01.31.578196. doi: 10.1101/2024.01.31.578196. bioRxiv. 2024. Update in: Genome Biol Evol. 2024 Oct 9;16(10):evae213. doi: 10.1093/gbe/evae213. PMID: 38352550 Free PMC article. Updated. Preprint.
-
Understanding the impact of mitochondrial DNA mutations on aging and carcinogenesis (Review).Int J Mol Med. 2025 Aug;56(2):118. doi: 10.3892/ijmm.2025.5559. Epub 2025 Jun 6. Int J Mol Med. 2025. PMID: 40476552 Free PMC article. Review.
-
Inheritance through the cytoplasm.Heredity (Edinb). 2022 Jul;129(1):31-43. doi: 10.1038/s41437-022-00540-2. Epub 2022 May 7. Heredity (Edinb). 2022. PMID: 35525886 Free PMC article. Review.
-
Association of Inflammatory Mediators with Mitochondrial DNA Variants in Geriatric COVID-19 Patients.Aging Dis. 2024 Feb 9;15(6):2665-2681. doi: 10.14336/AD.2023.1123. Aging Dis. 2024. PMID: 38377022 Free PMC article.
-
Mitochondria in the Spotlight: C. elegans as a Model Organism to Evaluate Xenobiotic-Induced Dysfunction.Cells. 2023 Aug 22;12(17):2124. doi: 10.3390/cells12172124. Cells. 2023. PMID: 37681856 Free PMC article. Review.
References
-
- Allio R, Donega S, Galtier N, Nabholz B.. 2017. Large variation in the ratio of mitochondrial to nuclear mutation rate across animals: Implications for genetic diversity and the use of mitochondrial DNA as a molecular marker. Mol Biol Evol. 34:2762–2772. - PubMed
-
- Bernt M, Bleidorn C, Braband A, Dambach J, Donath A, et al.2013. A comprehensive analysis of bilaterian mitochondrial genomes and phylogeny. Mol Phylogenet Evol. 69:352–364. - PubMed
Publication types
MeSH terms
Substances
Grants and funding
LinkOut - more resources
Full Text Sources
Other Literature Sources
Miscellaneous
