

Trends in Added Sugars Intake and Sources Among US Children, Adolescents, and Teens Using NHANES 2001-2018
- PMID: 34850066
- PMCID: PMC8826875
- DOI: 10.1093/jn/nxab395
Trends in Added Sugars Intake and Sources Among US Children, Adolescents, and Teens Using NHANES 2001-2018
Abstract
Background: Over the past 2 decades, there has been an increased emphasis on added sugars intake in the Dietary Guidelines for Americans (DGA), which has been accompanied by policies and interventions aimed at reducing intake, particularly among children, adolescents, and teens.
Objectives: The present study provides a comprehensive time-trends analysis of added sugars intakes and contributing sources in the diets of US children, adolescents, and teens (2-18 years) from 2001-2018, focusing on variations according to sociodemographic factors (age, sex, race and ethnicity, income), food assistance, and health-related factors (physical activity level, body weight status).
Methods: Data from 9 consecutive 2-year cycles of the NHANES were combined and regression analyses were conducted to test for trends in added sugars intake and sources from 2001-2018 for the overall age group (2-18 years) and for 2 age subgroups (2-8 and 9-18 years). Trends were also examined on subsamples stratified by sex, race and ethnicity (Hispanic, non-Hispanic Asian, non-Hispanic Black, non-Hispanic White), income (household poverty income ratio), food assistance, physical activity level, and body weight status.
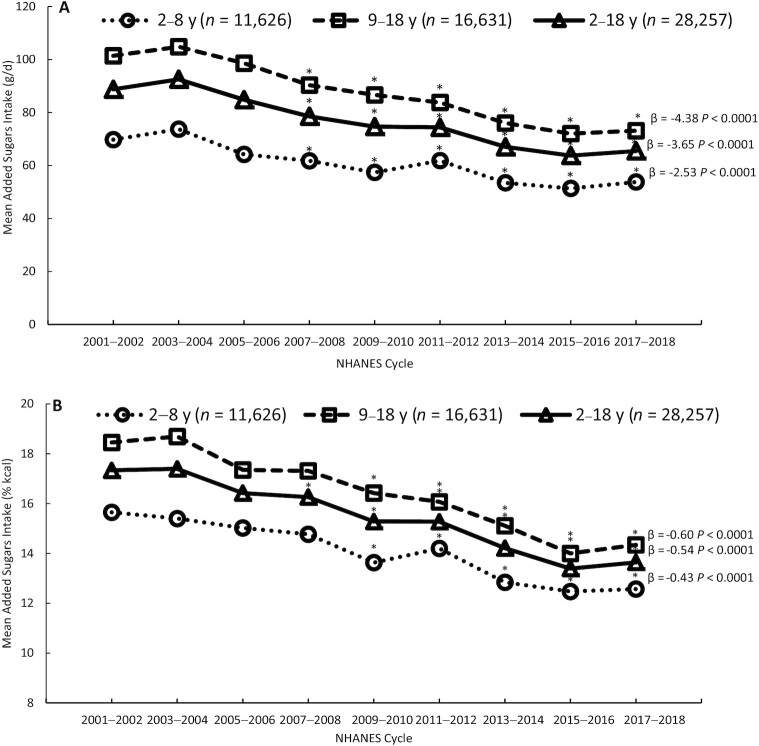
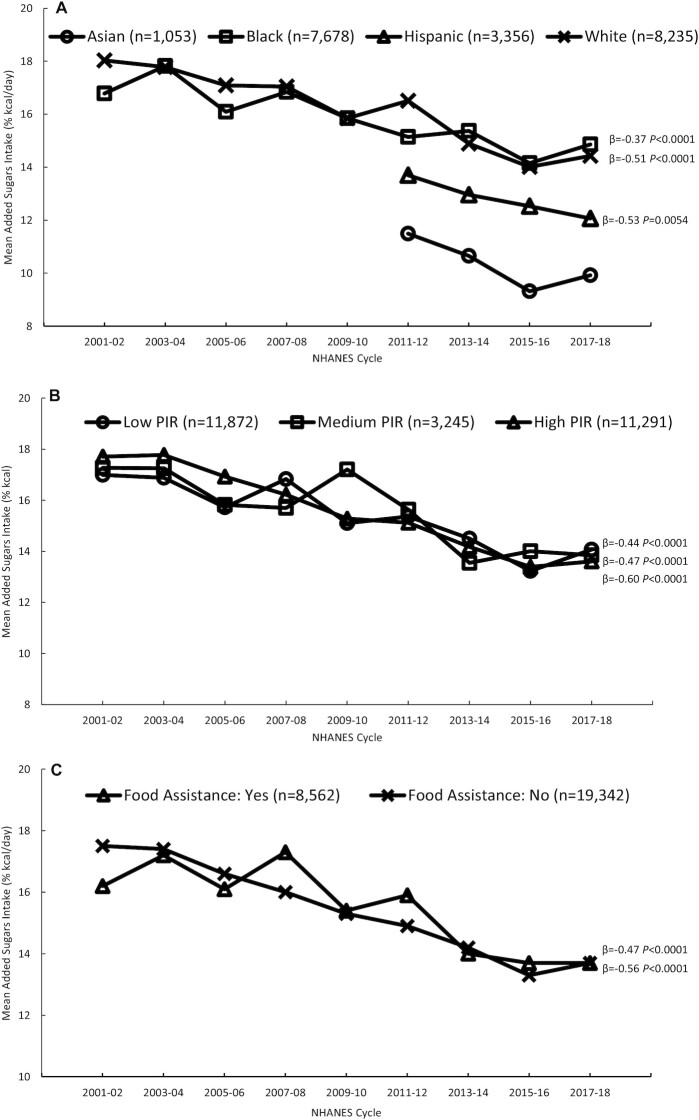
Results: From 2001-2018, added sugars intakes decreased significantly (P < 0.01), from 15.6% to 12.6% kcal among children (2-8 years) and from 18.4% to 14.3% kcal among adolescents and teens (9-18 years), mainly due to significant declines in added sugars from sweetened beverages, which remained the top source. Declines in added sugars intakes were observed for all strata, albeit to varying degrees.
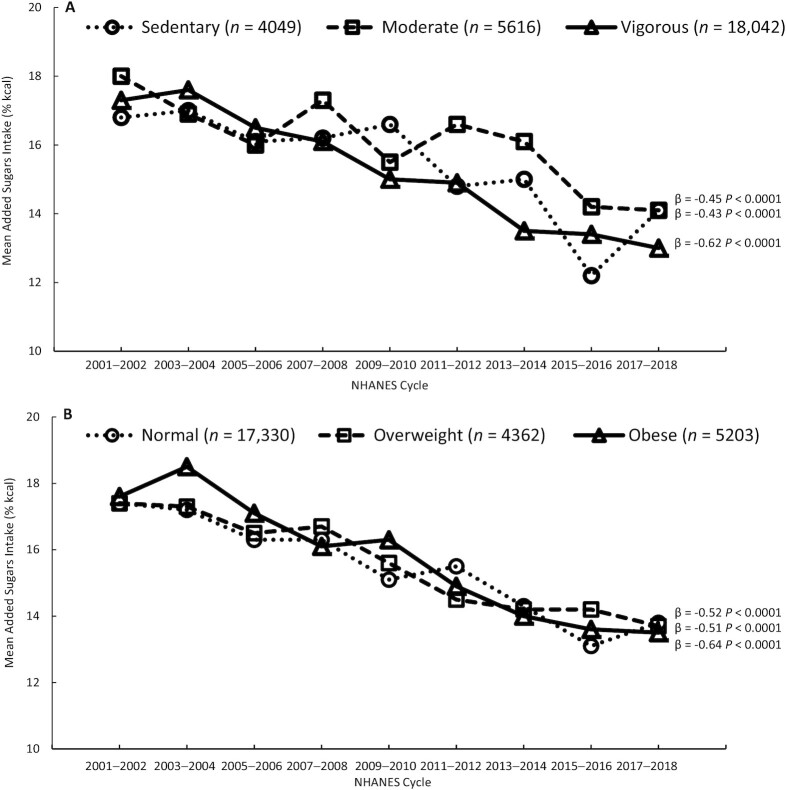
Conclusions: Declines in added sugars intakes were observed among children, adolescents, and teens from 2001-2018, regardless of sociodemographic factors, food assistance, physical activity level, or body weight status, but variations in the magnitudes of decline suggest persistent disparities related to race and ethnicity and to income. Despite these declines, intakes remain above the DGA recommendation; thus, continued monitoring is warranted.
Keywords: NHANES; United States; added sugars; adolescents; children; intake; sources; teens; trends.
© The Author(s) 2021. Published by Oxford University Press on behalf of the American Society for Nutrition.
Figures
Similar articles
-
Trends in added sugars intake and sources among U.S. adults using the National Health and Nutrition Examination Survey (NHANES) 2001-2018.Front Nutr. 2022 Aug 18;9:897952. doi: 10.3389/fnut.2022.897952. eCollection 2022. Front Nutr. 2022. PMID: 36061886 Free PMC article.
-
Children and Adolescents in the United States with Usual High Added Sugars Intake: Characteristics, Eating Occasions, and Top Sources, 2015-2018.Nutrients. 2023 Jan 5;15(2):274. doi: 10.3390/nu15020274. Nutrients. 2023. PMID: 36678144 Free PMC article.
-
Added Sugars Intake Across the Distribution of US Children and Adult Consumers: 1977-2012.J Acad Nutr Diet. 2016 Oct;116(10):1543-1550.e1. doi: 10.1016/j.jand.2016.06.003. Epub 2016 Aug 1. J Acad Nutr Diet. 2016. PMID: 27492320 Free PMC article.
-
A review of total & added sugar intakes and dietary sources in Europe.Nutr J. 2017 Jan 21;16(1):6. doi: 10.1186/s12937-016-0225-2. Nutr J. 2017. PMID: 28109280 Free PMC article. Review.
-
Nutrition Monitoring of Children Aged Birth to 24 Mo (B-24): Data Collection and Findings from the NHANES.Adv Nutr. 2020 Jan 1;11(1):113-127. doi: 10.1093/advances/nmz077. Adv Nutr. 2020. PMID: 31390469 Free PMC article. Review.
Cited by
-
Trends in Diet Quality by Race/Ethnicity among Adults in the United States for 2011-2018.Nutrients. 2022 Oct 8;14(19):4178. doi: 10.3390/nu14194178. Nutrients. 2022. PMID: 36235830 Free PMC article.
-
Added sugars and risk of osteoarthritis in adults: A case-control study based on National Health and Nutrition Examination Survey 2007-2018.PLoS One. 2024 Nov 14;19(11):e0313754. doi: 10.1371/journal.pone.0313754. eCollection 2024. PLoS One. 2024. PMID: 39541365 Free PMC article.
-
Sugar Intake among Preschool-Aged Children in the Guelph Family Health Study: Associations with Sociodemographic Characteristics.Children (Basel). 2023 Aug 27;10(9):1459. doi: 10.3390/children10091459. Children (Basel). 2023. PMID: 37761420 Free PMC article.
-
Trends in Calcium Intake among the US Population: Results from the NHANES (1999-2018).Nutrients. 2024 Mar 2;16(5):726. doi: 10.3390/nu16050726. Nutrients. 2024. PMID: 38474853 Free PMC article.
-
Comparison of foods and beverages served and consumed in Child and Adult Care Food Program-participating childcare centres to national guidelines.Public Health Nutr. 2023 Sep;26(9):1862-1870. doi: 10.1017/S136898002300109X. Epub 2023 Jun 8. Public Health Nutr. 2023. PMID: 37288521 Free PMC article.
References
-
- World Health Organization . Guideline: Sugars intake for adults and children. WHO: Geneva, Switzerland; 2015. Available from[Internet]: http://www.who.int/nutrition/publications/guidelines/sugars_intake/en/. - PubMed
-
- US Department of Agriculture and US Department of Health and Human Services . Previous editions of the Dietary Guidelines for Americans. U.S. Department of Agriculture: Washington, DC; Available from[Internet]: https://www.dietaryguidelines.gov/about-dietary-guidelines/previous-edit...
-
- US Department of Agriculture and US Department of Health and Human Services. Dietary Guidelines for Americans, 2020–2025. U.S. Department of Agriculture: Washington, DC; 2020. Available from[Internet]: https://www.dietaryguidelines.gov/.
Publication types
MeSH terms
Substances
LinkOut - more resources
Full Text Sources
Miscellaneous
