. 2022 Jan 25;50(2):e12.
doi: 10.1093/nar/gkab1071.

Enhancing biological signals and detection rates in single-cell RNA-seq experiments with cDNA library equalization

Affiliations

Enhancing biological signals and detection rates in single-cell RNA-seq experiments with cDNA library equalization

Rhonda Bacher et al. Nucleic Acids Res. .

Abstract

Considerable effort has been devoted to refining experimental protocols to reduce levels of technical variability and artifacts in single-cell RNA-sequencing data (scRNA-seq). We here present evidence that equalizing the concentration of cDNA libraries prior to pooling, a step not consistently performed in single-cell experiments, improves gene detection rates, enhances biological signals, and reduces technical artifacts in scRNA-seq data. To evaluate the effect of equalization on various protocols, we developed Scaffold, a simulation framework that models each step of an scRNA-seq experiment. Numerical experiments demonstrate that equalization reduces variation in sequencing depth and gene-specific expression variability. We then performed a set of experiments in vitro with and without the equalization step and found that equalization increases the number of genes that are detected in every cell by 17-31%, improves discovery of biologically relevant genes, and reduces nuisance signals associated with cell cycle. Further support is provided in an analysis of publicly available data.


Figures

Figure 1.
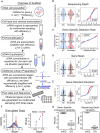
Figure 1.
(A) Overview of the Scaffold simulation framework. Further details are provided in Methods. (B–E) Cell-specific and gene-specific properties of the data simulated based on the unEQ EC dataset. (F) Density plots of the distribution of estimated count-depth rates (quantified as the gene-specific slope of a median quantile regression) for the unEQ EC dataset for genes grouped by expression level (left) and the mode of each group's slope distribution (right). The median absolute deviation of the slope modes from one (MAD) is used to quantify the variability in the count-depth rate. (G) The percent change in gene-specific variability (left) and sequencing depth (right) is shown for multiple pairs of unequalized and equalized datasets. Multiple pairs of unequalized experiments were also simulated and compared to demonstrate the percent of change due to random sampling.
Figure 2.
Figure 2.
Overview of experiment to assess the effect of cDNA equalization and comparisons of cell-level detection rates. (A) Four experiments were conducted involving cells from two different conditions (EC and TB). Using the same initial pools of single-cell cDNA, we created unequalized and equalized sequencing libraries. (B) Violin plots with points overlaid of the number of genes detected per cell for all cells in each experiment.
Figure 3.
Figure 3.
Equalization improves detection rates and decreases expression variability. (A) For the EC dataset, genes were divided into four equally sized groups based on their median nonzero expression. For each gene, the difference between the detection rate in the EQ versus the unEQ experiments was calculated. The cumulative distribution curve is shown for the detection rate differences for genes in each expression group. The two horizonal dotted lines indicate the proportion of genes that decrease in detection rate (bottom line) and one minus the proportion of genes that increase in detection rate (top line). (B) Same as A for the TB dataset. (C) Scatter plot of every gene's mean and variance for the unEQ (top) and EQ (bottom) datasets (light gray). The smoothed fit line represents technical variability. The mean and variance were calculated over all cells, both EC and TB. Genes having significantly high biological variability in either dataset are shown in dark gray. Shown in red are the highly variable genes in the unEQ dataset only, and in blue are the highly variable genes in the EQ dataset only. In the table are the top three GO biological processes enriched for genes that are only HVG in the unEQ (red) or EQ (blue) experiments.
Figure 4.
Figure 4.
Count-depth rate in equalized scRNA-seq experiments. (A) For the unEQ and EQ EC datasets, the count-depth rate was calculated for all genes as the slope of a median quantile regression. Genes were divided into ten equally sized groups based on their median nonzero expression across all cells in the dataset. (B) The median absolute deviation (MAD) of the modal slope for each experiment is shown. (C) Same as A for seven representative datasets from seven published studies. (D) Similar to (B) for all datasets in the seven published studies. The solid line indicates the mean MAD and the dashed line indicates one standard deviation.
Figure 5.
Figure 5.
Pairs of unequalized and equalized experiments having two populations were simulated using Scaffold. Datasets were embedded in two-dimensions using UMAP and the silhouette distance was calculated for each dataset. (A) UMAP plot of one simulated unequalized dataset. (B) UMAP plot of one simulated equalized dataset. (C) Across all simulations, 62% had larger equalized silhouette distances compared to those of the paired unequalized distances (P-value < .001). The silhouette distances were permuted for each simulated dataset to obtain a sampling distribution under the null hypothesis of no difference due to equalization. P-values (p) were calculated over 10 000 permutations. The histogram shows the permutation distribution of the proportion of equalized simulated datasets having a larger silhouette distance. (D) The permutation distribution of the median silhouette differences. The median differences between unequalized and equalized simulated datasets was 0.041 (P-value < 0.001).

Similar articles

Cited by

References

    1. Svensson V., Vento-Tormo R., Teichmann S.A.. Exponential scaling of single-cell RNA-seq in the past decade. Nat. Protoc. 2018; 13:599–604. - PubMed
    1. Hicks S.C., Townes F.W., Teng M., Irizarry R.A.. Missing data and technical variability in single-cell RNA-sequencing experiments. Biostatistics. 2018; 19:562–578. - PMC - PubMed
    1. Bacher R., Chu L.-F., Leng N., Gasch A.P., Thomson J.A., Stewart R.M., Newton M., Kendziorski C.. SCnorm: robust normalization of single-cell RNA-seq data. Nat. Methods. 2017; 14:584–586. - PMC - PubMed
    1. Phipson B., Zappia L., Oshlack A.. Gene length and detection bias in single cell RNA sequencing protocols. F1000Res. 2017; 6:595. - PMC - PubMed
    1. Finak G., McDavid A., Yajima M., Deng J., Gersuk V., Shalek A.K., Slichter C.K., Miller H.W., McElrath M.J., Prlic M.et al.. MAST: a flexible statistical framework for assessing transcriptional changes and characterizing heterogeneity in single-cell RNA sequencing data. Genome Biol. 2015; 16:278. - PMC - PubMed

Publication types