. 2022 Jan 7;50(D1):D1348-D1357.
doi: 10.1093/nar/gkab1084.

PharmacoDB 2.0: improving scalability and transparency of in vitro pharmacogenomics analysis

Affiliations

PharmacoDB 2.0: improving scalability and transparency of in vitro pharmacogenomics analysis

Nikta Feizi et al. Nucleic Acids Res. .

Abstract

Cancer pharmacogenomics studies provide valuable insights into disease progression and associations between genomic features and drug response. PharmacoDB integrates multiple cancer pharmacogenomics datasets profiling approved and investigational drugs across cell lines from diverse tissue types. The web-application enables users to efficiently navigate across datasets, view and compare drug dose-response data for a specific drug-cell line pair. In the new version of PharmacoDB (version 2.0, https://pharmacodb.ca/), we present (i) new datasets such as NCI-60, the Profiling Relative Inhibition Simultaneously in Mixtures (PRISM) dataset, as well as updated data from the Genomics of Drug Sensitivity in Cancer (GDSC) and the Genentech Cell Line Screening Initiative (gCSI); (ii) implementation of FAIR data pipelines using ORCESTRA and PharmacoDI; (iii) enhancements to drug-response analysis such as tissue distribution of dose-response metrics and biomarker analysis; and (iv) improved connectivity to drug and cell line databases in the community. The web interface has been rewritten using a modern technology stack to ensure scalability and standardization to accommodate growing pharmacogenomics datasets. PharmacoDB 2.0 is a valuable tool for mining pharmacogenomics datasets, comparing and assessing drug-response phenotypes of cancer models.


Figures

Graphical abstract
Graphical abstract
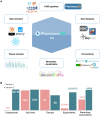
PharmacoDB 2.0 : Improving scalability and transparency of in vitro pharmacogenomics analysis.
Figure 1.
Figure 1.
PharmacoDB 2.0 overview. (A) The new version of PharmacoDB includes updated and new large-scale pharmacogenomic datasets. The web-application contains enriched annotations for drugs and cell lines via connectivity to external databases. PharmacoDB 2.0 includes new analytical methods for tissue-specific and pan-cancer biomarker discovery. The new web-interface ensures scalability and simplifies maintenance. PharmacoDB 2.0 is made fully reproducible through the use of the ORCESTRA platform and automated data ingestion pipelines. (B) Bar plots showing previous (Version 1) and current (Version 2) database statistics.
Figure 2.
Figure 2.
Computational processing pipeline of raw pharmacogenomic data for ingestion into PharmacoDB. Different panels show the process of ingesting public datasets into PharmacoDB 2.0. The first panel highlights the sources of the newly added datasets, while the subsequent panels highlight the tools and technologies used for Data Processing and Standardization, Data Ingestion and Annotation, and for building the PharmacoDB 2.0 web app itself.
Figure 3.
Figure 3.
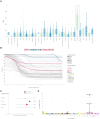
Visualization of tissue-specific drug–response and gene–drug associations. (A) Drug response (AAC) of Dabrafenib across various tissues from all datasets. (B) Differential sensitivity of skin cell lines to Dabrafenib; cell lines and datasets of interest can be highlighted in the plot by checking the boxes. (C) Forest plot of Pearson correlations between Lapatinib response and ERBB2 expression in breast tissue. Data from RNA sequencing is shown here. The significant associations (FDR < 0.05 and pearson correlation coefficient, r > 0.7) is highlighted in bright pink. (D) Manhattan plot showing the association of copy number alterations with Lapatinib response in all datasets and across all tissue types, with ERBB2 highlighted. The genomic coordinates are displayed on the x-axis, and negative logarithm of the association P-value is displayed on the y-axis. The different colors of each block show the extent of each chromosome.

Similar articles

Cited by

References

    1. Shoemaker R.H. The NCI60 human tumour cell line anticancer drug screen. Nat. Rev. Cancer. 2006; 6:813–823. - PubMed
    1. Garnett M.J., Edelman E.J., Heidorn S.J., Greenman C.D., Dastur A., Lau K.W., Greninger P., Thompson I.R., Luo X., Soares J.et al. .. Systematic identification of genomic markers of drug sensitivity in cancer cells. Nature. 2012; 483:570–575. - PMC - PubMed
    1. Yang W., Soares J., Greninger P., Edelman E.J., Lightfoot H., Forbes S., Bindal N., Beare D., Smith J.A., Thompson I.R.et al. .. Genomics of Drug Sensitivity in Cancer (GDSC): a resource for therapeutic biomarker discovery in cancer cells. Nucleic Acids Res. 2013; 41:D955–D961. - PMC - PubMed
    1. Rees M.G., Seashore-Ludlow B., Cheah J.H., Adams D.J., Price E.V., Gill S., Javaid S., Coletti M.E., Jones V.L., Bodycombe N.E.et al. .. Correlating chemical sensitivity and basal gene expression reveals mechanism of action. Nat. Chem. Biol. 2016; 12:109–116. - PMC - PubMed
    1. Barretina J., Caponigro G., Stransky N., Venkatesan K., Margolin A.A., Kim S., Wilson C.J., Lehár J., Kryukov G.V., Sonkin D.et al. .. The Cancer Cell Line Encyclopedia enables predictive modelling of anticancer drug sensitivity. Nature. 2012; 483:603–607. - PMC - PubMed

Publication types