. 2021 Dec 16;49(22):12895-12911.
doi: 10.1093/nar/gkab1094.

MLL1 is regulated by KSHV LANA and is important for virus latency

Affiliations

MLL1 is regulated by KSHV LANA and is important for virus latency

Min Tan et al. Nucleic Acids Res. .

Abstract

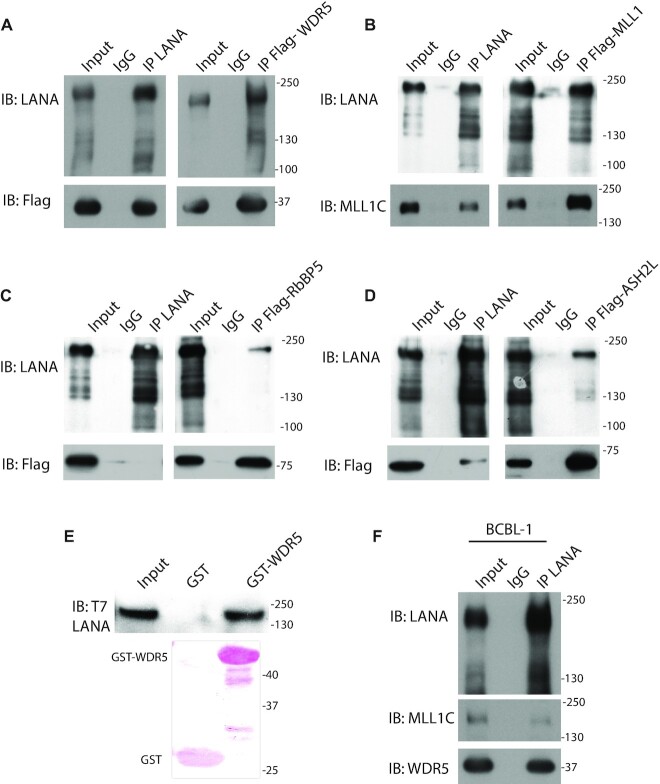
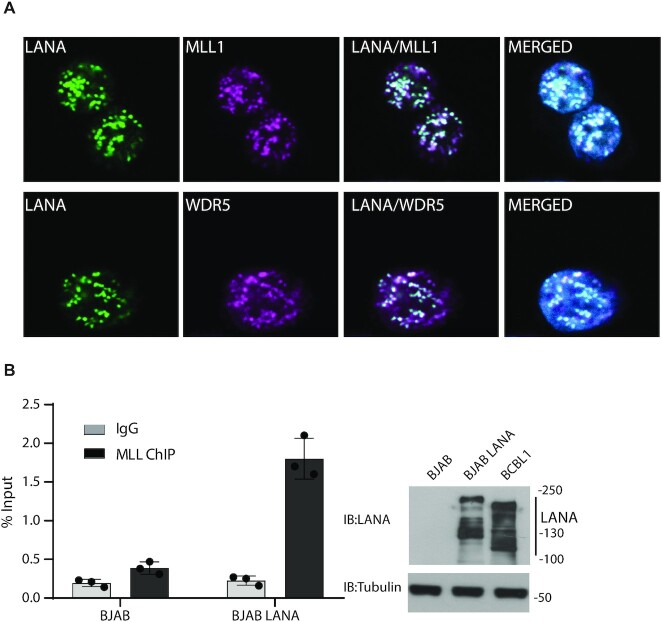
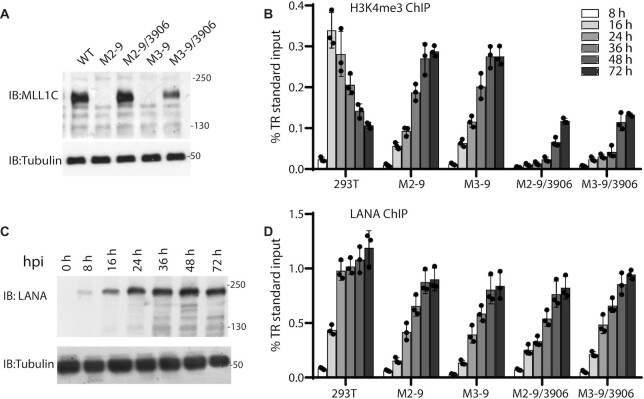
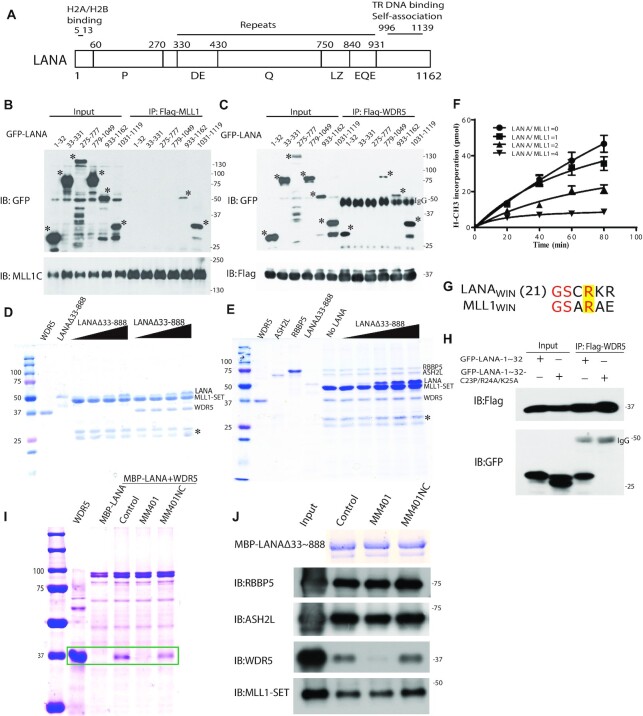
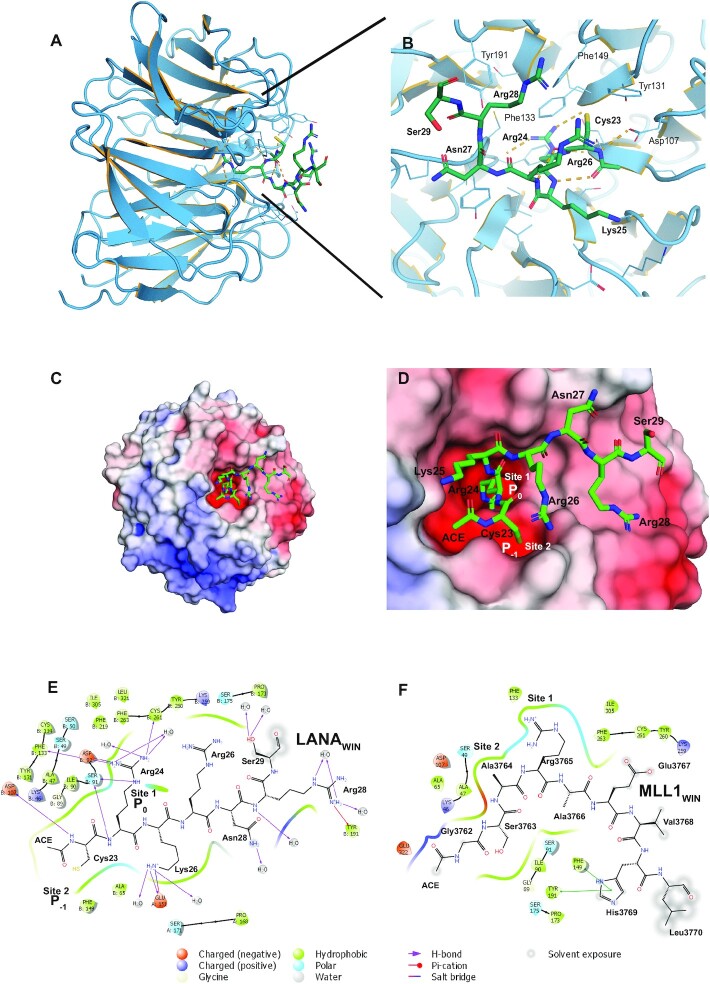
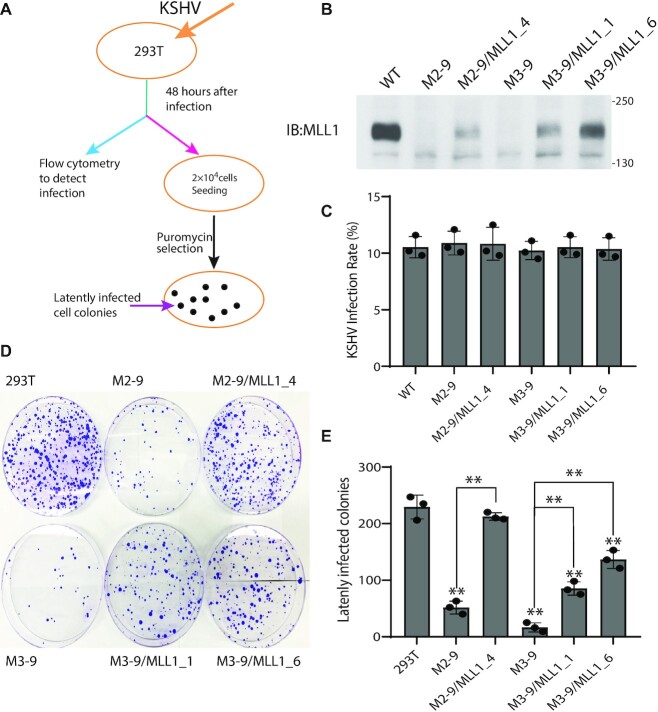
Mixed lineage leukemia 1 (MLL1) is a histone methyltransferase. Kaposi's sarcoma-associated herpesvirus (KSHV) is a leading cause of malignancy in AIDS. KSHV latently infects tumor cells and its genome is decorated with epigenetic marks. Here, we show that KSHV latency-associated nuclear antigen (LANA) recruits MLL1 to viral DNA where it establishes H3K4me3 modifications at the extensive KSHV terminal repeat elements during primary infection. LANA interacts with MLL1 complex members, including WDR5, integrates into the MLL1 complex, and regulates MLL1 activity. We describe the 1.5-Å crystal structure of N-terminal LANA peptide complexed with MLL1 complex member WDR5, which reveals a potential regulatory mechanism. Disruption of MLL1 expression rendered KSHV latency establishment highly deficient. This deficiency was rescued by MLL1 but not by catalytically inactive MLL1. Therefore, MLL1 is LANA regulable and exerts a central role in virus infection. These results suggest broad potential for MLL1 regulation, including by non-host factors.


Figures

Figure 1.
Figure 1.
LANA interacts with MLL1 complex components. (A–D) Reciprocal co-immunopreciptiations (IPs) of LANA and (A) WDR5, (B) MLL1, (C) RbBP5 or (D) ASH2L from whole cell lysates after expression in 293T cells. WDR5, RbBP5, ASH2L, or MLL1 were immunoprecipitated with anti-Flag, and LANA with anti-LANA antibody, or IgG control used. (E) GST or GST-WDR5 precipitation of in vitro translated full length T7 epitope tagged LANA. Ponceau S stained GST and GST-WDR5 are shown. (F) IP of endogenous LANA from KSHV infected BCBL1 cell nuclear lysate followed by detection of MLL1 or WDR5. (A–E) Molecular weight (kDa) indicated at right.
Figure 2.
Figure 2.
LANA colocalizes with MLL1 and WDR5 in infected cells and recruits MLL1 to TR DNA. (A) Immunofluorescent detection of LANA (green), WDR5 (magenta) or MLL1 (magenta) in BCBL1 primary effusion lymphoma cells. Overlay of green and magenta generates white. Merged images include DAPI (blue). Magnification: 630×. Pearson correlation coefficients are 0.87 for LANA and MLL1, and 0.77 for LANA and WDR5. (B) ChIP for MLL1 binding at TR DNA was performed after transfection of p8TR into uninfected BJAB B lymphoma cells or BJAB cells stably expressing LANA. Bars are averages of three experiments. Individual data points and standard deviation are shown. Immunoblot of LANA or tubulin in BJAB, BJAB/LANA or BCBL1 cells is shown at right. LANA is expressed as multiple bands due to alternative initiation of translation and an alternative poly adenylation signal (85,86). The LANA stably expressed in BJAB cells contains an N-terminal T7 epitope tag.
Figure 3.
Figure 3.
TR H3K4me3 modification by MLL1 is highly dynamic and varies with LANA occupancy. (A) Immunoblot of MLL1 from 293T, MLL1 KO cell lines M2-9 or M3-9, or MLL1 KO clones expressing MLL1-N3906A. (B) Relative H3K4me3 enrichment levels at KSHV TR DNA as assessed by ChIP in 293T, MLL1 KO, or MLL KO cells expressing MLL1-N3906A at the indicated times following KSHV infection. (C) LANA expression at indicated times following KSHV infection of 293T cells. (D) Relative LANA enrichment levels at the TR as assessed by ChIP in the indicated cell lines at different times post infection (same key for bar patterns as in panel (B).) (B and D) Bars show means from three independent experiments. Individual data points and standard deviation are shown.
Figure 4.
Figure 4.
LANA interacts with, and inhibits, the MLL1 complex. (A) Schematic diagram of LANA. LANA proline rich (P), aspartate and glutamate (DE), glutamine (Q), putative leucine zipper (LZ), glutamate and glutamine (EQE) regions. Residues 5–13 bind histones H2A/H2B (34,77). LANA 996 –1139 self-associates to bind terminal repeat (TR) DNA and independently associates with mitotic chromosomes. (B and C) Co-immunoprecipitation (Co-IP) of GFP-LANA regions with (B) MLL1 or (C) WDR5 after expression in 293T cells. IPs were performed using anti-Flag antibody. Asterisks denote GFP-LANA fusions. (D) LANAΔ33–888, or WDR5 (in lanes at right) co-precipitation with GST-MLL1-SET (E) ASH2L, RbBP5, WDR5 and LANAΔ33–888 co-precipitation with GST-MLL1-SET. (D, E) Triangles at top indicate increasing LANAΔ33–888 and asterisk indicates degradation products. (F) Histone methyltransferase activity of the MLL1 complex after incubation with increasing amounts of LANA. Results are the means of three independent experiments. Standard deviation is shown. (G) Sequence alignment of MLL1WIN with LANAWIN starting at LANA residue 21. Yellow highlight indicates the conserved arginine. (H) Co-IP of GFP-LANA-1–32 or GFP LANA-1–32 containing C23P/R24A/K25A substitutions with Flag-WDR5 after co-expression in 293T cells. (I) Co-precipitation of WDR5 with MBP-LANAΔ33–888 in the presence or absence MM401 or enantiomer control. Two left lanes, WDR5 or MBP-LANAΔ33–888 alone. Box encloses WDR5 bands. (J) ASH2L, RbBP5, WDR5, or MLL1-SET co-precipitation with MBP-LANAΔ33–888 after incubation in the presence or absence MM401 or enantiomer control. Proteins were detected by immunoblot except MBP-LANAΔ33–888, which was detected by Coomassie blue. (D, E, I) Proteins were detected with Coomassie blue.
Figure 5.
Figure 5.
Crystal structure of the LANA WDR5 complex. (A) Overview of LANAWIN (green) bound to WDR5 (blue ribbon). (B) Face on zoomed view of WDR5-binding cleft with LANA carbons green. Key hydrogen bonds are depicted as orange dash lines, solvent molecules and alternate conformations are removed for clarity. (C) Electrostatic surface representation of the ‘top’ face of the WDR5 β-propeller showing the orientation of the LANAWIN motif and (D) a zoomed view of the hydrophobic pockets (‘Site 1, 2’) that recognize both LANAWIN Cys23 and Arg24. Charged surfaces (red, negatively charged; blue, positively charged) were calculated with APBS (87). (E and F) Maestro representations of the ligand interactions of (E) LANAWIN or (F) MLL1WIN at the WDR5 binding site. Arg24 (LANA23-32) is equivalent to Arg3765 (MLL1WIN) in the arginine conserved motif. The WIN motif binding site surface is represented by the contoured line. WDR5 residues are differentiated by colors according to the interaction type as indicated at bottom. The 2D WDR5–ligand interaction diagrams were generated using the Ligand Interaction tool in Maestro (Schrödinger Inc., www.schrodinger.com).
Figure 6.
Figure 6.
MLL1 is critical for KSHV to establish latent infection. (A) Experimental design for assessing KSHV infection. 293T cells were infected with a multiplicity of infection of 0.1. (B) Immunoblot for MLL1 in WT 293T, M2-9 or M3-9 MLL1 knockout cells, or after stable expression of full length MLL1 in M2-9 or M3-9 cells. The cross-reactive band migrating below MLL1 indicates similar loading per lane. (C) KSHV infection as detected by flow cytometry for GFP expression at 48 hours post infection. Standard deviation is shown. (D) Crystal violet staining of KSHV latently infected colonies following puromycin resistant outgrowth. (E) Average of colony outgrowth from three independent experiments. Individual data points and standard deviation are shown. **P< 0.01 by the paired sample t-test. Asterisks directly above bars refer to differences from 293T cells.

Similar articles

Cited by

References

    1. Shilatifard A. The COMPASS family of histone H3K4 methylases: mechanisms of regulation in development and disease pathogenesis. Annu. Rev. Biochem. 2012; 81:65–95. - PMC - PubMed
    1. Miller T., Krogan N.J., Dover J., Erdjument-Bromage H., Tempst P., Johnston M., Greenblatt J.F., Shilatifard A.. COMPASS: a complex of proteins associated with a trithorax-related SET domain protein. Proc. Natl. Acad. Sci. U.S.A. 2001; 98:12902–12907. - PMC - PubMed
    1. Piunti A., Shilatifard A.. Epigenetic balance of gene expression by Polycomb and COMPASS families. Science. 2016; 352:aad9780. - PubMed
    1. Ansari K.I., Mandal S.S.. Mixed lineage leukemia: roles in gene expression, hormone signaling and mRNA processing. FEBS J. 2010; 277:1790–1804. - PubMed
    1. Hughes C.M., Rozenblatt-Rosen O., Milne T.A., Copeland T.D., Levine S.S., Lee J.C., Hayes D.N., Shanmugam K.S., Bhattacharjee A., Biondi C.A.et al. .. Menin associates with a trithorax family histone methyltransferase complex and with the hoxc8 locus. Mol. Cell. 2004; 13:587–597. - PubMed

Publication types

MeSH terms