. 2022 Feb 28;50(4):e19.
doi: 10.1093/nar/gkab1129.

Accurate expression quantification from nanopore direct RNA sequencing with NanoCount

Affiliations

Accurate expression quantification from nanopore direct RNA sequencing with NanoCount

Josie Gleeson et al. Nucleic Acids Res. .

Abstract

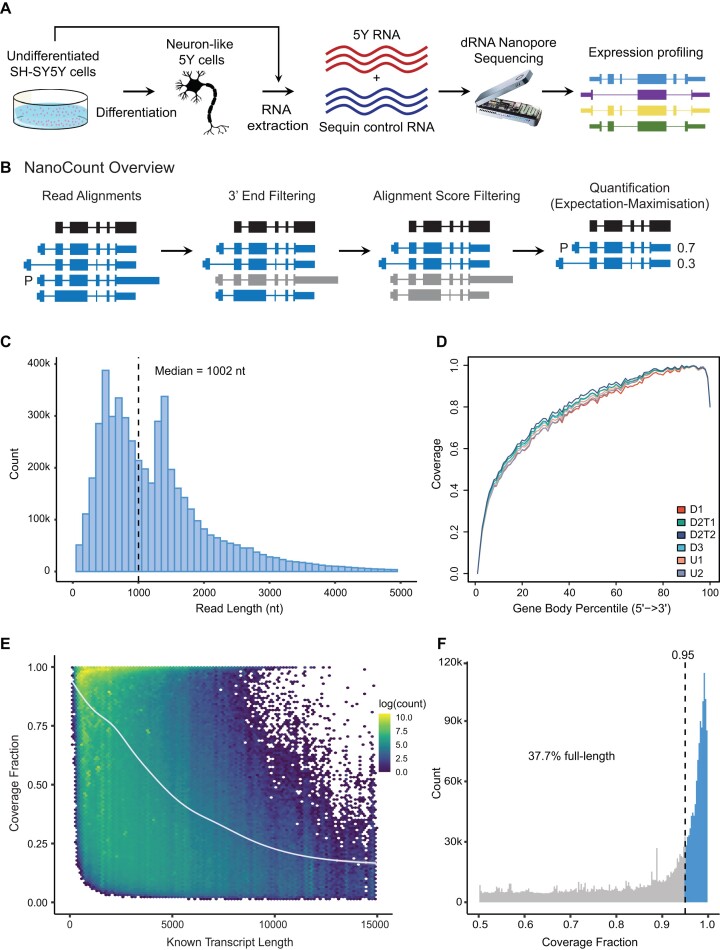
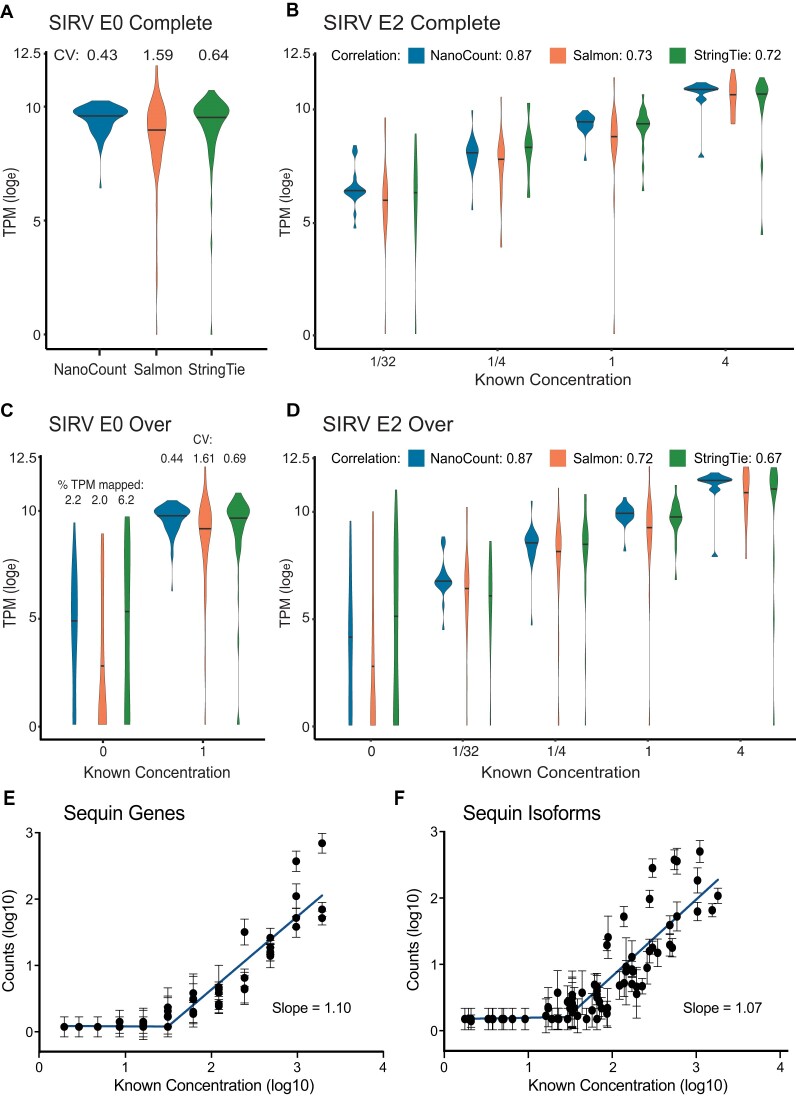
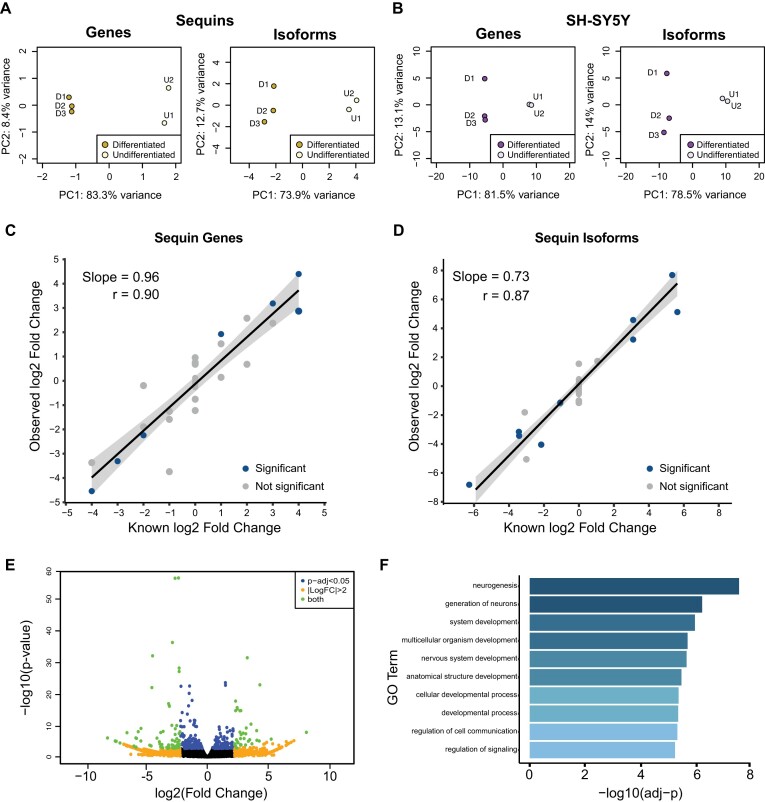
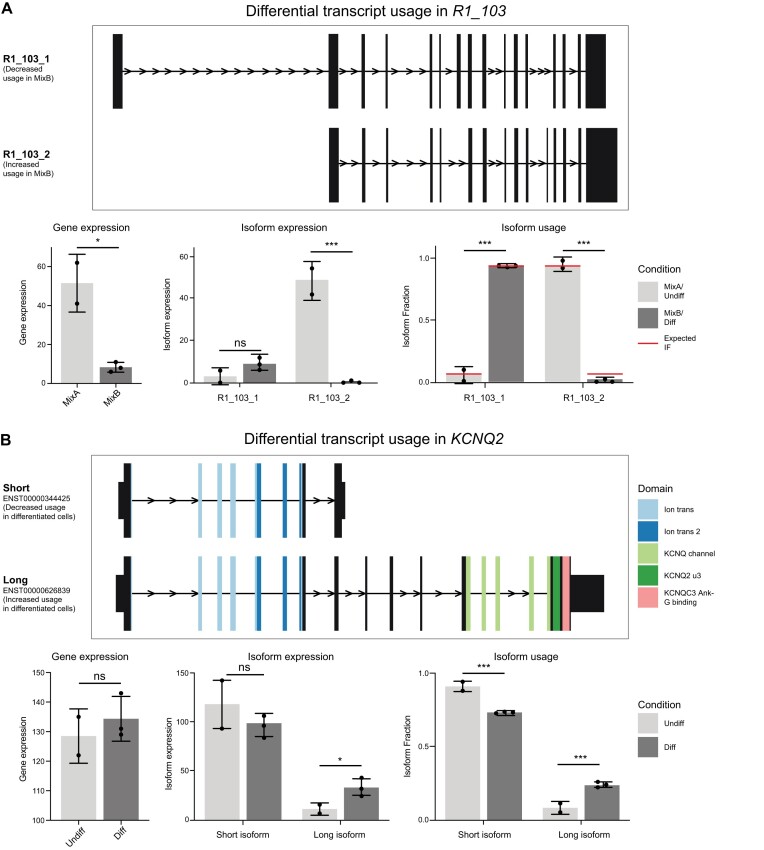
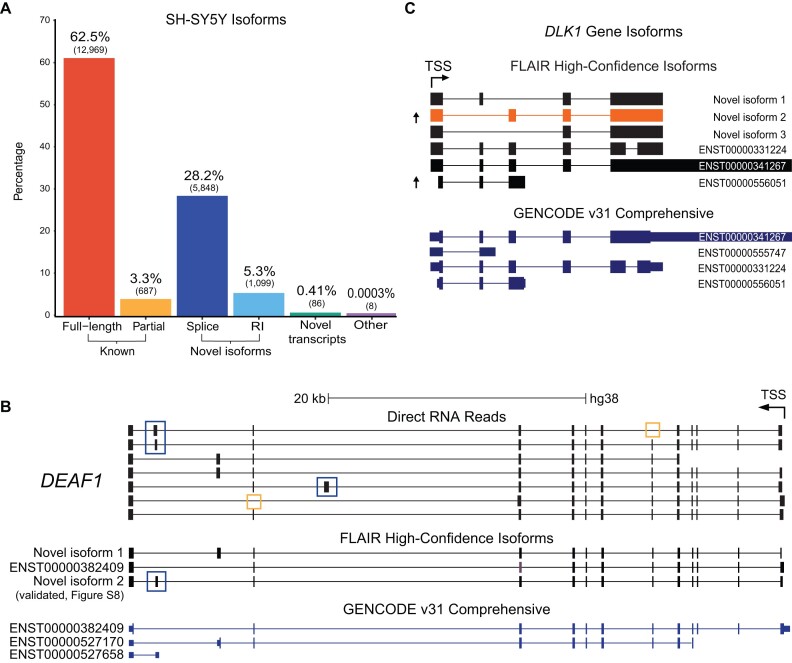
Accurately quantifying gene and isoform expression changes is essential to understanding cell functions, differentiation and disease. Sequencing full-length native RNAs using long-read direct RNA sequencing (DRS) has the potential to overcome many limitations of short and long-read sequencing methods that require RNA fragmentation, cDNA synthesis or PCR. However, there are a lack of tools specifically designed for DRS and its ability to identify differential expression in complex organisms is poorly characterised. We developed NanoCount for fast, accurate transcript isoform quantification in DRS and demonstrate it outperforms similar methods. Using synthetic controls and human SH-SY5Y cell differentiation into neuron-like cells, we show that DRS accurately quantifies RNA expression and identifies differential expression of genes and isoforms. Differential expression of 231 genes, 333 isoforms, plus 27 isoform switches were detected between undifferentiated and differentiated SH-SY5Y cells and samples clustered by differentiation state at the gene and isoform level. Genes upregulated in neuron-like cells were associated with neurogenesis. NanoCount quantification of thousands of novel isoforms discovered with DRS likewise enabled identification of their differential expression. Our results demonstrate enhanced DRS isoform quantification with NanoCount and establish the ability of DRS to identify biologically relevant differential expression of genes and isoforms.


Figures

Figure 1.
Figure 1.
Experimental overview and DRS read metrics. (A) Experimental overview. Cultured SH-SY5Y cells were differentiated in triplicate and RNA extracted from undifferentiated and differentiated cells. Native polyA purified SH-SY5Y RNA was combined with ‘sequin’ spike-in RNA, prepared for DRS and sequenced on an Oxford Nanopore MinION. Reads were analysed to identify and quantify genes and transcript isoforms and their differential expression. (B) Overview of NanoCount steps. A nanopore read (black) and example alignments (blue) are shown. P = primary alignment. Alignments with a 3′ end >50nt from the read 3′ end are discarded (grey). Next, alignments with an alignment score (AS) <95% of the highest remaining AS are discarded. Finally, the expectation-maximisation algorithm is initiated to quantify isoforms. In this example the read count is split 0.7 to 0.3 between the two remaining alignments. The primary alignment (P) is now the remaining alignment with the highest AS. (C) Length of all SH-SY5Y and sequin pass reads. Dashed line shows median read length. X-axis truncated at 5 kb. (D) Gene body coverage of SH-SY5Y reads in each sample. Length of all genes normalised to 100 and plotted from 5′ (0) to 3′ (100). Lines show mean coverage across all genes across the length of the gene body. Lower coverage at extreme 3' corresponds to soft clipping of the first bases sequenced which often have lower phred quality. U1 & U2—undifferentiated replicates 1 & 2. D1 & D3—differentiated replicates 1 & 3. D2T1 & T2—technical replicates of differentiated replicate sample 2. (E) Fraction of known transcript length covered by each read (coverage fraction) compared to known transcript length. Trend line was plotted using a generalized additive model, an extension of a generalised linear model where the linear form is replaced by sum of smooth functions. (F) Fraction of full-length SH-SY5Y reads. Fraction of known transcript length covered by each read. Dotted line represents 95% cutoff for full-length reads. Full-length reads shaded in blue. X-axis truncated at 0.5.
Figure 2.
Figure 2.
Comparison of methods for quantifying DRS spike-in controls. (A–D) Comparison of NanoCount, Salmon and StringTie2 for quantification of SIRV spike-in isoform mixes. Median lines plotted. SIRV isoform expression quantified as TPM(loge), i.e.: loge(TPM + 1). (A) SIRV Mix E0 Complete annotation (C) isoforms (coefficient of variation (CV) of TPMs shown). (B) SIRV Mix E2 Complete annotation (C) isoforms (Spearman's r correlation shown). (C) SIRV Mix E0 Over annotation (O) isoforms. TPM coefficient of variation shown for isoforms with a known concentration of 1 fmol. For false positive isoforms with a known count of 0 TPM distribution is plotted and the % of TPMs mapped to 0 count isoforms shown. (D) SIRV Mix E2 Over annotation (O) isoforms (Spearman's r correlation shown). (E, F) Quantification of sequin genes (E) and transcript isoforms (F). Comparison of known sequin Mix B abundance (original concentration in attomoles/ul) to measured counts. Counts and concentrations transformed log10(X + 1). Mean and standard deviation plotted. N = 4. Trend line = segmental linear regression with breakpoint at 1.49 (genes) and 1.44 (transcripts) performed on log10 transformed data.
Figure 3.
Figure 3.
Identification of differential gene and isoform expression. (A, B) Principal component analysis (PCA) of sequin (A) and SH-SY5Y (B) gene and isoform expression between undifferentiated and differentiated SH-SY5Y cells. All plots show the first two principal components. SH-SY5Y shows endogenous expression only. Sequins were added to undifferentiated (Mix A) and differentiated (Mix B) SH-SY5Y RNA and plots reflect measured abundance differences between the sequin mixes. (C, D) Quantification of fold changes between Mix A and Mix B sequin genes (C) and isoforms (D). Comparison of known fold changes in abundance with measured fold changes from sequencing. Sequins with significant differential expression in blue, not significant in grey. Trend line shows slope from linear regression. Shaded grey area shows 95% confidence interval for regression slope. Correlation (r) is spearman correlation. (E) Volcano plot of differential isoform expression between undifferentiated and differentiated SH-SY5Y cells. An adjusted P-value <0.05 (from DESeq2) was considered significant for differential expression. FC = fold change. (F) Gene ontology (GO) terms most associated with differentially expressed genes upregulated during SH-SY5Y differentiation. P-values adjusted using Bonferroni correction for multiple testing.
Figure 4.
Figure 4.
Differential isoform usage of control and endogenous genes. Identification of DIU in the synthetic sequin gene R1_103 (A) and the potassium channel KCNQ2 (B). Top: structure of expressed isoforms. Arrows show direction of transcription. Narrow lines show intronic regions (not to scale). Exons displayed as boxes. Taller exonic boxes are coding regions, shorter boxes are 5′ and 3′ UTR regions. Colours represent identified protein domains. Below: graphs display gene and isoform expression and the fraction of expression corresponding to each isoform in Mix A/Undifferentiated and Mix B/differentiated samples. Red lines show known (expected) sequin isoform fractions in Mix A and B. ns = not significant, * < 0.05, ** < 0.01, *** < 0.001.
Figure 5.
Figure 5.
Identification and quantification of novel isoforms with FLAIR and NanoCount. (A) FLAIR annotation of SH-SY5Y isoforms compared with known annotations using gffcompare (42). The gffcompare class codes were grouped into the following four categories: known, transcripts that are full-length or partial-length exact matches to existing annotations; novel isoform, transcripts from known genes with novel exon junctions or retained introns (RI); novel transcript, novel intergenic, antisense or intronic transcripts potentially representing novel genes; other, possible artifacts and RNA fragments. Number of isoforms in each category shown in brackets. (B) UCSC Genome Browser screenshots of DEAF1 isoforms identified by FLAIR compared to known GENCODE annotations and selected raw nanopore DRS reads. The novel DEAF1 FLAIR isoform validated with a combination of Sanger and ONT PCR-cDNA sequencing is labelled, see Supplementary Figure S8 for validations. Novel exons and exon skipping shown in blue and yellow boxes respectively. (C) UCSC Genome Browser screenshots of DLK1 isoforms identified with FLAIR compared to known GENCODE annotations. Arrows indicate significant differential expression of isoforms upregulated in differentiated samples after quantification with NanoCount. Novel isoform 2 (orange) is the most significant differentially expressed novel isoform and shows a novel 3′ terminal exon and exon skipping. TSS: transcription start site.

Similar articles

Cited by

References

    1. Pan Q., Shai O., Lee L.J., Frey B.J., Blencowe B.J.. Deep surveying of alternative splicing complexity in the human transcriptome by high-throughput sequencing. Nat. Genet. 2008; 40:1413–1415. - PubMed
    1. Wang E.T., Sandberg R., Luo S., Khrebtukova I., Zhang L., Mayr C., Kingsmore S.F., Schroth G.P., Burge C.B.. Alternative isoform regulation in human tissue transcriptomes. Nature. 2008; 456:470–476. - PMC - PubMed
    1. Melé M., Ferreira P.G., Reverter F., DeLuca D.S., Monlong J., Sammeth M., Young T.R., Goldmann J.M., Pervouchine D.D., Sullivan T.J.et al. .. The human transcriptome across tissues and individuals. Science. 2015; 348:660–665. - PMC - PubMed
    1. Roundtree I.A., He C.. RNA epigenetics—chemical messages for posttranscriptional gene regulation. Curr. Opin. Chem. Biol. 2016; 30:46–51. - PMC - PubMed
    1. Emilsson V., Thorleifsson G., Zhang B., Leonardson A.S., Zink F., Zhu J., Carlson S., Helgason A., Walters G.B., Gunnarsdottir S.et al. .. Genetics of gene expression and its effect on disease. Nature. 2008; 452:423–428. - PubMed

Publication types