. 2022 Jan 7;50(D1):D129-D140.
doi: 10.1093/nar/gkab1030.

Expression Atlas update: gene and protein expression in multiple species

Affiliations

Expression Atlas update: gene and protein expression in multiple species

Pablo Moreno et al. Nucleic Acids Res. .

Abstract

The EMBL-EBI Expression Atlas is an added value knowledge base that enables researchers to answer the question of where (tissue, organism part, developmental stage, cell type) and under which conditions (disease, treatment, gender, etc) a gene or protein of interest is expressed. Expression Atlas brings together data from >4500 expression studies from >65 different species, across different conditions and tissues. It makes these data freely available in an easy to visualise form, after expert curation to accurately represent the intended experimental design, re-analysed via standardised pipelines that rely on open-source community developed tools. Each study's metadata are annotated using ontologies. The data are re-analyzed with the aim of reproducing the original conclusions of the underlying experiments. Expression Atlas is currently divided into Bulk Expression Atlas and Single Cell Expression Atlas. Expression Atlas contains data from differential studies (microarray and bulk RNA-Seq) and baseline studies (bulk RNA-Seq and proteomics), whereas Single Cell Expression Atlas is currently dedicated to Single Cell RNA-Sequencing (scRNA-Seq) studies. The resource has been in continuous development since 2009 and it is available at https://www.ebi.ac.uk/gxa.


Figures

Figure 1.
Figure 1.
Top 15 most represented species in Expression Atlas, considering publicly available experiments across all technologies (RNA-Seq, Microarrays, Proteomics and Single Cell RNA-Seq), separated by differential and baseline studies. The 15 most represented species are shown, which jointly cover ∼94% of all studies. Separate varieties of Oryza sativa are considered, however when taken together they would make up for the second most represented plant species after Arabidopsis thaliana.
Figure 2.
Figure 2.
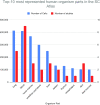
Top-10 represented human organism parts in Single Cell Expression Atlas, by number of cells (left) and number of studies (right).
Figure 3.
Figure 3.
List of 15 organism parts with the highest number of studies in Bulk Expression Atlas. These 15 organism parts, across different organisms, cover a total of 1997 studies, which represents ∼62% of all studies that have an organism part annotation.
Figure 4.
Figure 4.
Top-15 most represented species in Expression Atlas bulk. These 15 species cover >95% of all studies in EA, where >50% of the studies are either Human or Mouse studies. Counting all three different varieties of rice (Oryza sativa) together, this species would be the second most represented plant species after Arabidopsis thaliana.
Figure 5.
Figure 5.
Proportion of studies loaded each year broken down by technology, for Expression Atlas bulk. Data for 2021 is incomplete due to pending loadings. Until 2019 included, there was a clear trend in the reduction of loading of Microarrays and an increase in loading of RNA-Seq studies.
Figure 6.
Figure 6.
Most represented human diseases in Expression Atlas (bulk RNA-Seq, Microarrays and Proteomics) by number of public studies available. These diseases cover ∼47% of all the studies that have a disease annotation (1095), out of a total of ∼685 different human diseases annotated to all Atlas studies (this doesn’t account for diseases annotated at different granularity levels on the studies, for instance lung cancer and lung adenocarcinoma, which are counted separately).
Figure 7.
Figure 7.
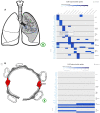
(A) The Single Cell Expression Atlas organ anatomogram for lung (for example shown at https://www.ebi.ac.uk/gxa/sc/experiments/E-GEOD-130148/results/anatomogram), displaying marker genes for the different lung cell types. Hovering over specific sections of the heatmap gives more details about the gene's expression. As the user clicks on an active section of the lung anatomogram, the heatmap to the right changes to display only cell types that exist under that specific part of the organ. (B) As the user dives into more and more detailed views, it will end up at a cellular view, where in this case type I and type II pneumocytes are shown.
Figure 8.
Figure 8.
New selectors for dimensionality reduction cell plots, where the user can choose whether to use UMAP or t-SNE at different scales (plot options). By default, the landing page will show cell types as inferred by the author of the study if available (current field selected in ‘Colour plot by:’).

Similar articles

Cited by

References

    1. Sarkans U., Füllgrabe A., Ali A., Athar A., Behrangi E., Diaz N., Fexova S., George N., Iqbal H., Kurri S.et al. .. From arrayexpress to BioStudies. Nucleic Acids Res. 2021; 49:D1502–D1506. - PMC - PubMed
    1. Barrett T., Wilhite S.E., Ledoux P., Evangelista C., Kim I.F., Tomashevsky M., Marshall K.A., Phillippy K.H., Sherman P.M., Holko M.et al. .. NCBI GEO: archive for functional genomics data sets—update. Nucleic. Acids. Res. 2012; 41:D991–D995. - PMC - PubMed
    1. Harrison P.W., Ahamed A., Aslam R., Alako B.T.F., Burgin J., Buso N., Courtot M., Fan J., Gupta D., Haseeb M.et al. .. The european nucleotide archive in 2020. Nucleic Acids Res. 2021; 49:D82–D85. - PMC - PubMed
    1. Lappalainen I., Almeida-King J., Kumanduri V., Senf A., Spalding J.D., Ur-Rehman S., Saunders G., Kandasamy J., Caccamo M., Leinonen R.et al. .. The european genome-phenome archive of human data consented for biomedical research. Nat. Genet. 2015; 47:692–695. - PMC - PubMed
    1. Papatheodorou I., Moreno P., Manning J., Fuentes A.M.-P., George N., Fexova S., Fonseca N.A., Füllgrabe A., Green M., Huang N.et al. .. Expression atlas update: from tissues to single cells. Nucleic Acids Res. 2020; 48:D77–D83. - PMC - PubMed

Publication types