. 2021 Dec 2;49(21):12048-12068.
doi: 10.1093/nar/gkab1124.

Enzymatic deamination of the epigenetic nucleoside N6-methyladenosine regulates gene expression

Affiliations

Enzymatic deamination of the epigenetic nucleoside N6-methyladenosine regulates gene expression

Zhuoran Jiang et al. Nucleic Acids Res. .

Abstract

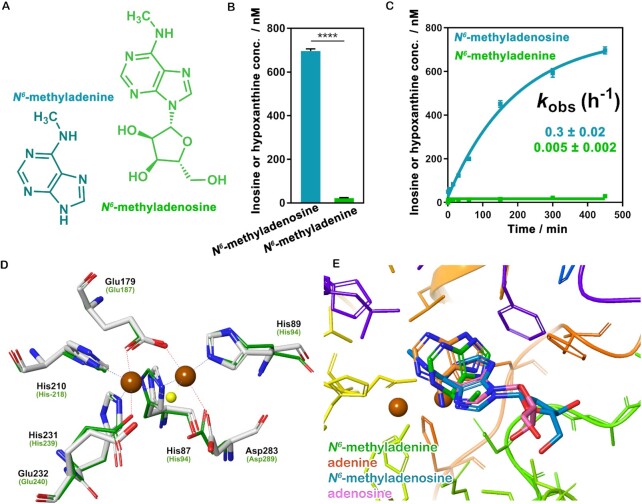
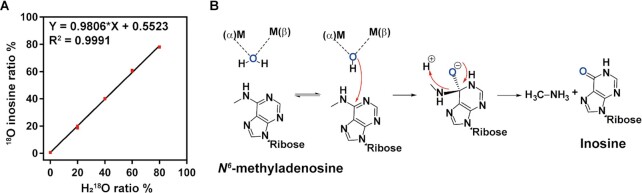
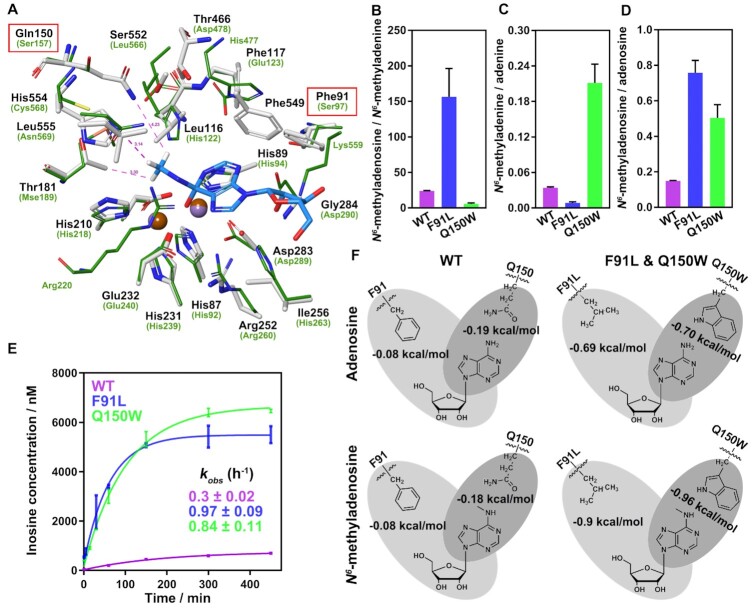
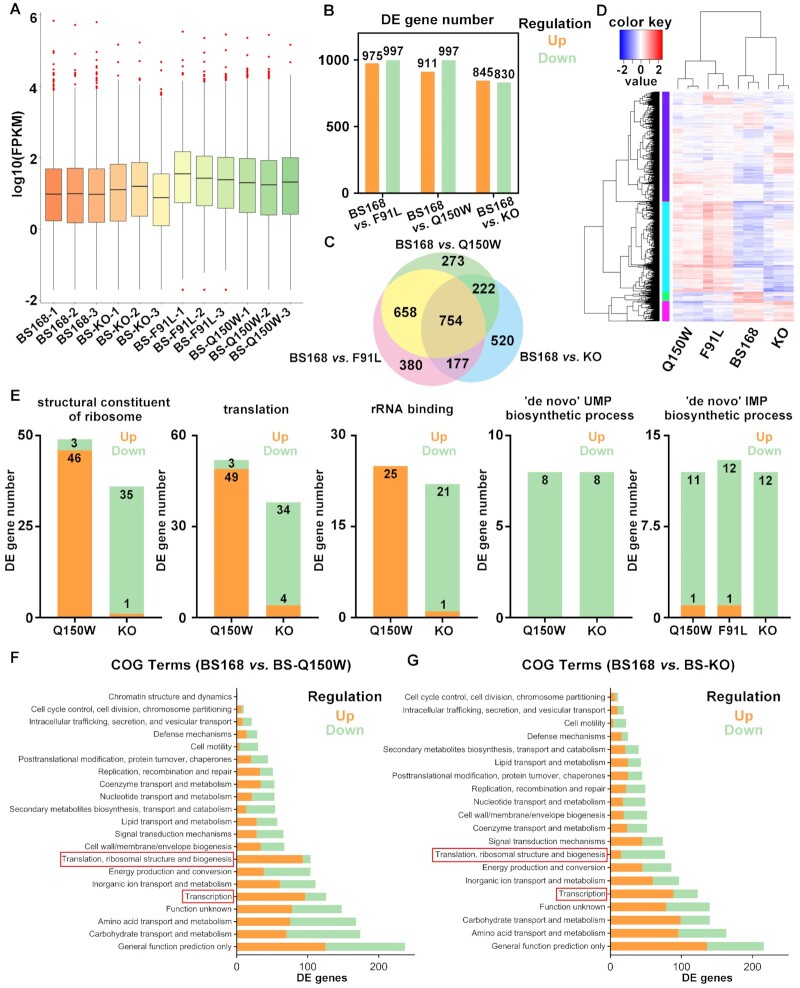
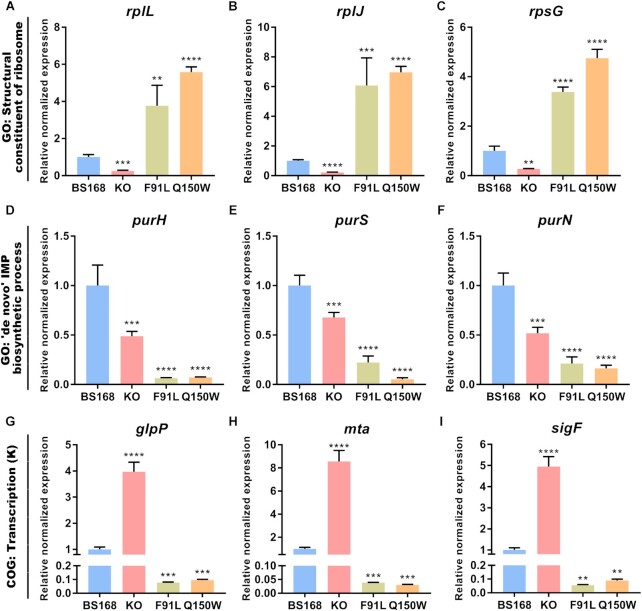
N6-methyladenosine (m6A) modification is the most extensively studied epigenetic modification due to its crucial role in regulating an array of biological processes. Herein, Bsu06560, formerly annotated as an adenine deaminase derived from Bacillus subtilis 168, was recognized as the first enzyme capable of metabolizing the epigenetic nucleoside N6-methyladenosine. A model of Bsu06560 was constructed, and several critical residues were putatively identified via mutational screening. Two mutants, F91L and Q150W, provided a superiorly enhanced conversion ratio of adenosine and N6-methyladenosine. The CRISPR-Cas9 system generated Bsu06560-knockout, F91L, and Q150W mutations from the B. subtilis 168 genome. Transcriptional profiling revealed a higher global gene expression level in BS-F91L and BS-Q150W strains with enhanced N6-methyladenosine deaminase activity. The differentially expressed genes were categorized using GO, COG, KEGG and verified through RT-qPCR. This study assessed the crucial roles of Bsu06560 in regulating adenosine and N6-methyladenosine metabolism, which influence a myriad of biological processes. This is the first systematic research to identify and functionally annotate an enzyme capable of metabolizing N6-methyladenosine and highlight its significant roles in regulation of bacterial metabolism. Besides, this study provides a novel method for controlling gene expression through the mutations of critical residues.


Figures

Figure 1.
Figure 1.
Bsu06560 capable of metabolizing the N6-methyladenosine and the N6-methyladenine. (A) Chemical formula of N6-methyladenosine and the N6-methyladenine. (B) Deamination activities of Bsu06560 with different substrates (10 μM). The integral areas of different chromatographic peaks in LC-HRMS were used to determine the concentration of the product. Bsu06560 exhibited a remarkable deamination activity for N6-methyladenosine than N6-methyladenine. Mean values were plotted (n = 3). The error bars represent the ±SEM. Unpaired t-test (two-tailed): ****P < 0.0001. (C) Time courses for different substrates (10 μM) deaminated by Bsu06560. The data points were best fitted using a single exponential equation to follow the formation of inosine or hypoxanthine (GraphPad Prism software). The kobs value for inosine and hypoxanthine formation was estimated using the one-phase association model. Mean values were plotted (n = 3). The error bars represent the ±SEM. (D) Superimposition of the bimetal site of the Bsu06560 homologous model (green line) and the template atuADE (PDB code: 3NQB, white stick). The dashed lines indicate the polar interactions between residues and bimetal core, and μ-1,3-carboxylate glutamic (Glu179) and hydroxide (water, shown in yellow ball) bridges. The residue labels for Bsu06560 are shown using the label for corresponding residues in atuADE given in parentheses. The brown dots represent metals. (E) The binding site of N6-methyladenine, adenine, N6-methyladenosine, adenosine (lowest energy for each). The brown dots indicate metals.
Figure 2.
Figure 2.
Catalytic mechanism of the Bsu06560 deamination. (A) Isotope doping characterization of products during Bsu06560 deamination. The incorporation of 18O into inosine from Bsu06560 deamination had a significant linear relation (R2 = 0.9991) as the ratio of heavy oxygen water (H218O) in the reaction system increased. Quantification of 18O-inosine is shown as a ratio of total inosine product. Mean values were plotted (n = 3). The error bars represent the ±SEM. (B) Proposed catalytic mechanism of Bsu06560 deamination. Re-face of N6-methyladenosine had a nucleophilic attack by hydroxide from water. The reaction was conducted in water phase with Bsu06560 at 30°C, pH 7.5. Red arrows represent the electron transfer process.
Figure 3.
Figure 3.
Biochemical and computational characterization of purified Bsu06560 mutants. (A) Superimposition of the N6-methyl surrounding residues for the high energy intermediate of N6-methyladenosine in Bsu06560 homologous model (white stick) and the adenine deaminase (atuADE, renamed Atu4426, PDB code: 3NQB, green line). Brown and violet balls represent metals in Bsu06560 and atuADE, respectively. Another metal ion in atuADE was hidden due to its unnecessary activity. Pink dotted lines indicate the distance between atoms (angstrom). (BD) Product ratios of WT, Q150W and F91L mutant in deamination reaction at the 120 min. The substrates were saturated with enzymes. The F91L and Q150W mutants had a higher ratio than wild-type protein in product amount of N6-methyladenosine/N6-methyladenine and N6-methyladenine/adenine. Low concentrations of substrates (10 μM) were used where the enzyme was excess (20 μM). The integral areas of chromatographic peaks of LC-HRMS were used to determine the concentration of products. Mean values were plotted (n = 3). The error bars represent the ± SEM. (E) Deamination time courses for the Bsu06560 mutants for N6-methyladenosine. Mean values were plotted (n = 3). The error bars represent the ± SEM. The mutants Q150W and F91L of Bsu06560 had a substantially increased deamination activity for N6-methyladenosine. The data points were best fitted using a single exponential equation to follow the formation of inosine or hypoxanthine (GraphPad Prism software). The kobs value for inosine formation was estimated using the one-phase association model. (F) Simplified scheme of interactions between key residues of Bsu06560 and its mutants with N6-methyladenosine and adenosine. Non-bonded interactions are indicated in gray, and relative energies of interaction are provided in kcal/mol.
Figure 4.
Figure 4.
Transcriptomic profiling of BS168 (WT), BS-KO, BS-F91L and BS-Q150W strains. (A) Global gene expression analysis of all RNA sequencing samples. The BS-F91L and BS-Q150W strains had higher gene expression levels than wild-type. (B) Number of DE genes in BS168 versus BS-KO, BS168 versus BS-F91L and BS168 vs. BS-Q150W groups identified via RNA sequencing. (C) Overlap of the DE genes in BS168 versus BS-KO, BS168 versus BS-F91L and BS168 versus BS-Q150W groups. (D) Hierarchical clustering of DE genes in wild-type and variant strains (red and blue represent up-regulated and down-regulated genes, respectively). (E) Gene expression patterns in several GO enrichment items. The BS-Q150W and BS-KO strains showed contrasting expression patterns in ‘structural constituent of ribosome’, ‘translation’ and ‘rRNA binding’ items, and similar expression patterns in ‘‘de novo’ UMP biosynthetic process’ and ‘‘de novo’ IMP biosynthetic process’. (F) The COG classification of the DE genes in BS168 vs. BS-Q150W group. (G) The COG classification of the DE genes in BS168 versus BS-KO group. (F, G) The BS-Q150W and BS-KO strains with contrasting expression patterns in ‘Translation, ribosomal structure and biogenesis’ term and similar expression patterns in ‘Transcription’ term.
Figure 5.
Figure 5.
Validation of transcriptome sequencing results via RT-qPCR. The DE genes of variants showed different expression patterns in different GO and COG categories. (AC) Expression levels of rplL, rplJ, and rpsG genes involved in the ‘structural constituent of ribosome’ GO term. The BS-F91L and BS-Q150W strains had higher gene expression levels than BS168. However, BS-KO strain was down-regulated among these genes. (D–F) Expression levels of purH, purS and purN genes involved in the ‘‘de novo’ IMP biosynthetic process’ GO term. The purH, purS and purN genes were down-regulated in the BS-KO, BS-F91L and BS-Q150W strains. (G–I) Expression levels of glpP, mta and sigF genes involved in the ‘Transcription (K)’ COG term. The BS-KO strain had significantly higher expression levels than BS168. In contrast, these genes were significantly downregulated in BS-F91L and BS-Q150W strains. The rpoB gene was used as an internal control. The relative quantity of gene expression (fold change, Y-axis) of each gene was calculated via the comparative 2−ΔΔCt method. All gene expression levels were normalized to that of the BS168. The average of three biological replicates was used (n = 3). The error bars represent ± SEM; *P < 0.05, **P < 0.01, ***P < 0.001, ****P < 0.0001 versus BS168.

Similar articles

Cited by

References

    1. Dominissini D., Moshitch-Moshkovitz S., Schwartz S., Salmon-Divon M., Ungar L., Osenberg S., Cesarkas K., Jacob-Hirsch J., Amariglio N., Kupiec M.et al. .. Topology of the human and mouse m6A RNA methylomes revealed by m6A-seq. Nature. 2012; 485:201–206. - PubMed
    1. Meyer K.D., Saletore Y., Zumbo P., Elemento O., Mason C.E., Jaffrey S.R.. Comprehensive analysis of mRNA methylation reveals enrichment in 3′ UTRs and near stop codons. Cell. 2012; 149:1635–1646. - PMC - PubMed
    1. Deng X., Chen K., Luo G.Z., Weng X., Ji Q., Zhou T., He C.. Widespread occurrence of N6-methyladenosine in bacterial mRNA. Nucleic Acids Res. 2015; 43:6557–6567. - PMC - PubMed
    1. Roundtree I.A., Evans M.E., Pan T., He C.. Dynamic RNA modifications in gene expression regulation. Cell. 2017; 169:1187–1200. - PMC - PubMed
    1. Frye M., Harada B.T., Behm M., He C.. RNA modifications modulate gene expression during development. Science. 2018; 361:1346–1349. - PMC - PubMed

Publication types