. 2021 Dec 16;49(22):13150-13164.
doi: 10.1093/nar/gkab1155.

Chromosome segregation in Archaea: SegA- and SegB-DNA complex structures provide insights into segrosome assembly

Affiliations

Chromosome segregation in Archaea: SegA- and SegB-DNA complex structures provide insights into segrosome assembly

Cheng-Yi Yen et al. Nucleic Acids Res. .

Abstract

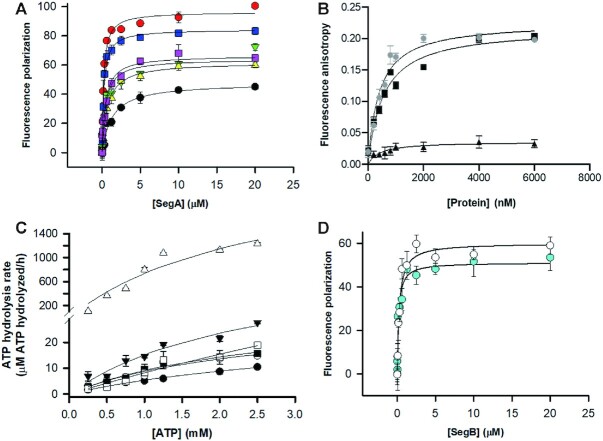
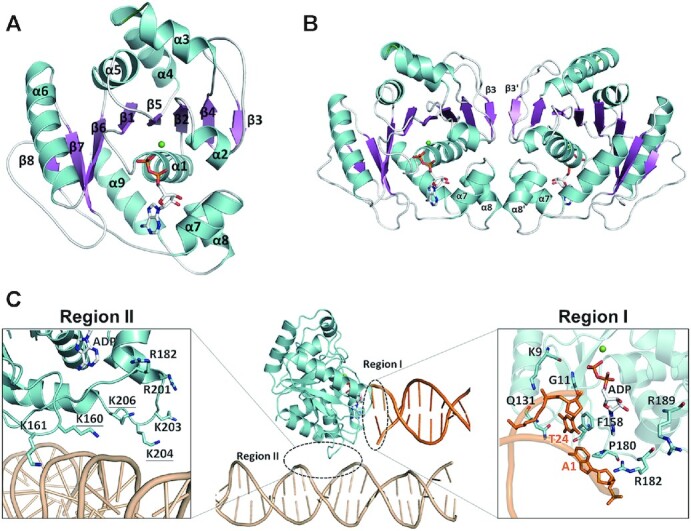
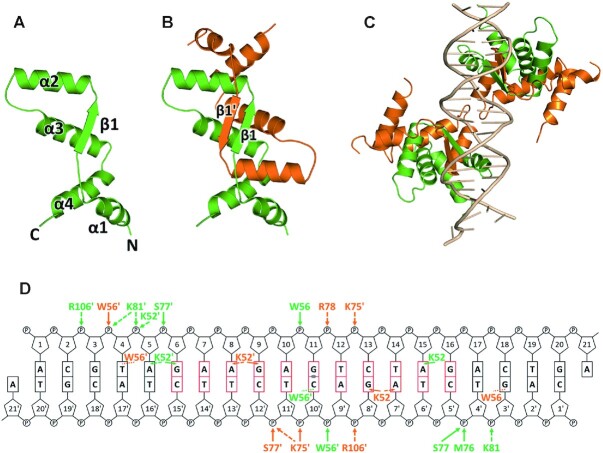
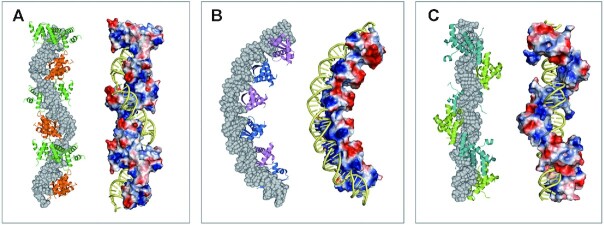
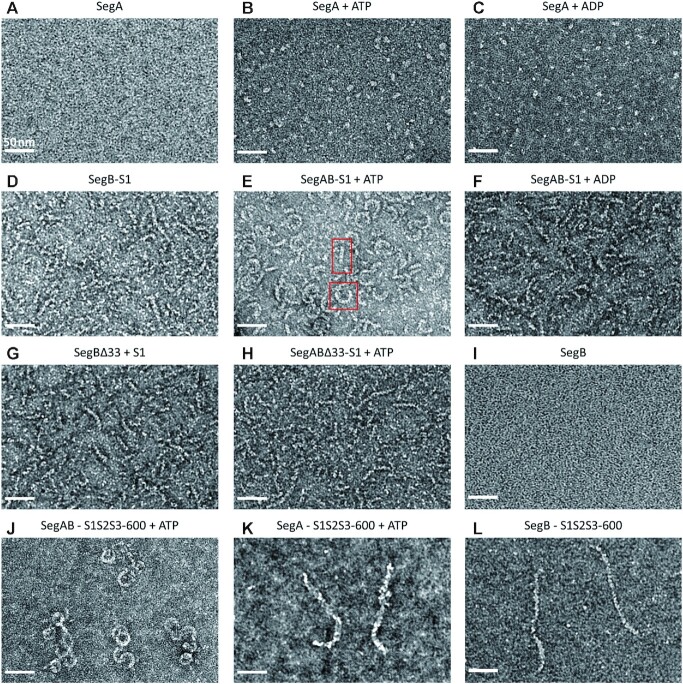
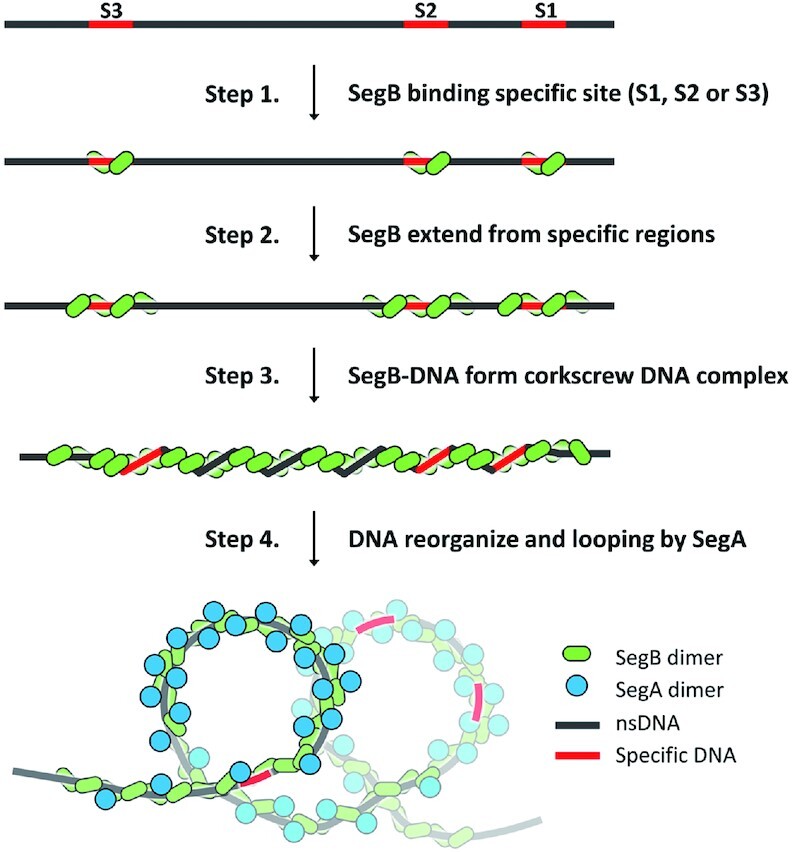
Genome segregation is a vital process in all organisms. Chromosome partitioning remains obscure in Archaea, the third domain of life. Here, we investigated the SegAB system from Sulfolobus solfataricus. SegA is a ParA Walker-type ATPase and SegB is a site-specific DNA-binding protein. We determined the structures of both proteins and those of SegA-DNA and SegB-DNA complexes. The SegA structure revealed an atypical, novel non-sandwich dimer that binds DNA either in the presence or in the absence of ATP. The SegB structure disclosed a ribbon-helix-helix motif through which the protein binds DNA site specifically. The association of multiple interacting SegB dimers with the DNA results in a higher order chromatin-like structure. The unstructured SegB N-terminus plays an essential catalytic role in stimulating SegA ATPase activity and an architectural regulatory role in segrosome (SegA-SegB-DNA) formation. Electron microscopy results also provide a compact ring-like segrosome structure related to chromosome organization. These findings contribute a novel mechanistic perspective on archaeal chromosome segregation.


Figures

Figure 1.
Figure 1.
Characterization of SegA and SegB. (A) DNA binding by SegA to a 24-bp nsDNA and 23-bp S1 DNA was measured by FP binding isotherms. SegA binds to the 24-bp nsDNA in the absence of nucleotide (closed up-pointing triangle; colored in yellow) and with ATP (closed square; colored in blue) or ADP (closed square; colored in magenta). SegA binding to the 23-bp S1 DNA without nucleotide (closed circle; colored in black) and in the presence of ATP (closed circle; colored in red) or ADP (closed down-pointing triangle; colored in green) is shown. (B) Fluorescence anisotropy ATP binding assay for WT SegA (closed circle), SegA-G10V (closed square) and SegA-K14Q (closed up-pointing triangle) to 1 μM MANT-ATP. (C) SegA ATPase activity assays. SegA (10 μM) ATPase activity was observed in the absence or presence of SegB (10 μM) and DNA (1 μM). The data were plotted as SegA (closed circle), SegA + S1 DNA (open circle), SegA + SegB (closed down-pointing triangle), SegA + SegB + S1 DNA (open up-pointing triangle), SegA + SegBΔ33 (closed square), SegA + SegBΔ33 + S1 DNA (open square) and SegA + SegBΔ21 + S1 DNA (open diamond). (D) Binding of SegB (open circle) and SegBΔ33 (closed circle; colored in cyan) to the 23-bp S1 DNA. DNA binding was measured by FP and plotted against protein concentration (0–20 μM). All measurements are reported in triplicate and error bars represent the standard deviation of the mean; the solid lines represent fitting curves to the Michaelis–Menten equation.
Figure 2.
Figure 2.
Crystal structures of SegA–ADP and SegA–ADP–DNA complexes. (A) SegA monomer structure is shown in ribbon, and nine α-helices (α1–α9) and eight β-sheets (β1–β8) are labeled and colored in cyan and magenta, respectively. ADP is displayed as bond and stick, and magnesium ion is displayed as a green sphere. (B) SegA dimer structure is shown in ribbon, and α-helices and β-sheets are colored as cyan and magenta, respectively. (C) The DNA binding regions of the SegA–ADP–DNA complex. Regions I and II are labeled with dotted circles. The DNA molecules associated with the two regions are shown in orange and wheat for regions I and II, respectively. On the right and left sides are close-up looks of the interaction details for regions I and II. The residues interacting with DNA are shown as sticks and labeled.
Figure 3.
Figure 3.
Crystal structure of SegB and SegB–S1 DNA complex. (A) The SegB monomer molecule contains four α-helices (α1–α4) and one β-strand (β1). (B) SegB dimer structure in which individual monomers are colored in green and orange. (C) SegB–DNA complex. The DNA is colored in wheat, and the individual monomers are colored in green and orange. (D) Schematic diagram of SegB–S1 DNA interactions is displayed according to panel (C). Interacting residues are colored as green and orange for the two different monomers. The residues from the bottom dimer in panel (C) are labeled with an apostrophe. The interactions between SegB and the DNA are shown as solid arrows (H-bond), dash line arrows (electrostatic) and dash lines (hydrophobic).
Figure 4.
Figure 4.
Higher order structure of SegB–S1 DNA and ParR–parC DNA complex. (A) Left: adjacent SegB dimers are shown as alternate green and orange molecules. The DNA molecule is in space filling and colored in gray. Right: SegB electrostatic surface charge and DNA (yellow). (B) The structure of ParR–parC DNA complex from PDB ID 2Q2K. Left: each ParR dimer is colored as blue or purple, alternatively. Right: ParR electrostatic potential surface and DNA (yellow). (C) The model of omega–parS DNA complex from PDB ID 2NBZ. Left: each omega dimer is colored as deep teal or limon, alternatively. Right: omega electrostatic potential surface and DNA (yellow).
Figure 5.
Figure 5.
SegABS segrosome visualized by EM. (A) SegA only. (B) The SegA–ATP stumpy polymers. (C) The SegA–ADP. (D) SegB–S1 DNA. (E) The SegA–ATP–SegB–S1 DNA complex. Examples of SegAB–S1 DNA complexes forming rod-like and arc-shaped particles are highlighted in frame. (F) The SegA–ADP–SegB–S1 DNA complex. (G) The SegBΔ33–S1 DNA complex. (H) The SegA–ATP–SegBΔ33–S1 DNA complex. (I) SegB only. (J) The SegA–ATP–SegB–S1S2S3-600 DNA. (K) The SegA–ATP–S1S2S3-600 DNA. (L) The SegB–S1S2S3-600 DNA. Scale bar = 50 nm.
Figure 6.
Figure 6.
A speculative model for SegA-dependent SegABS segrosome formation. The proposed mechanism includes four functional steps: (1) initial SegB binding to cognate sites; (2) SegB binding to adjacent DNA regions; (3) SegB prompting DNA organization; and (4) segrosome formation induced by SegA in the ATP-bound state.

Similar articles

Cited by

References

    1. Hayes F., Barilla D.. The bacterial segrosome: a dynamic nucleoprotein machine for DNA trafficking and segregation. Nat. Rev. Microbiol. 2006; 4:133–143. - PubMed
    1. Prosser S.L., Pelletier L.. Mitotic spindle assembly in animal cells: a fine balancing act. Nat. Rev. Mol. Cell Biol. 2017; 18:187–201. - PubMed
    1. Hurtgen D., Murray S.M., Mascarenhas J., Sourjik V.. DNA segregation in natural and synthetic minimal systems. Adv. Biosyst. 2019; 3:e1800316. - PubMed
    1. Baxter J.C., Funnell B.E.. Plasmid partition mechanisms. Microbiol. Spectr. 2014; 2:6. - PubMed
    1. Gerdes K., Howard M., Szardenings F.. Pushing and pulling in prokaryotic DNA segregation. Cell. 2010; 141:927–942. - PubMed

Publication types

MeSH terms