. 2021 Dec 2;49(21):12320-12331.
doi: 10.1093/nar/gkab1143.

Cellular heterogeneity in DNA alkylation repair increases population genetic plasticity

Affiliations

Cellular heterogeneity in DNA alkylation repair increases population genetic plasticity

Maxence S Vincent et al. Nucleic Acids Res. .

Abstract

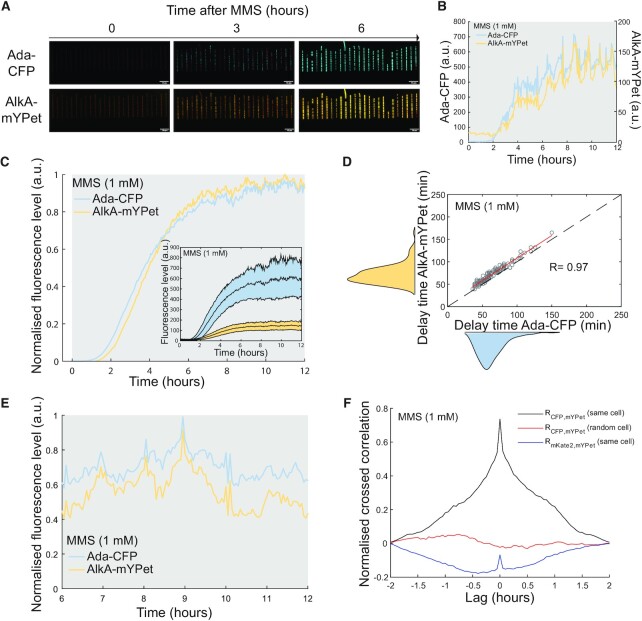
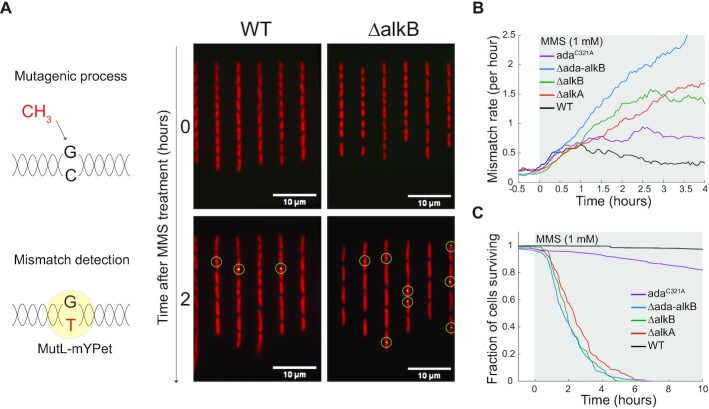
DNA repair mechanisms fulfil a dual role, as they are essential for cell survival and genome maintenance. Here, we studied how cells regulate the interplay between DNA repair and mutation. We focused on the adaptive response that increases the resistance of Escherichia coli cells to DNA alkylation damage. Combination of single-molecule imaging and microfluidic-based single-cell microscopy showed that noise in the gene activation timing of the master regulator Ada is accurately propagated to generate a distinct subpopulation of cells in which all proteins of the adaptive response are essentially absent. Whereas genetic deletion of these proteins causes extreme sensitivity to alkylation stress, a temporary lack of expression is tolerated and increases genetic plasticity of the whole population. We demonstrated this by monitoring the dynamics of nascent DNA mismatches during alkylation stress as well as the frequency of fixed mutations that are generated by the distinct subpopulations of the adaptive response. We propose that stochastic modulation of DNA repair capacity by the adaptive response creates a viable hypermutable subpopulation of cells that acts as a source of genetic diversity in a clonal population.


Figures

Figure 1.
Figure 1.
Stochastic induction of the adaptive response genes in response to alkylation stress. (A) Schematic of the adaptive response regulation. The adaptive response gene network is composed of the ada-alkB operon, alkA and aidB. Methylation of the damage sensor protein Ada turns itself into a transcriptional activator the regulon. (B) Ada N-terminal domain (PDB: 1ZGW) and C-terminal domain (PDB: 1SFE) carry the methylated phosphotriester (MPT) and O6meG repair activities, respectively. The methyl acceptors C38 and C321 are shown in orange. (C–F) Microfluidic-based imaging of the expression levels of adaptive response proteins upon 1 mM MMS treatment (shaded background). Single-cell time-traces of the average fluorescence intensity per cell for Ada-mYPet (cells = 104) (C), AlkB-mYPet (cells = 265) (D), AlkA-mYPet (cells = 228) (E) and AidB-mYPet (cells = 146) (F). Example of cells with delayed gene induction are shown in red. Coloured curves represent the cell average fluorescence intensity time trace.
Figure 2.
Figure 2.
Fluctuations in ada expression are propagated to alkA. Dual reporter assays of Ada-CFP and Alka-mYPet expression. (A) Example snapshots of microfluidic single-cell imaging of the dual reporter strain carrying Ada-CFP (cyan) and AlkA-mYPet (yellow) reporters with constant 1 mM MMS treatment. (B) Example time traces showing activation of Ada-CFP and AlkA-mYPet after 1 mM MMS addition (shaded background) in a single cell. (C) Cell-average fluorescence intensity of Ada-CFP and AlkA-mYPet (cells = 139). Curves were normalized by their maximum value and background level at time of MMS addition (0 h) was subtracted. Inset shows fluorescence time traces and their standard deviations about the mean without normalization. (D) Correlation plot showing the delay between 1 mM MMS addition and response activation for Ada-CFP and AlkA-mYPet. Each circle represents one cell (cells = 139). R: Pearson correlation coefficient. Average delays Ada-CFP = 63 ± 19 min (standard deviation), AlkA-mYPet = 71 ± 20 min (standard deviation). The red line shows the best linear fit (AlkA delay = Ada delay + 8 min). (E) Example single-cell trace showing correlated fluctuations of Ada-CFP and AlkA-mYPet expression at steady-state after response activation with constant 1 mM MMS treatment. (F) Cross-correlation analysis of Ada and AlkA expression at steady-state after response activation with constant 1 mM MMS treatment. Cross-correlation curves were computed from the Ada-CFP and AlkA-mYPet intensity traces of individual cells, and then averaged over 139 cells (black curve). The expression dynamics of the two genes are positively correlated over a relative lag period between the signals of ± 1 h. As controls, there is no correlation between AlkA-mYPet and the intensity of the constitutively expressed mKate2 cell marker (blue curve), and no correlation between Ada-CFP and the AlkA-mYPet intensity from a different randomly chosen cell (red curve). Controls were also averaged over 139 cells. Therefore, correlations between Ada and AlkA expression are not caused by global fluctuations in cell growth behaviour or the measurement conditions.
Figure 3.
Figure 3.
The basal expression level of the adaptive response proteins is very low. (A) Example of single molecule spots detected within chemically fixed cells after in vivo HaloTag labelling with TMR ligand (without MMS treatment). Upper panel = brightfield, lower panel = TMR fluorescence; scale bar = 1 μm. The distribution of Ada-Halo (cells = 121), AlkB-Halo (cells = 94), AlkA-Halo (cells = 238) and AidB-Halo (cells = 105) proteins per cell are shown in panels (B–E), respectively.
Figure 4.
Figure 4.
Contribution of Ada, AlkB and AlkA to cell survival and mutation prevention during alkylation stress. (A) Example of real-time imaging of DNA mismatches. DNA methylation lesions result in nucleotide misincorporation during DNA replication. DNA mismatches are recognized by MutL-mYPet that forms fluorescent foci (yellow dots) and enables automated DNA mismatch detection (yellow circles). Fluorescence of the segmentation marker mKate2 is shown in red. (B) Cell-average rate of DNA mismatch foci during constant 1 mM MMS treatment (shaded background) for strains Δada-alkB (blue, cells = 435), ΔalkB (green, cells = 347), ΔalkA (red, cells = 518), adaC321A (purple, cells = 395) and the WT strain (black, cells = 527). Mismatch rate curves have been smoothed using a moving average filter of 30 min. (C) Distribution of cell survival times in the microfluidic channels during constant 1 mM MMS treatment for the same strains.
Figure 5.
Figure 5.
Increased mutation frequency of the cell subpopulation with a delayed adaptive response. (A) Boxplots showing the number of rifampicin-resistant colonies for Ada-Activated, Ada-Delayed subpopulations and the Δada-alkB strain after 90 min treatment with different MMS concentrations. Each subpopulation was sorted according to sorting gates defined by Pada-GFP intensity (example in inset). Biologically independent experiments (cultures started from distinct singles colonies) are grouped by colour. For each biological replicate, three rounds of sorting were performed and plated on separate rifampicin plates. P-values from two-tailed t-test. (B) Barplot showing the frequency of rifampicin-resistance mutations of Ada-Activated and Ada-Delayed subpopulation after 90 min treatment with different MMS concentrations. The mutation frequency was computed from the product of the rifampicin-resistant mutant counts and the percentage of cells sorted for each subpopulation (average percentages shown).
Figure 6.
Figure 6.
Cell-to-cell variability in DNA alkylation repair as a source of genetic plasticity. The stochastic expression of Ada splits the isogenic E. coli population into two distinct subpopulations. The subpopulation with a delayed adaptive response becomes hypermutable during alkylation stress. In contrast to a Δada-alkB hypermutable population, the delayed wild-type cells can eventually activate the adaptive response and thereby increase their chance of survival. This viable subpopulation can act as a source of genetic plasticity.

Similar articles

Cited by

References

    1. Pribis J.P., García-Villada L., Zhai Y., Lewin-Epstein O., Wang A.Z., Liu J., Xia J., Mei Q., Fitzgerald D.M., Bos J.et al. .. Gamblers: an antibiotic-induced evolvable cell subpopulation differentiated by reactive-oxygen-induced general stress response. Mol. Cell. 2019; 74:785–800. - PMC - PubMed
    1. Meouche I.E., Dunlop M.J.. Heterogeneity in efflux pump expression predisposes antibiotic-resistant cells to mutation. Science. 2018; 362:686–690. - PMC - PubMed
    1. Vincent M.S., Uphoff S.. Bacterial phenotypic heterogeneity in DNA repair and mutagenesis. Biochem. Soc. Trans. 2020; 48:451–462. - PMC - PubMed
    1. Didelot X., Walker A.S., Peto T.E., Crook D.W., Wilson D.J.. Within-host evolution of bacterial pathogens. Nat. Rev. Microbiol. 2016; 14:150–162. - PMC - PubMed
    1. Friedberg E.C., Walker G.C., Siede W., Wood R.D.. DNA Repair and Mutagenesis. 2005; USA: American Society for Microbiology Press.

Publication types

MeSH terms

LinkOut - more resources