. 2022 Apr 1;24(4):612-623.
doi: 10.1093/neuonc/noab273.

Establishment of patient-derived organoid models of lower-grade glioma

Affiliations

Establishment of patient-derived organoid models of lower-grade glioma

Kalil G Abdullah et al. Neuro Oncol. .

Abstract

Background: Historically, creating patient-derived models of lower-grade glioma (LGG) has been challenging, contributing to few experimental platforms that support laboratory-based investigations of this disease. Although organoid modeling approaches have recently been employed to create in vitro models of high-grade glioma (HGG), it is unknown whether this approach can be successfully applied to LGG.

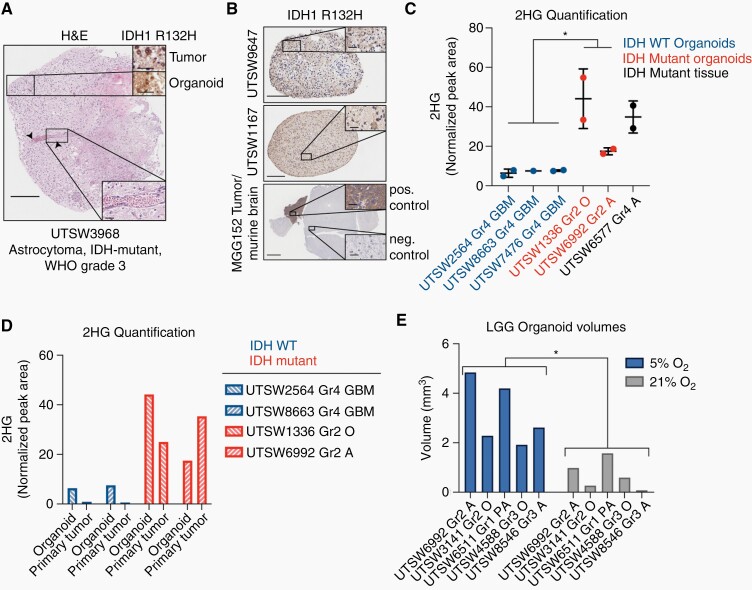
Methods: In this study, we developed an optimized protocol for the establishment of organoids from LGG primary tissue samples by utilizing physiologic (5%) oxygenation conditions and employed it to produce the first known suite of these models. To assess their fidelity, we surveyed key biological features of patient-derived organoids using metabolic, genomic, histologic, and lineage marker gene expression assays.

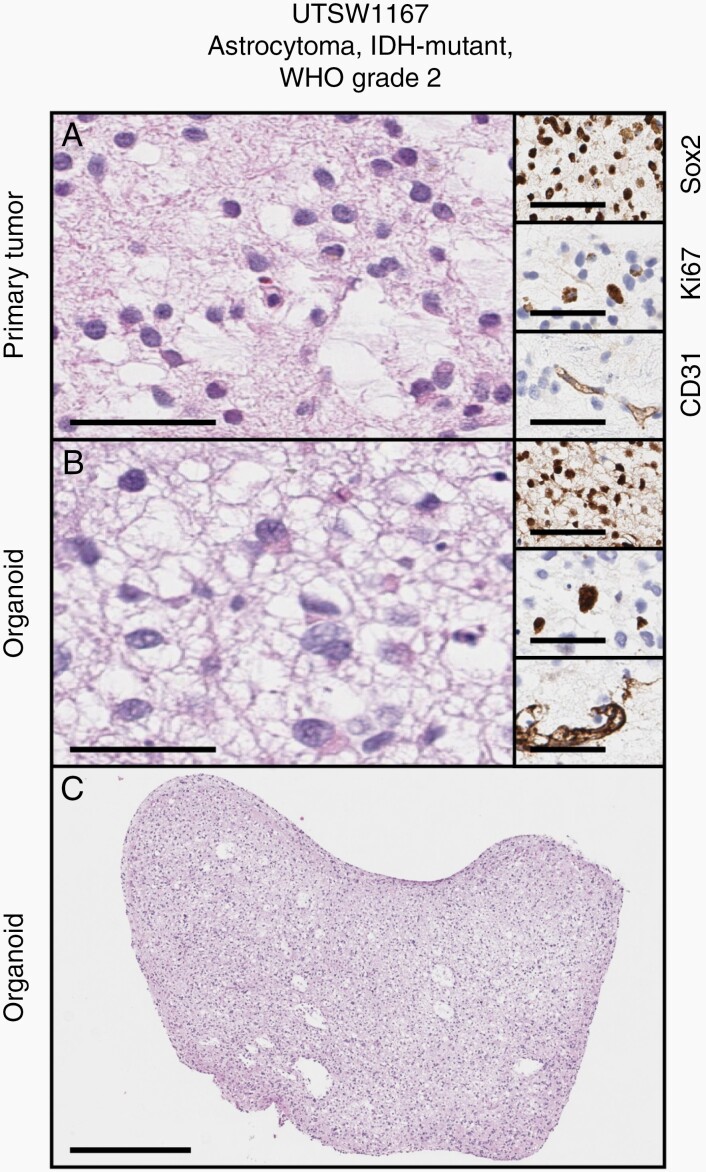
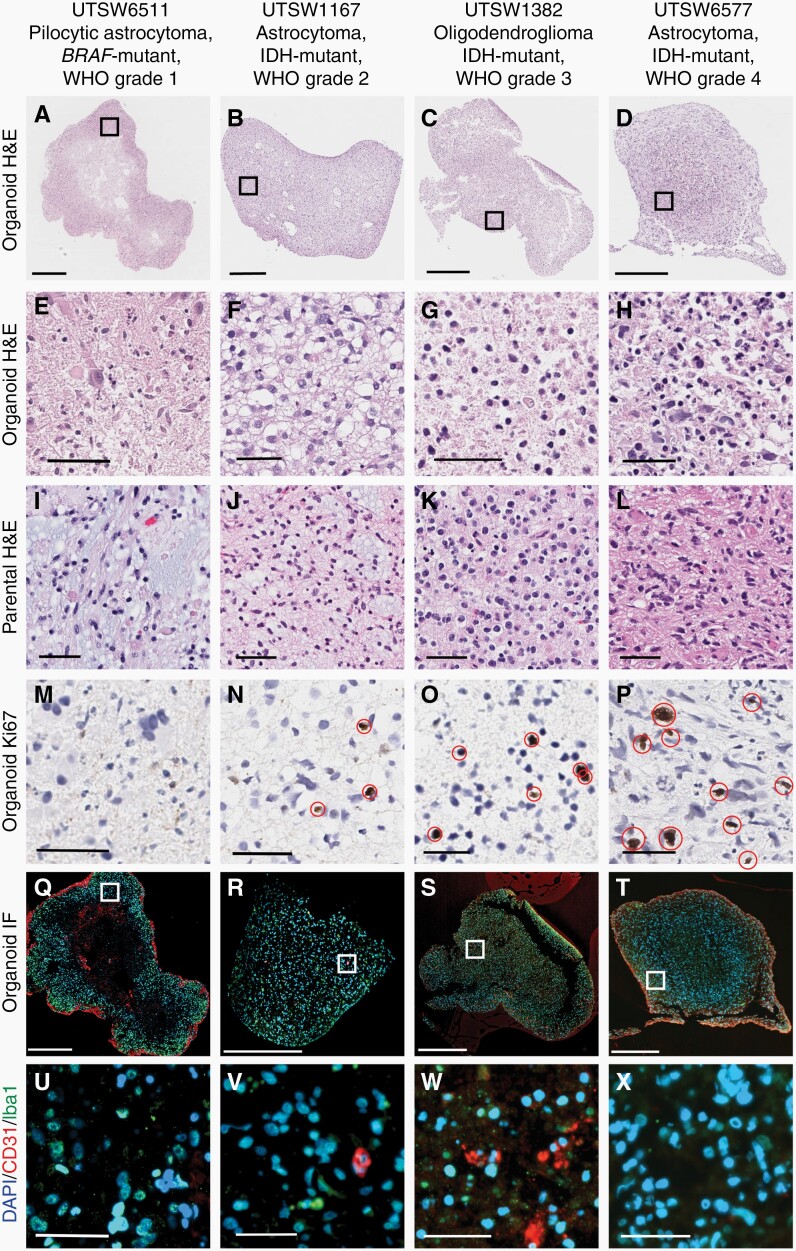
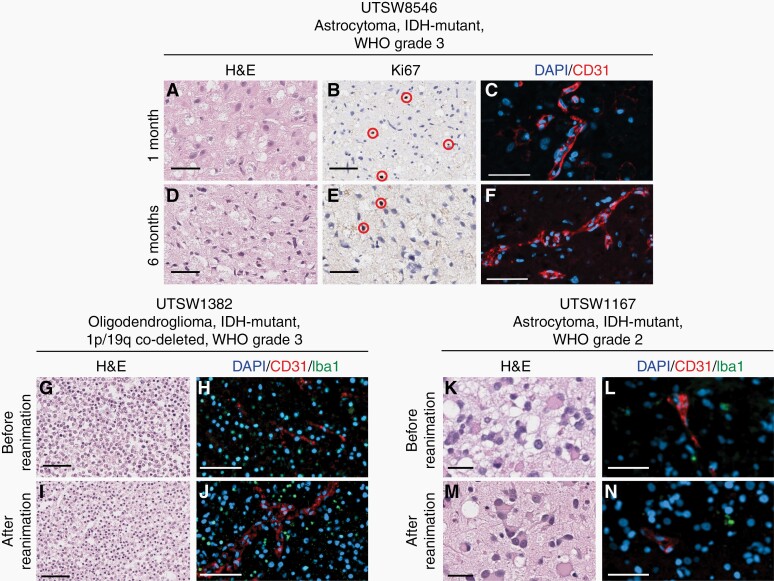
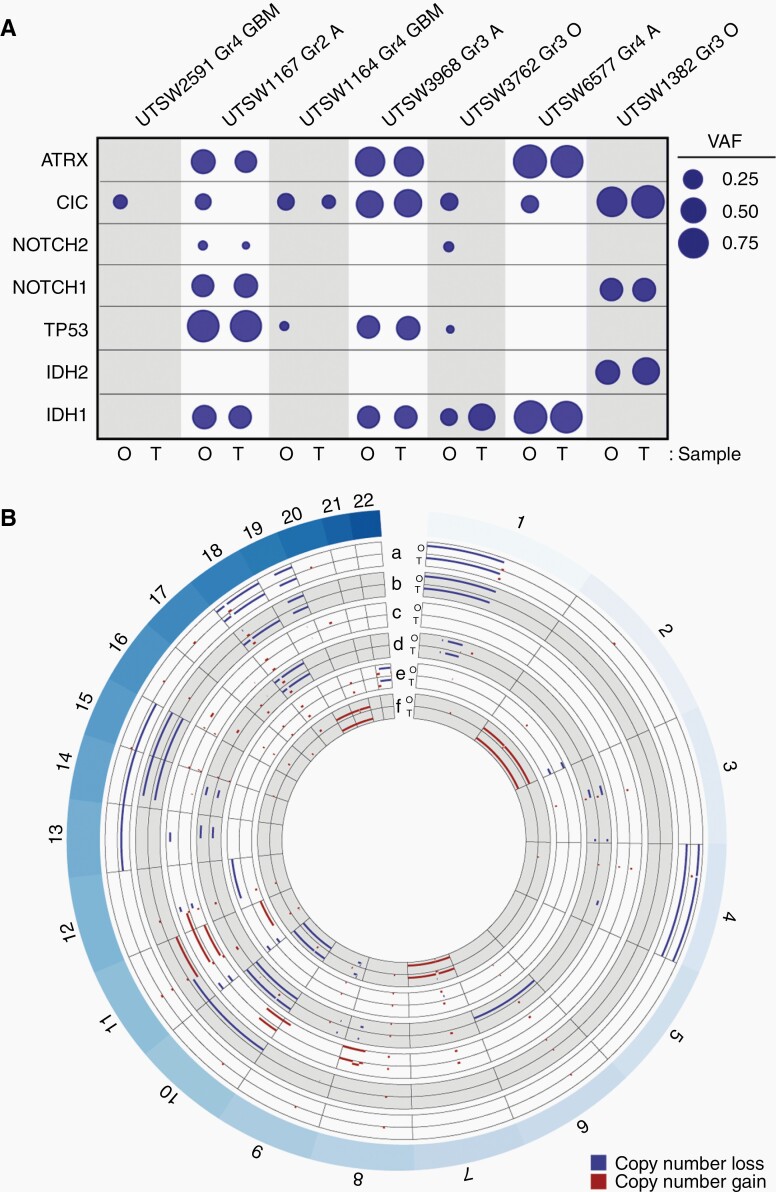
Results: Organoid models were created with a success rate of 91% (n = 20/22) from primary tumor samples across glioma histological subtypes and tumor grades (WHO Grades 1-4), and a success rate of 87% (13/15) for WHO Grade 1-3 tumors. Patient-derived organoids recapitulated stemness, proliferative, and tumor-stromal composition profiles of their respective parental tumor specimens. Cytoarchitectural, mutational, and metabolic traits of parental tumors were also conserved. Importantly, LGG organoids were maintained in vitro for weeks to months and reanimated after biobanking without loss of integrity.

Conclusions: We report an efficient method for producing faithful in vitro models of LGG. New experimental platforms generated through this approach are well positioned to support preclinical studies of this disease, particularly those related to tumor immunology, tumor-stroma interactions, identification of novel drug targets, and personalized assessments of treatment response profiles.

Keywords: glioblastoma; glioma; lower grade glioma; organoids; preclinical models.


Figures

Fig. 3
Fig. 3
IDH1 oncoprotein expression and 2HG production are preserved in LGG organoids. (A) Main figure: H&E stain of an organoid derived from an IDH1 R132H-positive astrocytoma. Arrows denote a longitudinal vascular channel, which is shown at higher magnification in lower inset. Upper insets: IDH1 R132H oncoprotein detection by IHC in primary tumor and organoid tissues. Scale bars: main figure = 250 µm, insets = 50 µm. (B) IDH1 R132H oncoprotein IHC in two astrocytoma organoid models, UTSW9647 and UTSW1167, and in normal and malignant brain tissue in the MGG152 orthotopic xenograft model of astrocytoma, IDH-mutant, WHO Grade 4 (scale bars in main figures = 200 µm, 500 µm, and 2 mm, respectively). Scale bars in insets = 50 µm. Staining patterns in MGG152 tumor tissue and normal murine brain tissue serve as positive and negative controls, respectively. (C) LC-MS-based 2HG quantification in IDH-wildtype organoids (blue), IDH-mutant organoids (red), and an IDH-mutant primary tumor tissue sample (black, positive control). (D) LC-MS-based 2HG quantification in paired organoid and primary tumor tissues from selected specimens in C. Blue = IDH-wildtype, red = IDH-mutant. In parts C and D, values represent 2HG peak areas relative to that of an internal reference metabolite, N-acetyl-asparagine. (E) Organoids were cultured under either 5% (physiologic) or 21% (supraphysiologic) oxygen. Organoid volumes were calculated via microscopy. Abbreviations: Gr, Grade; GBM, glioblastoma; O, oligodendroglioma; A, astrocytoma; PA, pilocytic astrocytoma. In C, data are means ±standard deviation; two-tailed P value was determined by unpaired t-test. In E, two-tailed P value was determined by ratio paired t-test. *P < .05. Organoids were cultured for 4–6 weeks after explantation.
Fig. 1
Fig. 1
Successful establishment of a patient-derived organoid model of astrocytoma. (A and B) Cytoarchitecture, stemness, proliferation, and vascular endothelial profiles are maintained between parental tumor and organoid (main figures: H&E stains, insets top to bottom: Sox2, Ki67, CD31 IHC). (C) Gross appearance of LGG organoid displayed in B. Scale bars in A and B: main figures = 100µm, insets = 50µm. Scale bar in C = 500µm. Primary sample and organoid are from an astrocytoma, IDH-mutant, WHO Grade 2 (UTSW1167). Organoid was cultured for 5 weeks after explantation.
Fig. 2
Fig. 2
Glioma organoids recapitulate cellular heterogeneity and parental tumor characteristics across tumor grades. Macroscopic (A–D) and high-powered view (E–H) of organoids and corresponding parental tumors (denoted “parental”, I–L) spanning WHO Grades 1–4. (M–P) Cellular proliferation in organoids, as measured by Ki67 IHC, correlates with parental tumor grade. Immunofluorescence microscopy detection of macrophages/microglia and vascular endothelial cells present in organoids at low- (Q–T) and high-powered (U–X) views. Note: CD31 positivity not observed in panels U and X. Red ellipses denote Ki67+ cells. In Q–X, blue = DAPI, red = CD31, green = Iba1. Scale bars: A–D, Q–T = 500 µM, all others = 50 µM. Organoids were cultured for 4–6 weeks after explantation.
Fig. 4
Fig. 4
Organoids maintain cytoarchitecture and proliferation during long-term culture and can be cryopreserved. Organoids from an astrocytoma, IDH-mutant, WHO Grade 3 (USTW8546) were cultured for 1 month (A–C) or 6 months (D–F) prior to analysis. Organoids were evaluated by H&E staining (A and D), Ki67 IHC (B and E), and CD31 IF (C and F). In parts B and E, red ellipses denote Ki67+ cells. Organoids from an oligodendroglioma, IDH-mutant, 1p/19q co-deleted, WHO Grade 3 (UTSW1382) and an astrocytoma, IDH-mutant, WHO Grade 2 (UTSW1167) were cultured for 4 weeks and analyzed immediately (G, H, K, and L) or biobanked, reanimated, and cultured for one week prior to analysis (I, J, M, and N). Organoids were evaluated by H&E staining (G, I, K, and M) and CD31/Iba1 IF (H, J, L, and N). In C, F, H, J, L, and N, red = CD31 and blue = DAPI. In H, J, L, and N, green = Iba1. In G–J, scale bars = 100 µm. In all other panels, scale bars = 50 µm.
Fig. 5
Fig. 5
LGG organoids retain disease-specific genomic hallmarks. (A) LGG organoids largely retain key genetic mutations observed in their respective parental tumor specimens. Genomic DNA from organoid-primary tumor pairs was analyzed via targeted sequencing. Variant allele frequency (VAF) was calculated for each mutated gene. Mutations and single nucleotide variants that are not predicted to be pathogenic were excluded. Circle areas correspond to VAFs for each gene. Abbreviations at top of figure: Gr, Grade; GBM, glioblastoma; O, oligodendroglioma; A, astrocytoma. Abbreviations at bottom of figure: O: organoid, T: tumor. (B) LGG organoids retain copy number alterations observed in their respective parental tumor specimens. DNA sequencing data from part A was used to construct concentric Circos plots depicting copy number variations in paired organoid (O) and tumor (T) samples for the following tumors: a) oligodendroglioma, IDH-mutant, 1p/19q co-deleted, WHO Grade 3 (UTSW1382), b) oligodendroglioma, IDH-mutant, 1p/19q co-deleted, WHO Grade 3 (UTSW3762), c) astrocytoma, IDH-mutant, WHO Grade 3 (UTSW3968), d) GBM, IDH-wildtype, WHO Grade 4 (UTSW1164), e) astrocytoma, IDH-mutant, WHO Grade 2 (UTSW1167), f) GBM, IDH-wildtype, WHO Grade 4 (UTSW2591). Labels around circumference represent chromosome numbers. Scale of each axis ranges from copy number 0 (closer to exterior of the circle) to 4 (closer to interior of the circle), with any regions of copy number 2 not plotted. Red = gains, blue = losses. All samples with copy number >4 are plotted with copy number set to 4. Notably, 1p/19q co-deletion is observed in both organoid and primary tumor samples in a and b. Organoids were cultured for 4–6 weeks after explantation.

Similar articles

Cited by

References

    1. Ostrom QT, Gittleman H, Liao P, et al. CBTRUS statistical report: primary brain and central nervous system tumors diagnosed in the United States in 2007-2011. Neuro Oncol. 2014;16 Suppl 4:iv1–63. - PMC - PubMed
    1. Aldape K, Zadeh G, Mansouri S, Reifenberger G, von Deimling A. Glioblastoma: pathology, molecular mechanisms and markers. Acta Neuropathol. 2015;129(6):829–848. - PubMed
    1. Hottinger AF, Abdullah KG, Stupp R. Current standards of care in glioblastoma therapy. In: Glioblastoma. Elsevier Inc.; 2016: 73– 80. doi:10.1016/B978-0-323-47660-7.00006-9 - DOI
    1. Post GR, Dawson G. Characterization of a cell line derived from a human oligodendroglioma. Mol Chem Neuropathol. 1992;16(3):303–317. - PubMed
    1. Koivunen P, Lee S, Duncan CG, et al. Transformation by the (R)-enantiomer of 2-hydroxyglutarate linked to EGLN activation. Nature. 2012;483(7390):484–488. - PMC - PubMed

Publication types