. 2022 Feb 4;188(2):861-878.
doi: 10.1093/plphys/kiab537.

Shoot and root single cell sequencing reveals tissue- and daytime-specific transcriptome profiles

Affiliations

Shoot and root single cell sequencing reveals tissue- and daytime-specific transcriptome profiles

Federico Apelt et al. Plant Physiol. .

Abstract

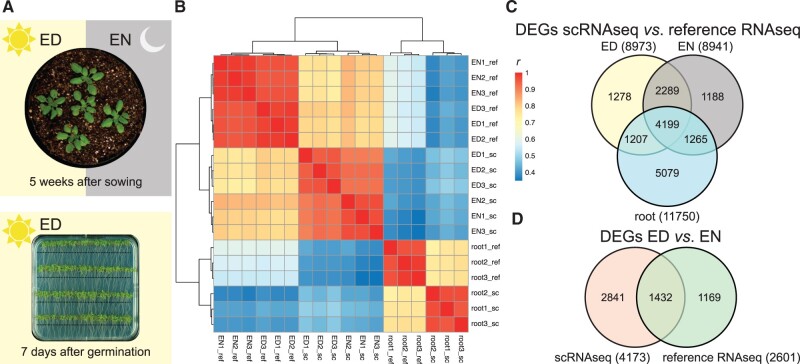
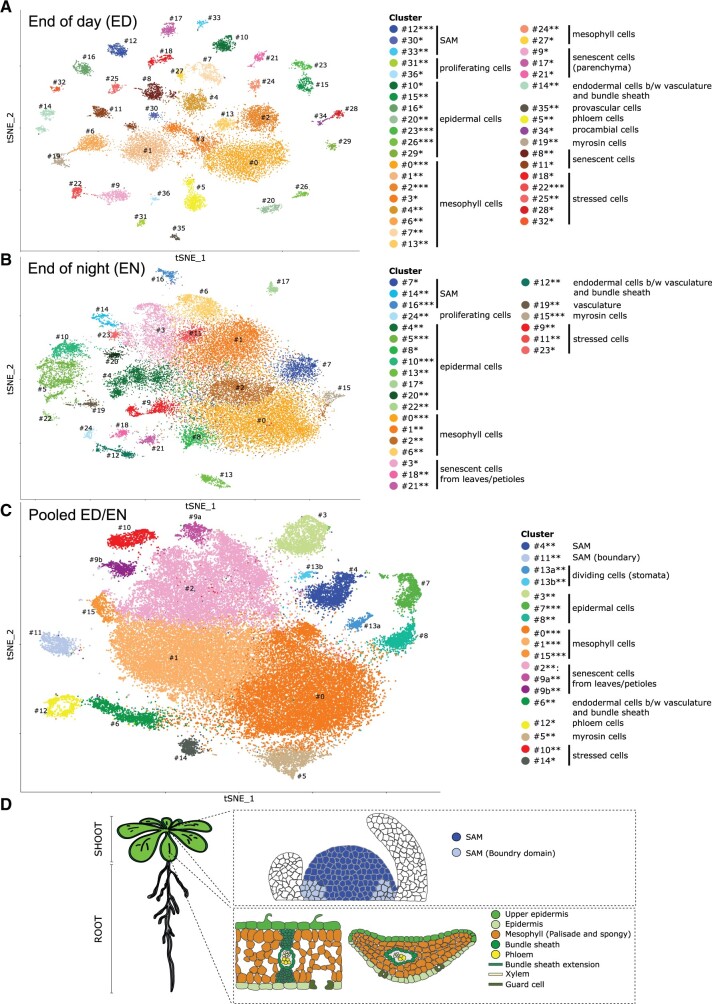
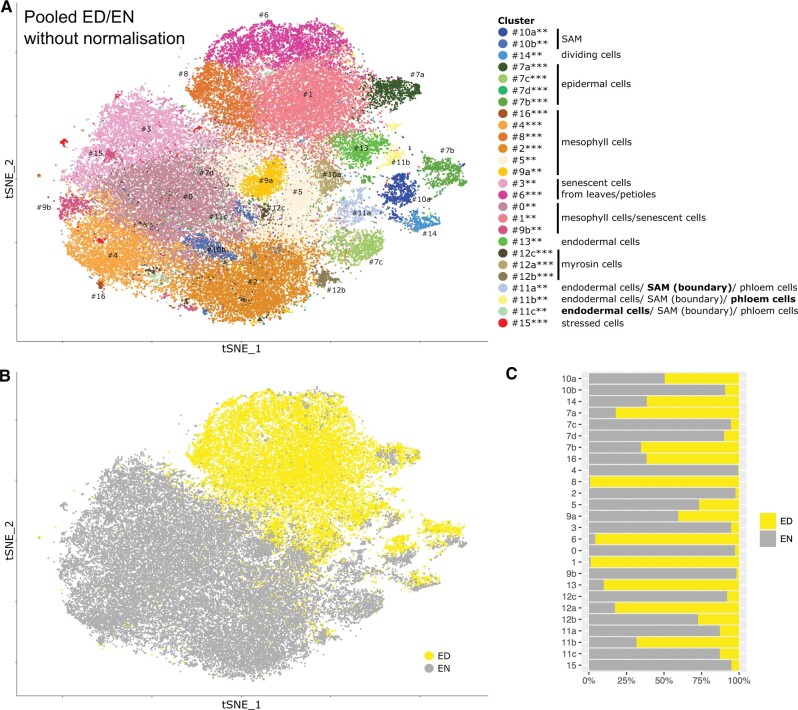
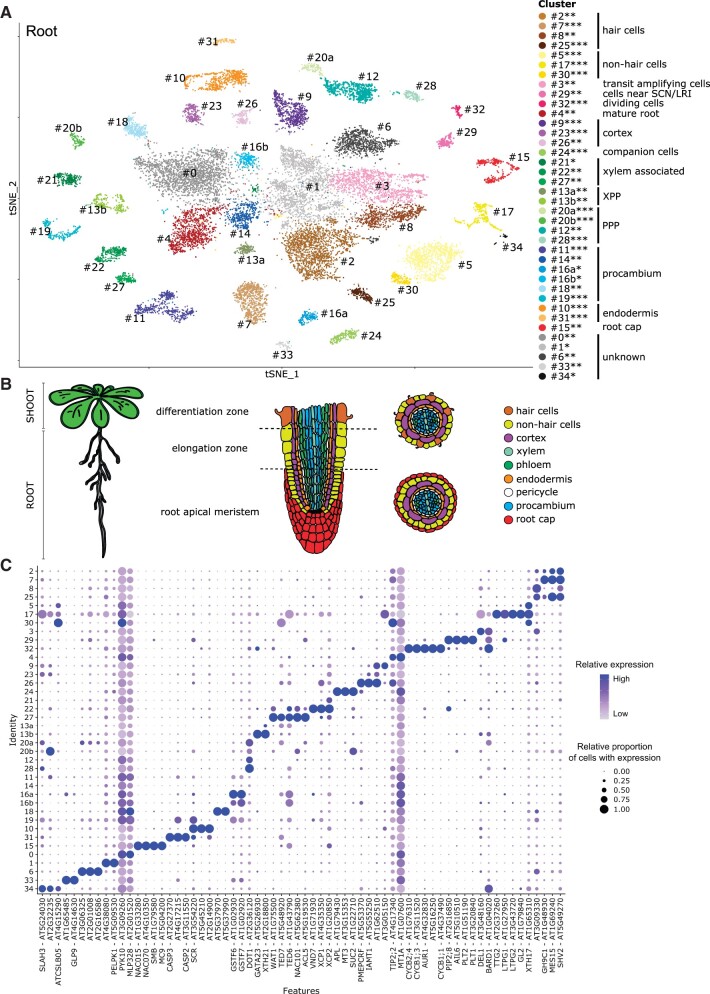
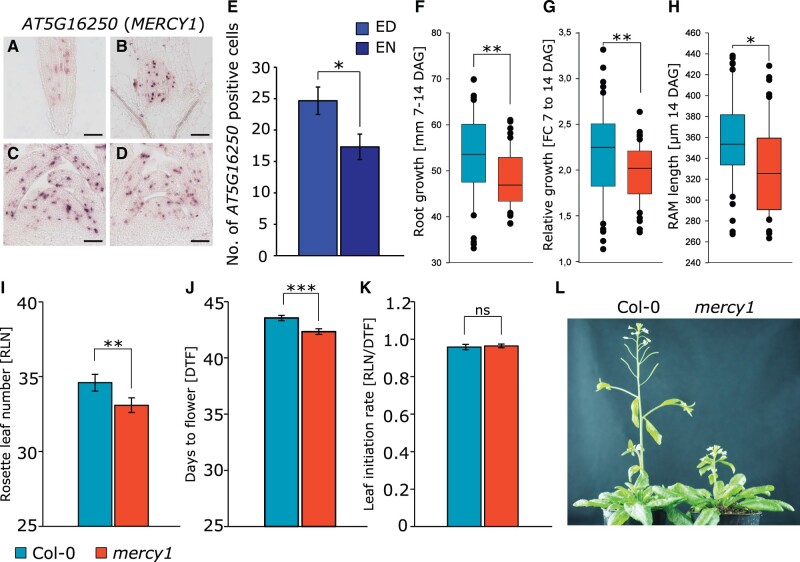
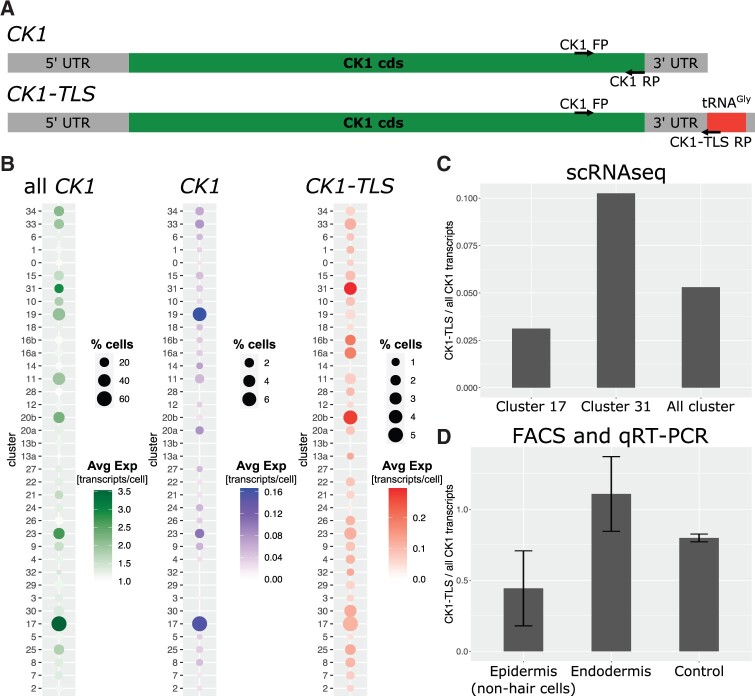
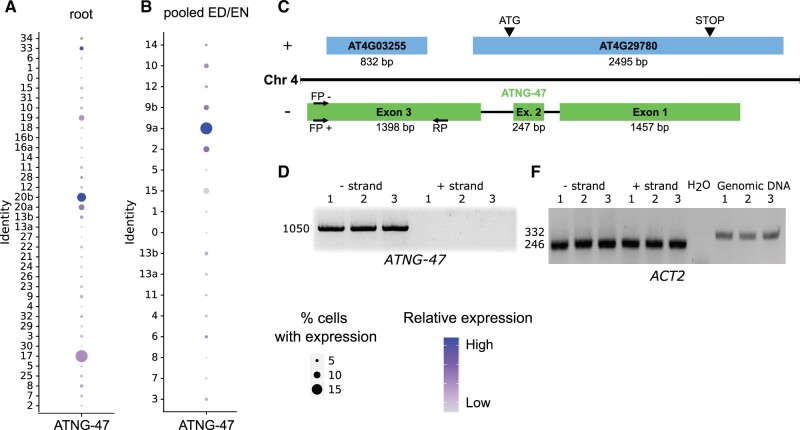
Although several large-scale single-cell RNA sequencing (scRNAseq) studies addressing the root of Arabidopsis (Arabidopsis thaliana) have been published, there is still need for a de novo reference map for both root and especially above-ground cell types. As the plants' transcriptome substantially changes throughout the day, shaped by the circadian clock, we performed scRNAseq on both Arabidopsis root and above-ground tissues at defined times of the day. For the root scRNAseq analysis, we used tissue-specific reporter lines grown on plates and harvested at the end of the day (ED). In addition, we submitted above-ground tissues from plants grown on soil at ED and end of the night to scRNAseq, which allowed us to identify common cell types/markers between root and shoot and uncover transcriptome changes to above-ground tissues depending on the time of the day. The dataset was also exploited beyond the traditional scRNAseq analysis to investigate non-annotated and di-cistronic transcripts. We experimentally confirmed the predicted presence of some of these transcripts and also addressed the potential function of a previously unidentified marker gene for dividing cells. In summary, this work provides insights into the spatial control of gene expression from nearly 70,000 cells of Arabidopsis for below- and whole above-ground tissue at single-cell resolution at defined time points.


Figures

Figure 1
Figure 1
Experimental overview with clustering and DEGs. A, Roots were harvested at the ED from 7-d-old plants approx. 1 cm below the hypocotyl (indicated by the black line); the above-ground tissue was harvested at the ED and EN from 5-week-old plants. For the single-cell samples, the tissue was harvested 75 min before the ED (or EN) time point and used for protoplast preparation. For the reference RNAseq libraries, the tissue was harvested 15 min before the ED (or EN) time point and shock frozen in liquid nitrogen. B, Hierarchical clustering of the sequenced scRNAseq (sc) and reference RNAseq (ref) libraries using Pearson’s correlation coefficient (r) as distance measure. C, Venn diagram of DEGs between scRNAseq and reference RNAseq for the different timepoints and tissues. D, Venn diagram of DEGs between ED and EN for scRNAseq and reference RNAseq. DEGs are defined as |log2FC| ≥ 1 and FDR of 0.05.
Figure 2
Figure 2
Single-cell transcriptome of A. thaliana above-ground tissue. A, t-SNE projection plot of 37 clusters identified from 18,313 cells in Col-0 rosette tissues harvested at the ED (n = 3 replicates). B, t-SNE visualization of 25 clusters identified from 31,665 cells in Col-0 rosette tissues harvested at the EN (n = 3 replicates). C, t-SNE projection plot showing 16 main clusters identified from 49,978 pooled cells in Col-0 rosette tissues harvested ED and EN (n = 6 replicates). Each dot represents the transcriptome from one cell. Cells represented by the same colors correspond to the same cluster. Cells identified in different clusters but belonging to the same tissue types are represented with similar colors. The cluster robustness was scored based on cell co-occurrence in subsampled data 75%–100% (***), 50%–75% (**), 25%–50% (*) (see “Materials and methods”; Supplemental Figure S7). D, Schematic representation of rosette cell types of Arabidopsis plants. Upper panel represents longitudinal section through the meristem, whereas lower panel shows longitudinal and cross section of the leaf.
Figure 3
Figure 3
Singe-cell transcriptome of A. thaliana above-ground tissue without batch normalization. A, t-SNE projection plot showing 17 main clusters identified from 49,978 pooled cells in Col-0 rosette tissues harvested ED and EN (n =6 replicates). The cells are the same as shown in panel C, however, this clustering was performed without batch normalization, that is without using Harmony (see “Materials and methods”). Each dot represents the transcriptome from one cell. Cells represented by the same colors correspond to the same cluster. Cells identified in different clusters but belonging to the same tissue types are represented with similar colors. The cluster robustness was scored based on cell co-occurrence in subsampled data 75%–100% (***), 50%–75% (**), 25%–50% (*) (see “Materials and methods”; Supplemental Figure S7). B, Same t-SNE projection plot as in A, but cells of the same color correspond to the same time point of harvest (ED or EN). C, Fraction of cells belonging to ED or EN for each cluster.
Figure 4
Figure 4
Singe-cell transcriptome of A. thaliana roots. A, t-SNE projection plot of 35 main clusters identified from 19,153 cells in Col-0 root tissues (n =3 replicates). Each dot represents the transcriptome from one cell. Cells represented by the same colors correspond to the same cluster. Cells identified in different clusters but belonging to the same tissue types are represented with similar colors. The cluster robustness was scored based on cell co-occurrence in subsampled data 75%–100% (***), 50%–75% (**), 25%–50% (*) (see “Materials and methods”; Supplemental Figure S7). B, Schematic representation of the root cell types in Arabidopsis plants. Middle panel represents longitudinal section through the root, whereas the right panel shows cross section through the differentiation (upper) and meristematic (bottom) zone of the root. C, Dot plot representing transcript accumulation of known and non-annotated marker genes for each cluster. The color scale denotes the relative expression (average per cell). The dot size denotes the relative proportion of cells with expression. Color scale and dot size are scaled to the minimum/maximum expression level and proportion of cells with expression, respectively, of the transcript within the clusters; for the absolute percentages, see Supplemental Table S20. SCN, stem cell niche; LRI, lateral root initials; XPP, xylem pole pericyle; PPP, phloem pole pericyle.
Figure 5
Figure 5
Physiological characterization of dividing cell marker AT5G16250 (MERCY1). A–D, RNA in situ hybridization using AT5G16250 as probe on longitudinal sections through (A) root and (B) SAMs of Col-0 plants harvested at the (C) ED and (D) night (EN). Scale bars equal 100 µm. E, Number of AT5G16250-positive cells at the SAM of Col-0 plants at the ED and EN (n > 3). F, Absolute root growth, G, Relative root growth, H, RAM length analyzed from 7 till 14 DAG in Col-0 (n > 50) and mercy1 (n > 50) mutant plants grown on plates. I–J, Flowering time determined as (I) RLN and (J) DTF. K, LIR. L, Flowering phenotype of Col-0 (n > 20) and mercy1 (n > 20) mutant plants. Error bars indicate sd. Statistical difference was calculated using Student’s t test (*P < 0.05; **P < 0.01; ***P < 0.001; ns, not significant).
Figure 6
Figure 6
Tissue-specific presence of mono- and di-cistronic CK1 transcripts. A, Schematic representation of both CK1 transcripts, that is with and without tRNAGly in the 3′UTR named CK1-TLS and CK1, respectively. Arrows indicate primers (FP, forward primer; RP, reverse primer) used to detect all CK1 transcripts and specifically CK1-TLS transcripts via RT-qPCR (Supplemental Table 1). B, Dot plot of average CK1 expression and percentage of cells with expression of all CK1 transcripts, mono-cistronic CK1 and di-cistronic CK1-TLS in root clusters (see Figure  4). Cells with CK1 expression are considered for calculating the average expression. C, Ratio of CK1-TLS compared with all CK1 transcripts in clusters 17, 31, and all clusters. D, Ratio of CK1-TLS compared with all CK1 transcripts in epidermal cells, endodermal cells, and control cells estimated via FACS and RT-qPCR with specific primers (see “Materials and methods”). Error bars indicate sd calculated with error propagation from n = 3 biological samples (each with three technical replicates) for epidermis and endodermis. Control refers to pooled protoplasts without fluorescence signal from all samples (see Supplemental Figure S20).
Figure 7
Figure 7
Non-annotated locus (ATNG-47) with tissue-specific expression. A, Dot plot of expression of ATNG-47 transcript in root (see Figure  4) and B, rosette (pooled ED/EN) clusters (see Figure  2). The color scale denotes the relative expression (average per cell). The dot size is scaled to the proportion of cells per cluster with ATNG-47 expression. C, Schematic representation of ATNG-47 transcript located on chromosome 4 on the negative strand, partially overlapping with AT4G29780 and AT4G03255 on the positive strand. Arrows indicate strand-specific primers (FP, forward primer; RP, reverse primer) used to detect ATNG-47. D, ATNG-47 amplification (1,050 bp region in exon 3) using negative strand-specific cDNA library. E, ACTIN2 (ACT2) primers spanning an intron so that cDNA PCR results in a 246 bp band and gDNA results in a 332 bp band. 246 bp band in the cDNA samples confirms gDNA absence in cDNA libraries.

References

    1. Apelt F, Breuer D, Nikoloski Z, Stitt M, Kragler F (2015) Phytotyping4D: a light‐field imaging system for non‐invasive and accurate monitoring of spatio‐temporal plant growth. Plant J 82: 693–706 - PubMed
    1. Birnbaum K, Shasha DE, Wang JY, Jung JW, Lambert GM, Galbraith DW, Benfey PN (2003) A gene expression map of the Arabidopsis root. Science 302: 1956–1960 - PubMed
    1. Brady SM, Orlando DA, Lee J-Y, Wang JY, Koch J, Dinneny JR, Mace D, Ohler U, Benfey PN (2007) A high-resolution root spatiotemporal map reveals dominant expression patterns. Science 318: 801–806 - PubMed
    1. Cheng CY, Krishnakumar V, Chan AP, Thibaud‐Nissen F, Schobel S, Town CD (2017) Araport11: a complete reannotation of the Arabidopsis thaliana reference genome. Plant J 89: 789–804 - PubMed
    1. De Rybel B, Vassileva V, Parizot B, Demeulenaere M, Grunewald W, Audenaert D, Van Campenhout J, Overvoorde P, Jansen L, Vanneste S (2010) A novel aux/IAA28 signaling cascade activates GATA23-dependent specification of lateral root founder cell identity. Curr Biol 20: 1697–1706 - PubMed

Publication types