Review
. 2022 Jan 17;23(1):bbab495.
doi: 10.1093/bib/bbab495.

Addressing noise in co-expression network construction

Affiliations
Review

Addressing noise in co-expression network construction

Joshua J R Burns et al. Brief Bioinform. .

Abstract

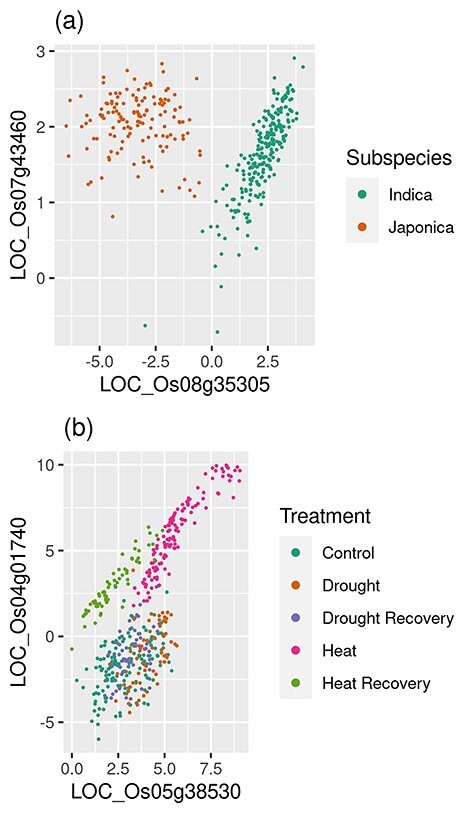
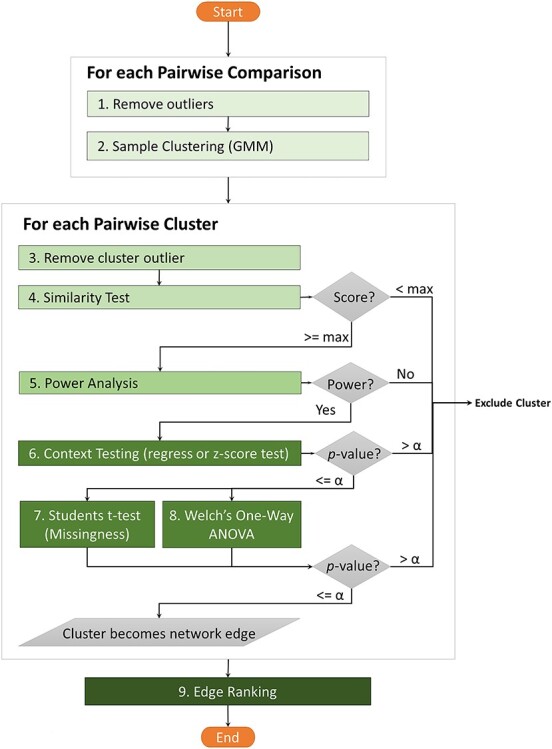
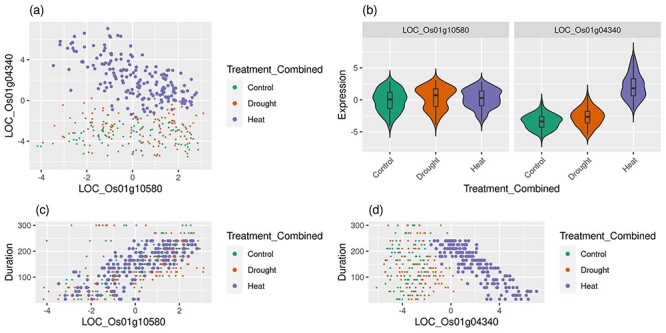
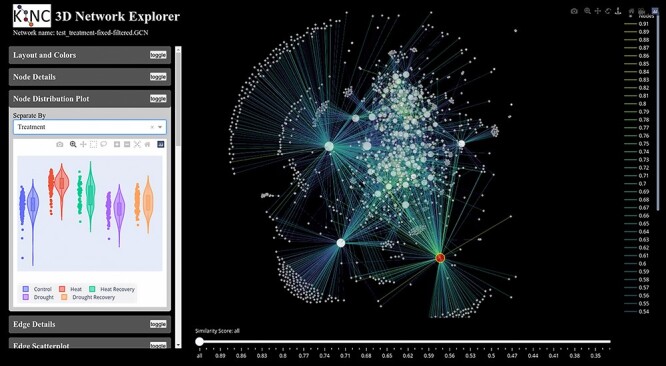
Gene co-expression networks (GCNs) provide multiple benefits to molecular research including hypothesis generation and biomarker discovery. Transcriptome profiles serve as input for GCN construction and are derived from increasingly larger studies with samples across multiple experimental conditions, treatments, time points, genotypes, etc. Such experiments with larger numbers of variables confound discovery of true network edges, exclude edges and inhibit discovery of context (or condition) specific network edges. To demonstrate this problem, a 475-sample dataset is used to show that up to 97% of GCN edges can be misleading because correlations are false or incorrect. False and incorrect correlations can occur when tests are applied without ensuring assumptions are met, and pairwise gene expression may not meet test assumptions if the expression of at least one gene in the pairwise comparison is a function of multiple confounding variables. The 'one-size-fits-all' approach to GCN construction is therefore problematic for large, multivariable datasets. Recently, the Knowledge Independent Network Construction toolkit has been used in multiple studies to provide a dynamic approach to GCN construction that ensures statistical tests meet assumptions and confounding variables are addressed. Additionally, it can associate experimental context for each edge of the network resulting in context-specific GCNs (csGCNs). To help researchers recognize such challenges in GCN construction, and the creation of csGCNs, we provide a review of the workflow.

Keywords: co-expression; gene expression; multidimensional; networks; noise.


Figures

Figure 1
Figure 1
Examples of pairwise condition-specific gene co-expression. RNA-seq expression data were from the NCBI SRA Project PRJNA301554. The figure includes scatter plots of gene pairs with condition-specific co-expression for (A) two rice subspecies and (B) different experimental treatments.
Figure 2
Figure 2
The KINC GCN construction process. The flowchart depicts the eight steps of the KINC workflow for addressing statistical and natural noise in GCN construction. In summary, each pair of genes proceeds through the workflow. First, outliers are removed. Second GMM is performed to identify clusters of expression. Third, cluster outliers are removed and fourth the similarity test (e.g. Pearson or Spearman) is performed. Clusters with a minimum score proceed. Fifth, a power analysis is performed to ensure sufficient statistical power in the correlation test. Clusters with high score proceed. Sixth, clusters are tested for association with context (e.g. experimental conditions) and those with significant P values are associated with the condition and proceed. Seventh, parallel tests for similar patterns of missingness (t-test) and difference in variance (Welch’s one-way ANOVA) are performed. Clusters with significant P values are retained as context-specific edges in the network. Finally, all edges are ranked according to P values and scores to help researcher prioritize edges.
Figure 3
Figure 3
Confounding variables in gene co-expression: Heat example. The expression scatterplot of a rice gene pair is shown. The pair in (A) is poorly correlated overall (SCC = −0.13) but moderately correlated if only the heat samples are considered (SCC = −0.63). In (B) only the LOC_OS01g04340 gene has a visible difference in expression in the heat response with the LOC_OS01g04340 gene showing a visible increase in expression in heat samples. This results in the purple cluster of genes distinctly separated from other samples in (A). In (C) and (D) both genes exhibit a linear relationship with time but LOC_Osg04340 only exhibits time-dependence in heat samples. This covariance of both heat and time in LOC_OSg04340 falsely result in this pair being associated with heat when it is only correlated by time in heat.
Figure 4
Figure 4
KINC GCN visualization. KINC provides a web-based tool for network visualization that allows the researcher to layer and color edges by their similarity score, R2 value, P values, rank, variable categories and relationship direction (negative or positive). The left sidebar provides useful plots such as scatter plots for selected edges, violin plots of expression for selected nodes, scale-free and clustering plots for the network and functional details about nodes.
Figure 5
Figure 5
Computational performance of Steps 1–4 using KINC. Plots (A) and (B) indicate time of execution on a yeast (Saccharomyces cerevisiae) GEM containing 7050 gene transcripts and 188 samples on both CPUs and GPUs respectively. Performance measurements were measured on Clemson’s Palmetto HPC cluster and WSU’s Kamiak HPC cluster. Plot (C) indicates the time required to analyze GEMs of different dimensions on WSU’s Kamiak cluster using three GPUs. Plot (D) indicates the size in MB for the CCM file and the CMX file. KINC was instructed to only retain correlations whose absolute value was greater than or equal to 0.5. The GEM size axis in plots (C) and (D) is represented as the number of gene transcripts versus the number of samples.

References

    1. Eisen MB, Spellman PT, Brown PO, et al. . Cluster analysis and display of genome-wide expression patterns. Proc Natl Acad Sci U S A 1998;95:14863–8. - PMC - PubMed
    1. Civelek M, Lusis AJ. Systems genetics approaches to understand complex traits. Nat Rev Genet 2014;15:34–48. - PMC - PubMed
    1. Lee I, Ambaru B, Thakkar P, et al. . Rational association of genes with traits using a genome-scale gene network for Arabidopsis thaliana. Nat Biotechnol 2010;28:149–56. - PMC - PubMed
    1. Ficklin SP, Feltus FA. Gene coexpression network alignment and conservation of gene modules between two grass species: maize and rice. Plant Physiol 2011;156:1244–56. - PMC - PubMed
    1. Tsaparas P, Mariño-Ramírez L, Bodenreider O, et al. . Global similarity and local divergence in human and mouse gene co-expression networks. BMC Evol Biol 2006;6:70. - PMC - PubMed

Publication types