. 2022 Feb 9;96(3):e0114021.
doi: 10.1128/JVI.01140-21. Epub 2021 Dec 1.

Time Series Transcriptomic Analysis of Bronchoalveolar Lavage Cells from Piglets Infected with Virulent or Low-Virulent Porcine Reproductive and Respiratory Syndrome Virus 1

Affiliations

Time Series Transcriptomic Analysis of Bronchoalveolar Lavage Cells from Piglets Infected with Virulent or Low-Virulent Porcine Reproductive and Respiratory Syndrome Virus 1

J M Sánchez-Carvajal et al. J Virol. .

Abstract

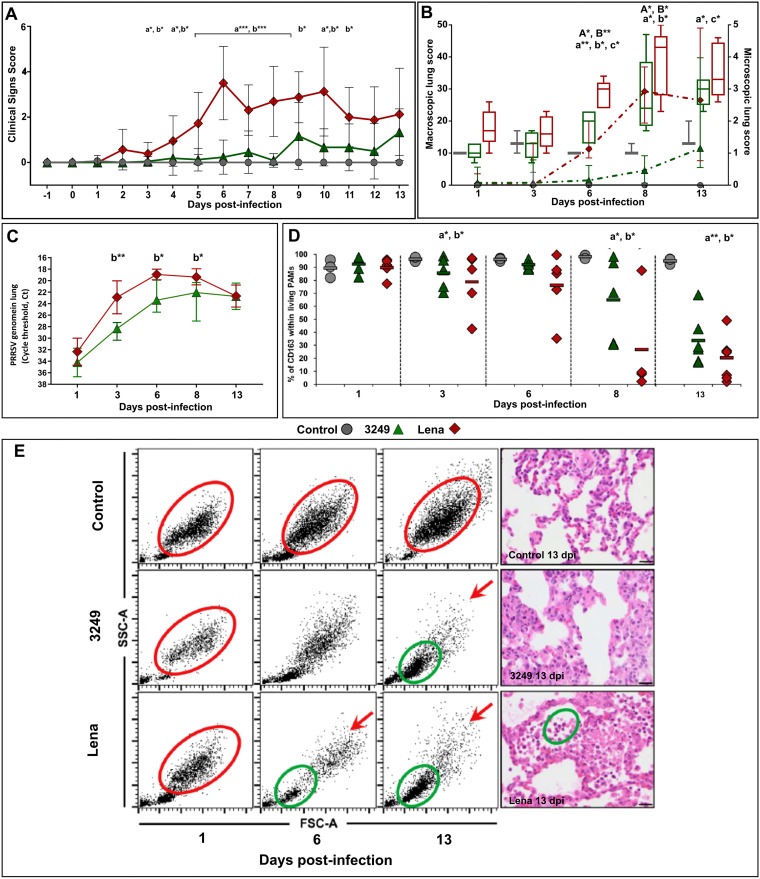
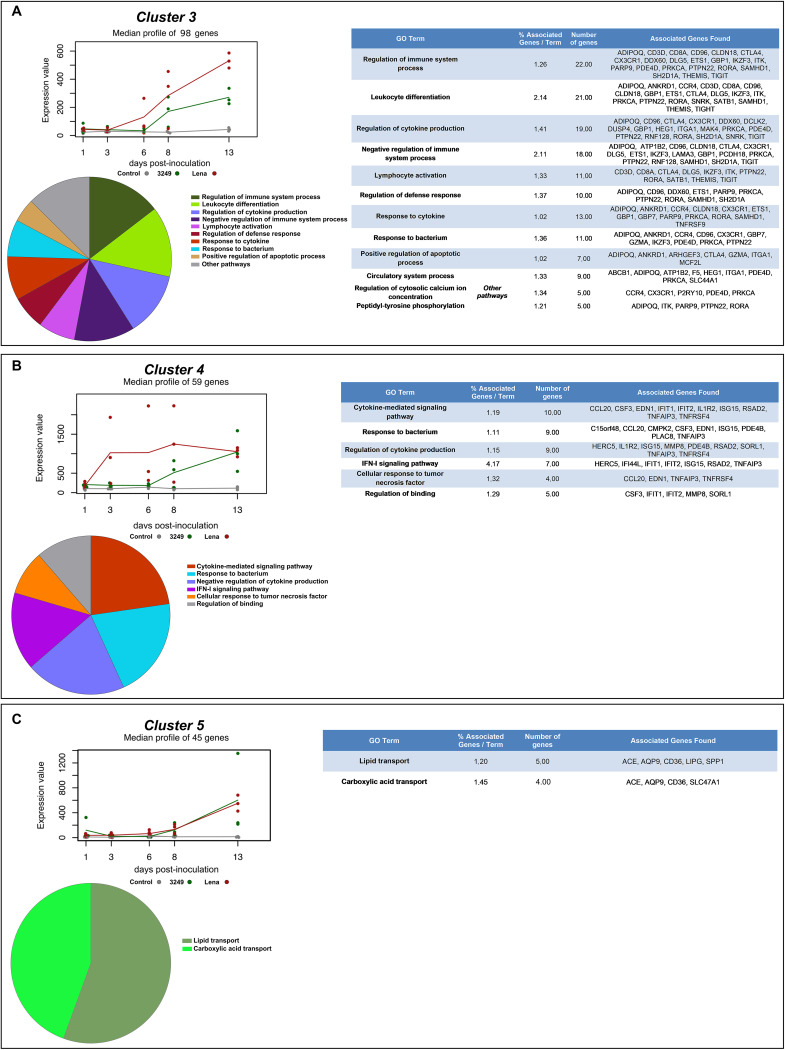
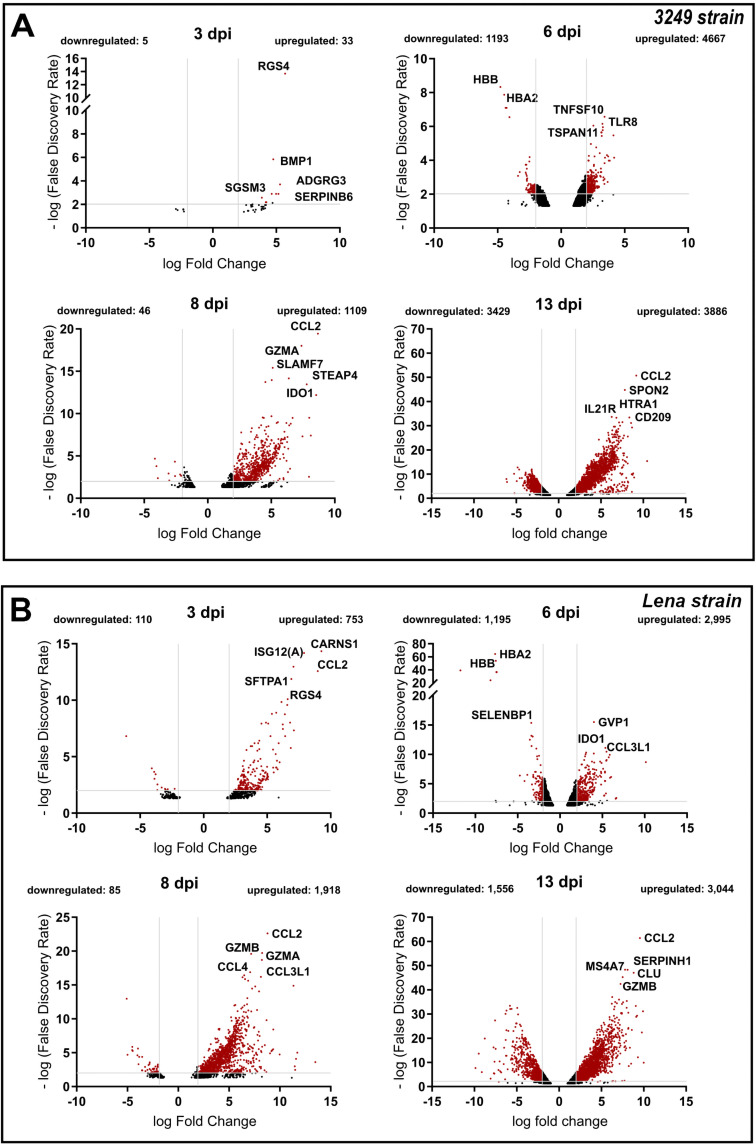
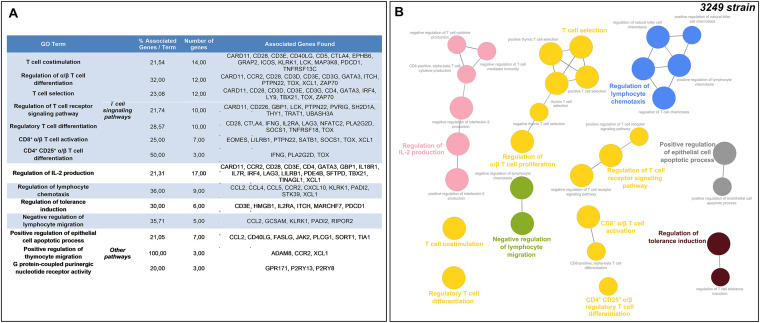
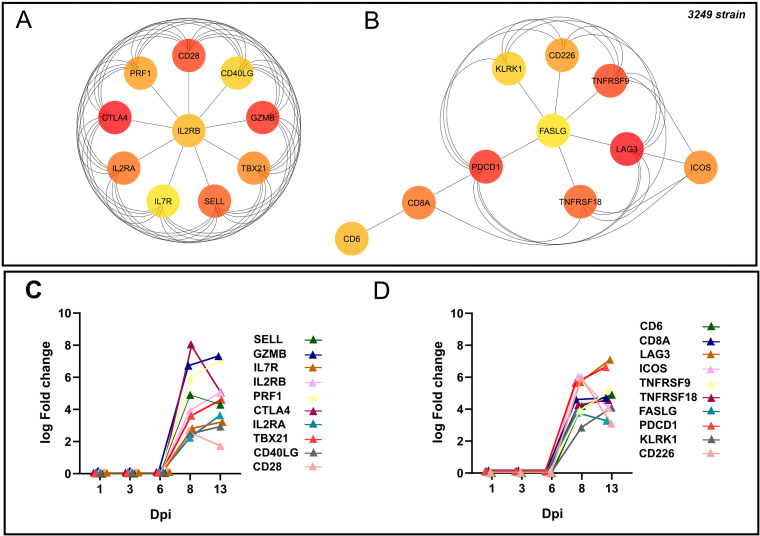
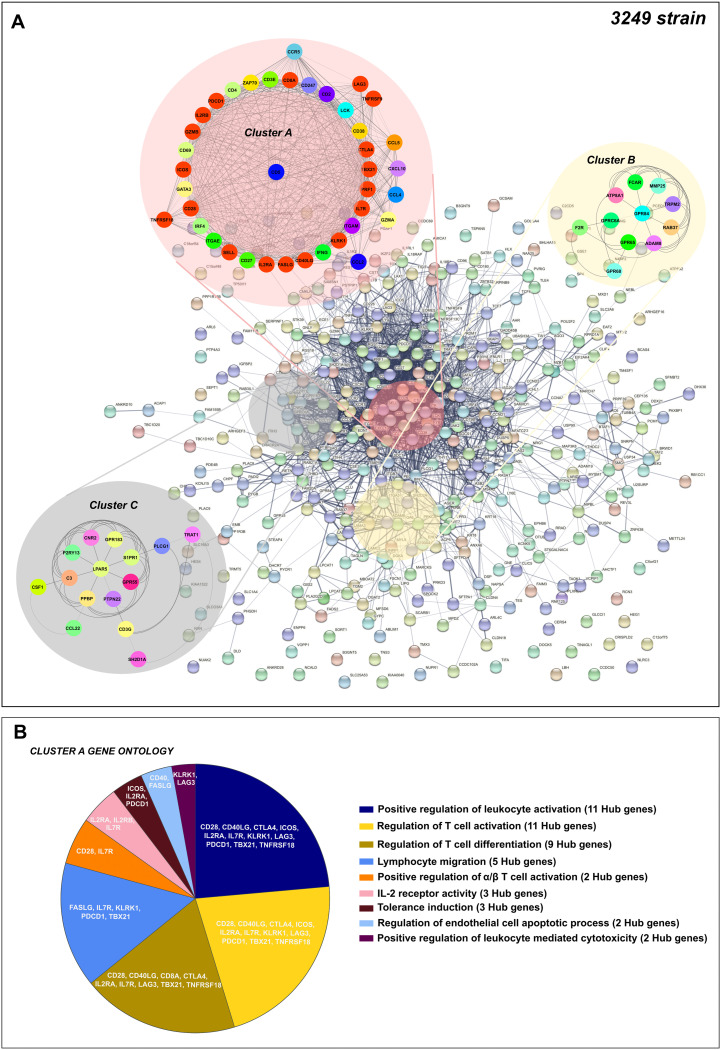
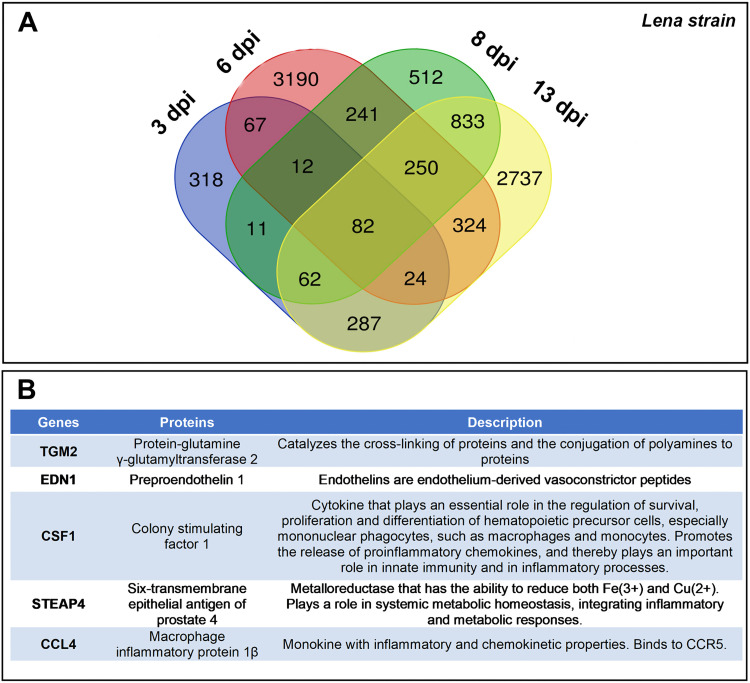
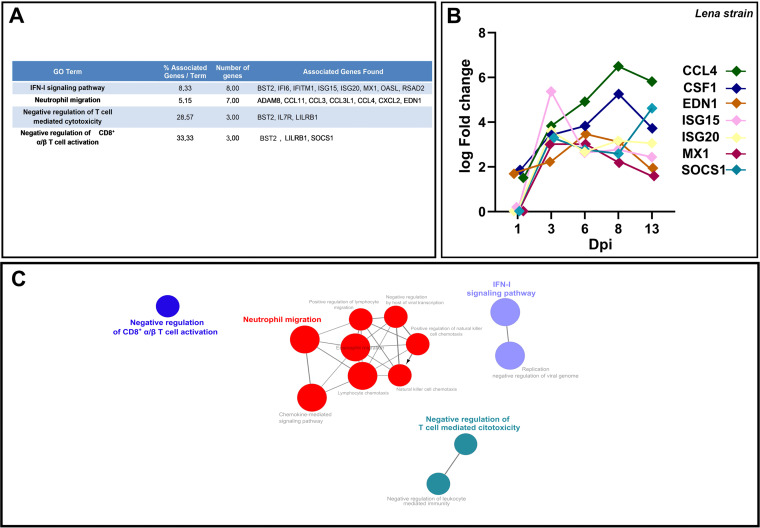
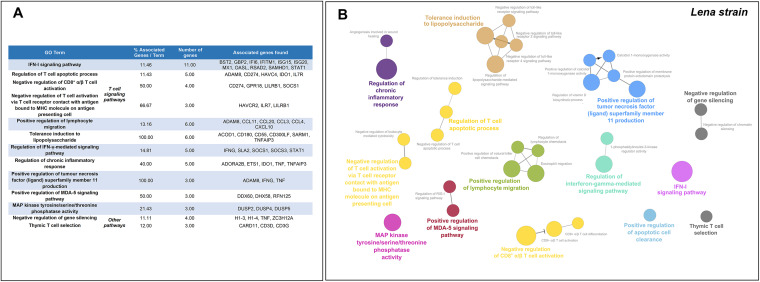
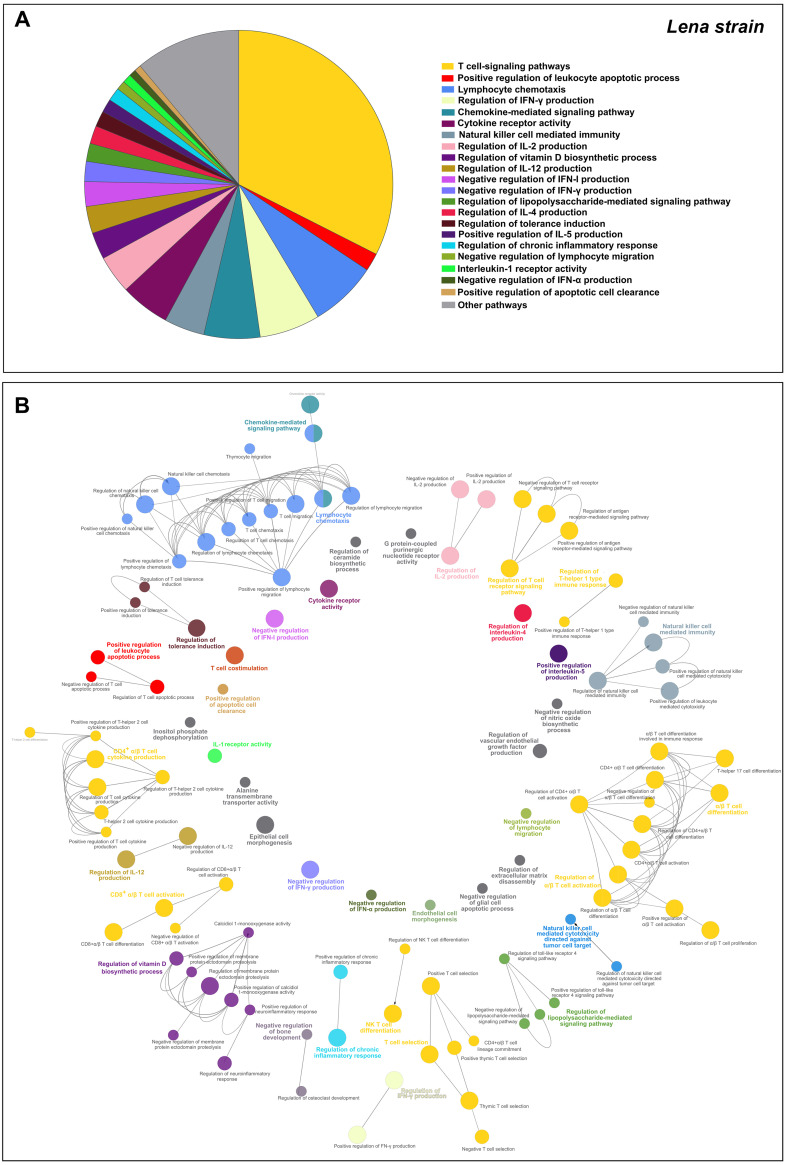
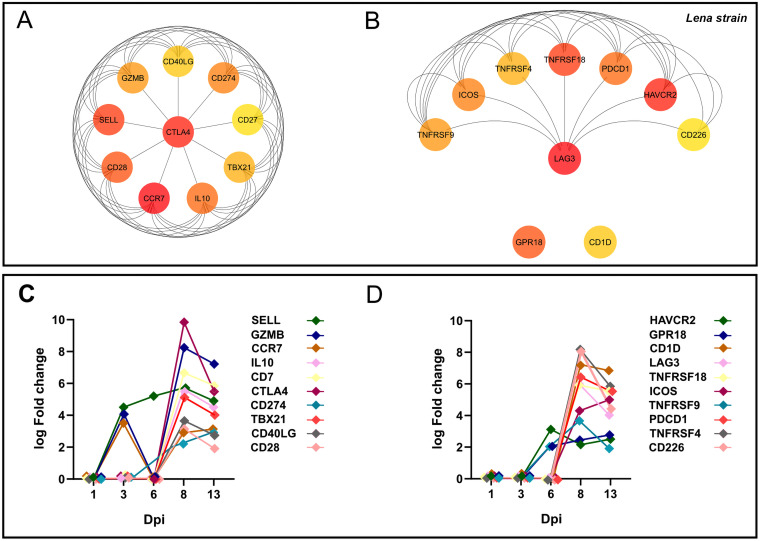
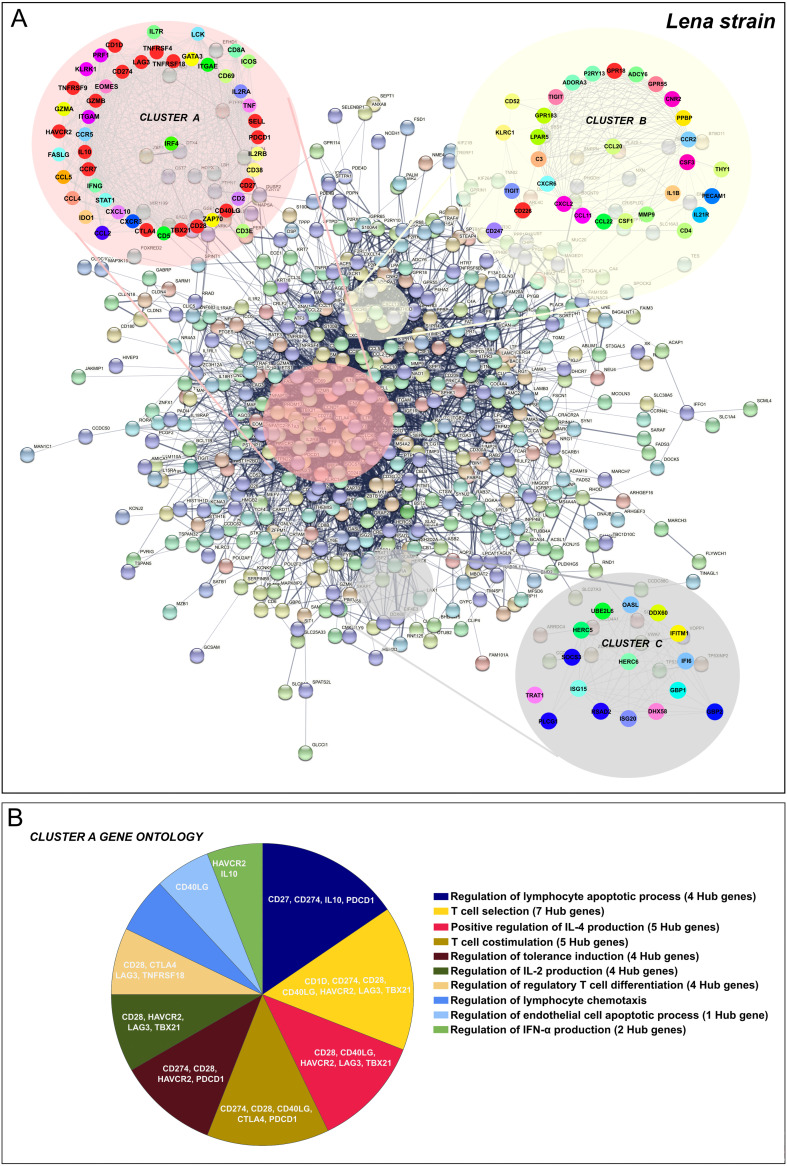
Porcine reproductive and respiratory syndrome virus (PRRSV) has evolved to escape the immune surveillance for a survival advantage leading to a strong modulation of host's immune responses and favoring secondary bacterial infections. However, limited data are available on how the immunological and transcriptional responses elicited by virulent and low-virulent PRRSV-1 strains are comparable and how they are conserved during the infection. To explore the kinetic transcriptional signature associated with the modulation of host immune response at lung level, a time-series transcriptomic analysis was performed in bronchoalveolar lavage cells upon experimental in vivo infection with two PRRSV-1 strains of different virulence, virulent subtype 3 Lena strain or the low-virulent subtype 1 3249 strain. The time-series analysis revealed overlapping patterns of dysregulated genes enriched in T-cell signaling pathways among both virulent and low-virulent strains, highlighting an upregulation of co-stimulatory and co-inhibitory immune checkpoints that were disclosed as Hub genes. On the other hand, virulent Lena infection induced an early and more marked "negative regulation of immune system process" with an overexpression of co-inhibitory receptors genes related to T-cell and NK cell functions, in association with more severe lung lesion, lung viral load, and BAL cell kinetics. These results underline a complex network of molecular mechanisms governing PRRSV-1 immunopathogenesis at lung level, revealing a pivotal role of co-inhibitory and co-stimulatory immune checkpoints in the pulmonary disease, which may have an impact on T-cell activation and related pathways. These immune checkpoints, together with the regulation of cytokine-signaling pathways, modulated in a virulence-dependent fashion, orchestrate an interplay among pro- and anti-inflammatory responses. IMPORTANCE Porcine reproductive and respiratory syndrome virus (PRRSV) is one of the major threats to swine health and global production, causing substantial economic losses. We explore the mechanisms involved in the modulation of host immune response at lung level performing a time-series transcriptomic analysis upon experimental infection with two PRRSV-1 strains of different virulence. A complex network of molecular mechanisms was revealed to control the immunopathogenesis of PRRSV-1 infection, highlighting an interplay among pro- and anti-inflammatory responses as a potential mechanism to restrict inflammation-induced lung injury. Moreover, a pivotal role of co-inhibitory and co-stimulatory immune checkpoints was evidenced, which may lead to progressive dysfunction of T cells, impairing viral clearance and leading to persistent infection, favoring as well secondary bacterial infections or viral rebound. However, further studies should be conducted to evaluate the functional role of immune checkpoints in advanced stages of PRRSV infection and explore a possible T-cell exhaustion state.

Keywords: Hub genes; T-cells; bronchoalveolar lavage cells; immune checkpoints; porcine reproductive and respiratory syndrome virus; time-series transcriptomic analysis; virulence.


Conflict of interest statement

The authors declare no conflict of interest.

Figures

FIG 1
FIG 1
PRRSV lung viral load was quantified by RT-qPCR (A). Viral load is represented by changes in the quantification cycle (Cq) (control, gray circles; 3249, green triangles; Lena, red diamonds). Frequency of live CD163+ PAMs (B). Freshly isolated BAL cells from control and PRRSV-1-infected pigs were stained and analyzed for the expression of CD163 by FCM. The scatter dot plot shows the frequency of CD163+ cells in control, 3249, and Lena group along the experimental infection. Changes in BAL cells subpopulation by FCM (FSC-A versus SSC-A) according to histopathological findings from a representative pig of the control, 3249, and Lena infected group at 1, 6, and 13 dpi (C). Red circles indicate living potential PAMs according to light scatter properties (size and granularity). Red arrows show the decrease of the above-mentioned subset in 3249- and Lena-infected pigs. Green circles indicate a mixture of neutrophils, monocytes, and, to a lesser extent, lymphocytes, according to light scatter properties. Microscopic pictures for each representative animal at 13 dpi supporting FCM findings. Bars, 20 μm. Statistical differences between groups are indicated (*, P < 0.05; **, P < 0.01).
FIG 2
FIG 2
MaSigPro analysis of RNA-seq time-series data set. Clusters 3 (A), 4 (B), and 5 (C) showed distinct temporal profiles associated with low-virulent 3249 and virulent Lena strain infection. The median expression of all genes in each cluster was plotted for control (gray), 3249 (green), and Lena strain (red) along the different time points. Solid lines depicting the median and solid plots show the individual value. Gene Ontology (GO) analysis of clusters 3 (A), 4 (B), and 5 (C). ClueGO and CluePedia were used to conduct a functional enrichment analysis. Tables list the top terms of GO biological processes (BPs) and immune system processes (ISPs) associated with genes grouped in each cluster over time. Overview pie chart shows the proportion of genes associated with the top functional groups.
FIG 3
FIG 3
DEGs in 3249- (A) and Lena-infected (B) piglets MLN compared to non-infected control piglets. Volcano plots illustrate DEGs in 3249- (A) and Lena-infected (B) piglets to non-infected control piglets at different time points (3, 6, 8, and 13 dpi). Red dots show DEGs with an FDR<0.05 and an absolute log2 fold change ≥ 1, underlining the top 5 DEGs with a higher fold change. Because of the low number of DEGs not data was showed at 1 dpi.
FIG 4
FIG 4
Venn diagram displaying the distribution of DEGs in low-virulent 3249-infected piglets at each time point (A). Gene ontology (GO) analysis of 96 overlapped DEGs in response to 3249 strain infection at 6–8–13 dpi. Table lists the top terms of GO biological processes (BPs) and immune system processes (ISPs) enriched with 96 overlapped DEGs (B). Pattern of expression of representative genes (CCL2, CCR5, EDN1, GBP1, GBP7, JAK2) for the most relevant pathways (C). Functional network of BPs and ISPs pathways for the module were visualized in Cytoscape with ClueGo and CluePedia (D). Only the statistically significant terms (FDR<0.05) in each group are represented. Terms are displayed as nodes (filled circle) linked by edges (lines) based on their kappa value (≥ 0.4), where only the label of the most significant term per group is shown.
FIG 5
FIG 5
Gene Ontology (GO) analysis of 854 overlapped DEGs in response to 3249 strain infection at 8–13 dpi. Table lists the top terms of GO biological processes (BPs) and immune system processes (ISPs) enriched with 854 overlapped DEGs (A). Functional network of BPs and ISPs pathways for the module were visualized in Cytoscape with ClueGo and CluePedia (B). Only the statistically significant terms (FDR<0.05) in each group are represented. Terms are displayed as nodes (filled circle) linked by edges (lines) based on their kappa value (≥ 0.4), where only the label of the most significant term per group is shown.
FIG 6
FIG 6
Hub genes network for low-virulent 3249 strain. Hub genes for 3249 strain were disclosed according to Maximal Clique Centrality (MCC) (A), and Density of Maximum Neighborhood Component (DMNC) (B) algorithms were identified from the whole PPI network. Kinetic of expression of Hub genes for 3249 strain along the infection (C and D). The fold change for each Hub gene was illustrated as the median of the group at 1, 3, 6, 8, and 13 dpi.
FIG 7
FIG 7
PPI network of 854 overlapped DEGs in response to 3249 strain infection at 8–13 dpi (A). Network was constructed by STRING database and visualized by Cytoscape, underlining the significant clusters A, B, and C (κ-core > 6), which were identified by means of MCODE. The genes calculated by Maximal Clique Centrality (MCC) and Density of Maximum Neighborhood Component (DMNC) algorithms were selected as Hub genes (genes with the highest degree of connectivity) by CytoHubba plugin in Cytoscape. Most of the Hub genes (red color) were included in cluster 1. GO enrichment analysis (biological processes, BPs, and immune system processes, ISPs, categories) of DEGs included within cluster A (B). Overview pie chart shows the proportion of genes associated with the top functional groups, indicating the name of Hub genes in each term. Table 1 lists the top terms of GO (BPs and ISPs).
FIG 8
FIG 8
Table lists 5 upregulated DEGs conserved in response to virulent Lena infection at 1–3–6–8–13 dpi (A). Venn diagram displaying the distribution of DEGs in virulent Lena-infected piglets at each time point (B).
FIG 9
FIG 9
Gene Ontology (GO) analysis of 82 overlapped DEGs in response to Lena strain infection at 3–6–8–13 dpi. Table lists the top terms of GO biological processes (BPs) and immune system processes (ISPs) enriched with 82 overlapped DEGs (A). Pattern of expression of representative genes (CCL4, CSF1, EDN1, ISG15, ISG20, MX1, SOCS1) for the most relevant pathways (B). Functional network of BPs and ISPs pathways for the module were visualized in Cytoscape with ClueGo and CluePedia (C). Only the statistically significant terms (FDR<0.05) in each group are represented. Terms are displayed as nodes (filled circle) linked by edges (lines) based on their kappa value (≥ 0.4), where only the label of the most significant term per group is shown.
FIG 10
FIG 10
Gene Ontology (GO) analysis of 332 overlapped DEGs in response to Lena strain infection at 6–8–13 dpi. Table lists the top terms of GO biological processes (BPs) and immune system processes (ISPs) enriched with 332 overlapped DEGs (A). Functional network of BPs and ISPs pathways for the module was visualized in Cytoscape with ClueGo and CluePedia (B). Only the statistically significant terms (FDR<0.05) in each group are represented. Terms are displayed as nodes (filled circle) linked by edges (lines) based on their kappa value (≥ 0.4), where only the label of the most significant term per group is shown.
FIG 11
FIG 11
Gene Ontology (GO) analysis of 1,227 overlapped DEGs in response to Lena strain infection at 8–13 dpi. Overview pie chart illustrates the top terms of GO biological processes (BPs) and immune system processes (ISPs) enriched with 1,227 overlapped DEGs, indicating the proportion of genes associated with each term (A). Functional network of BPs and ISPs pathways for the module were visualized in Cytoscape with ClueGo and CluePedia (B). Only the statistically significant terms (FDR<0.05) in each group are represented. Terms are displayed as nodes (filled circle) linked by edges (lines) based on their kappa value (≥ 0.4), where only the label of the most significant term per group is shown. Table 2 lists the top terms of GO (BPs and ISPs).
FIG 12
FIG 12
Hub genes network for virulent Lena strain. Hub genes for Lena strain were disclosed according to Maximal Clique Centrality (MCC) (A), and Density of Maximum Neighborhood Component (DMNC) (B) algorithms were identified from the whole PPI network. Kinetic of expression of Hub genes for Lena strain along the infection (C and D). The fold change for each Hub gene was illustrated as the median of the group at 1, 3, 6, 8, and 13 dpi.
FIG 13
FIG 13
PPI network of 1,227 overlapped DEGs in response to Lena strain infection at 8–13 dpi (A). Network was constructed by STRING database and visualized by Cytoscape, underlining the significant clusters A, B, and C (k-core > 6), which were identified by means of MCODE. The genes calculated by Maximal Clique Centrality (MCC) and Density of Maximum Neighborhood Component (DMNC) algorithms were selected as Hub genes (genes with the highest degree of connectivity) by CytoHubba plugin in Cytoscape. Most of the Hub genes (red color) were included in cluster A. GO enrichment analysis (BPs and ISPs categories) of DEGs included within cluster A (B). Overview pie chart showing the proportion of genes associated with the top functional groups, indicating the name of Hub genes in each term. Table 3 lists the top terms of GO (BPs and ISPs).

Similar articles

Cited by

References

    1. Nathues H, Alarcon P, Rushton J, Jolie R, Fiebig K, Jimenez M, Geurts V, Nathues C. 2017. Cost of porcine reproductive and respiratory syndrome virus at individual farm level—An economic disease model. Prev Vet Med 142:16–29. 10.1016/j.prevetmed.2017.04.006. - DOI - PubMed
    1. Holtkamp DJ, Kliebenstein JB, Neumann EJ, Zimmerman JJ, Rotto HF, Yoder TK, Wang C, Yeske PE, Mowrer CL, Haley CA. 2013. Assessment of the economic impact of porcine reproductive and respiratory syndrome virus on United States pork producers. J Swine Heal Prod 21:72–84.
    1. Meulenberg JJM, Hulst MM, De Meijer EJ, Moonen PLJM, Den Besten A, De Kluyver EP, Wensvoort G, Moormann RJM. 1993. Lelystad virus, the causative agent of porcine epidemic abortion and respiratory syndrome (PEARS), is related to LDV and EAV. Virology 192:62–72. 10.1006/viro.1993.1008. - DOI - PMC - PubMed
    1. Wensvoort G, Terpstra C, Pol JM, ter Laak EA, Bloemraad M, de Kluyver EP, Kragten C, van Buiten L, den Besten A, Wagenaar F. 1991. Mystery swine disease in The Netherlands: the isolation of Lelystad virus. Vet Q 13:121–130. 10.1080/01652176.1991.9694296. - DOI - PubMed
    1. Brinton MA, Gulyaeva A, Balasuriya UBR, Dunowska M, Faaberg KS, Goldberg T, Leung FC, Nauwynck HJ, Snijder EJ, Stadejek T, Gorbalenya AE. 2018. Proposal 2017.012S.A.v1. Expansion of the rank structure of the family Arteriviridae and renaming its taxa. https://talk.ictvonline.org/ICTV/proposals/2017.001S.012-017S.R.Nidovira.... Accessed 15 October 2021.

Publication types

MeSH terms

LinkOut - more resources