. 2021 Dec;129(12):127001.
doi: 10.1289/EHP9262. Epub 2021 Dec 1.

Effects of Dicyclohexyl Phthalate Exposure on PXR Activation and Lipid Homeostasis in Mice

Affiliations

Effects of Dicyclohexyl Phthalate Exposure on PXR Activation and Lipid Homeostasis in Mice

Yipeng Sui et al. Environ Health Perspect. 2021 Dec.

Abstract

Background: Exposure to plastic-associated endocrine disrupting chemicals (EDCs) has been associated with an increased risk of cardiovascular disease (CVD) in humans. However, the underlying mechanisms for this association are unclear. Many EDCs have been shown to function as ligands of the nuclear receptor pregnane X receptor (PXR), which functions as xenobiotic sensor but also has pro-atherogenic effects in vivo.

Objective: We sought to investigate the contribution of PXR to the adverse effects dicyclohexyl phthalate (DCHP), a widely used phthalate plasticizer, on lipid homeostasis and CVD risk factors.

Methods: Cell-based assays, primary organoid cultures, and PXR conditional knockout and PXR-humanized mouse models were used to investigate the impact of DCHP exposure on PXR activation and lipid homeostasis in vitro and in vivo. Targeted lipidomics were performed to measure circulating ceramides, novel predictors for CVD.

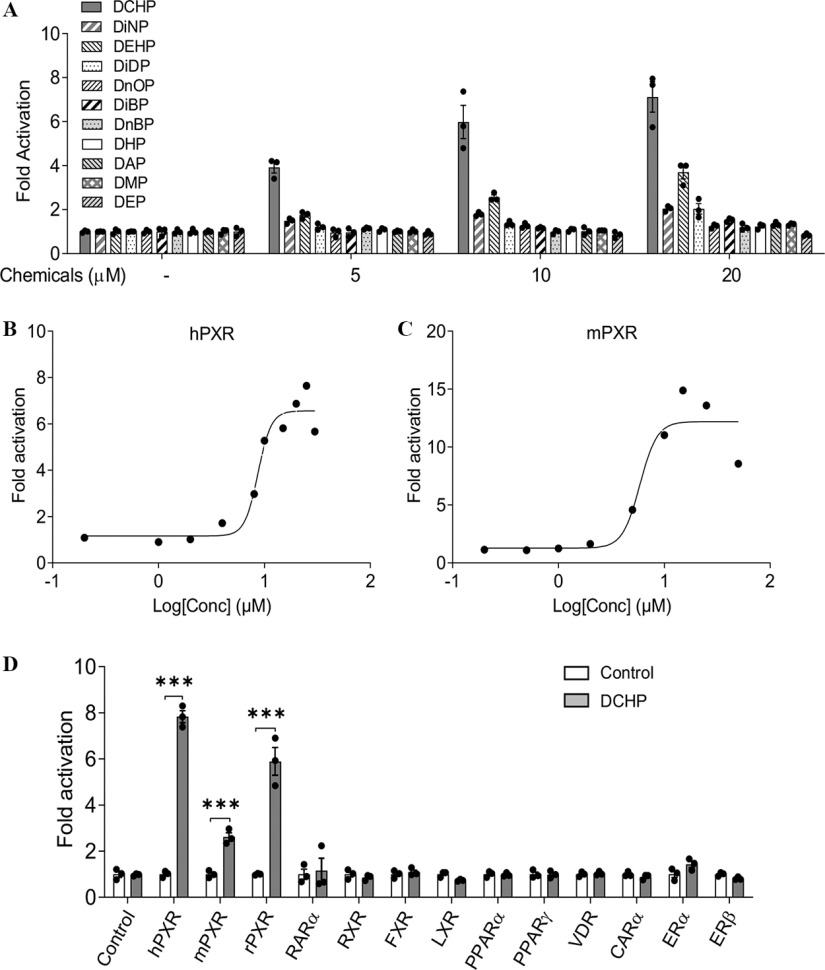
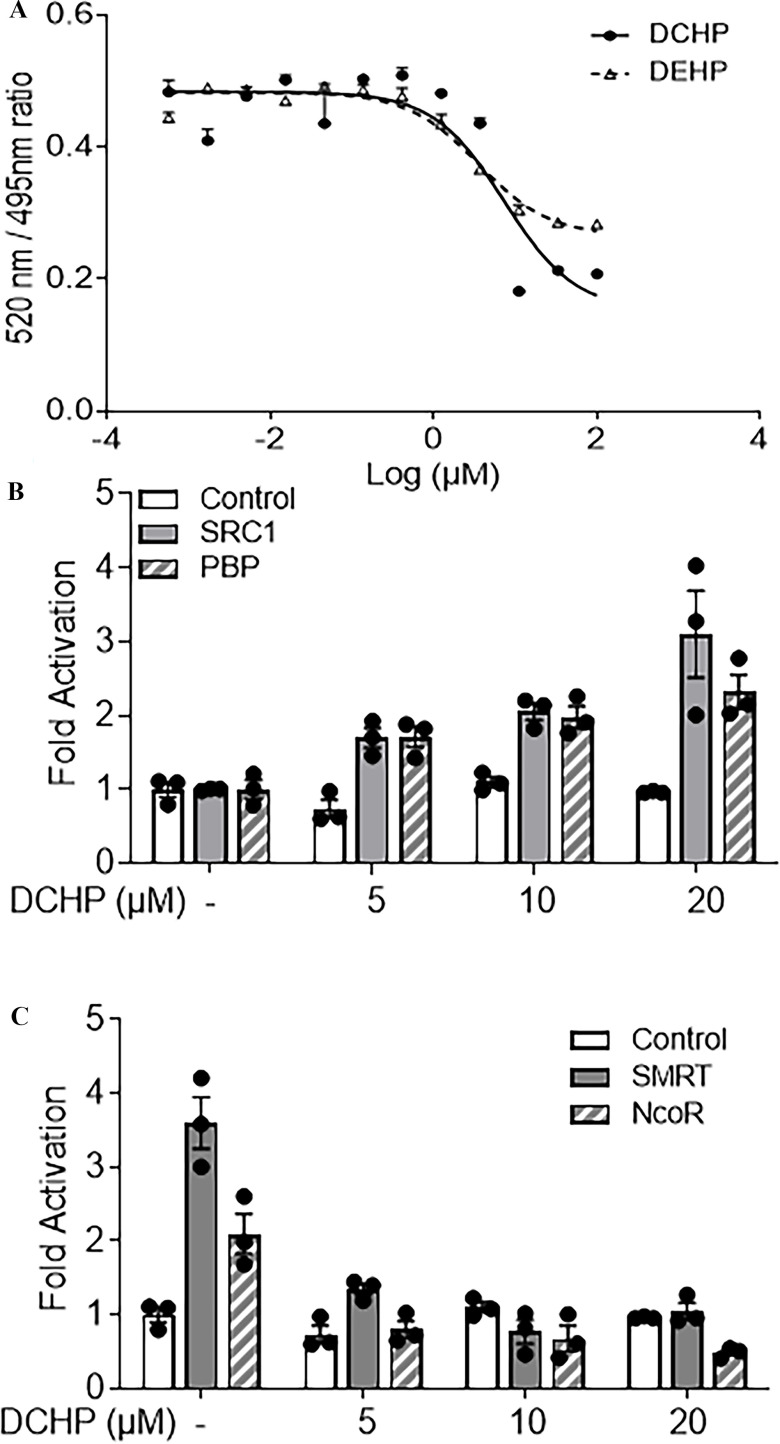
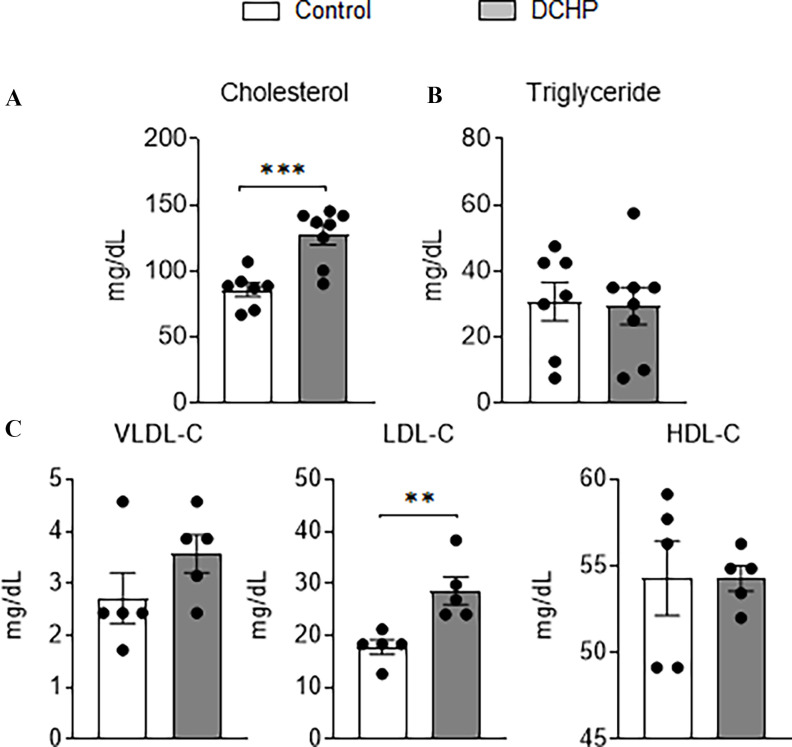
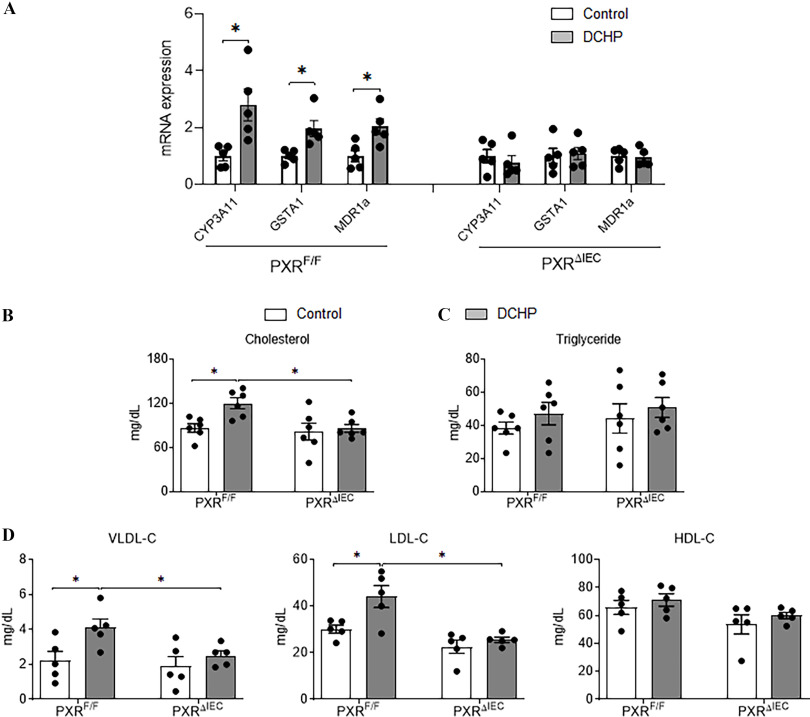
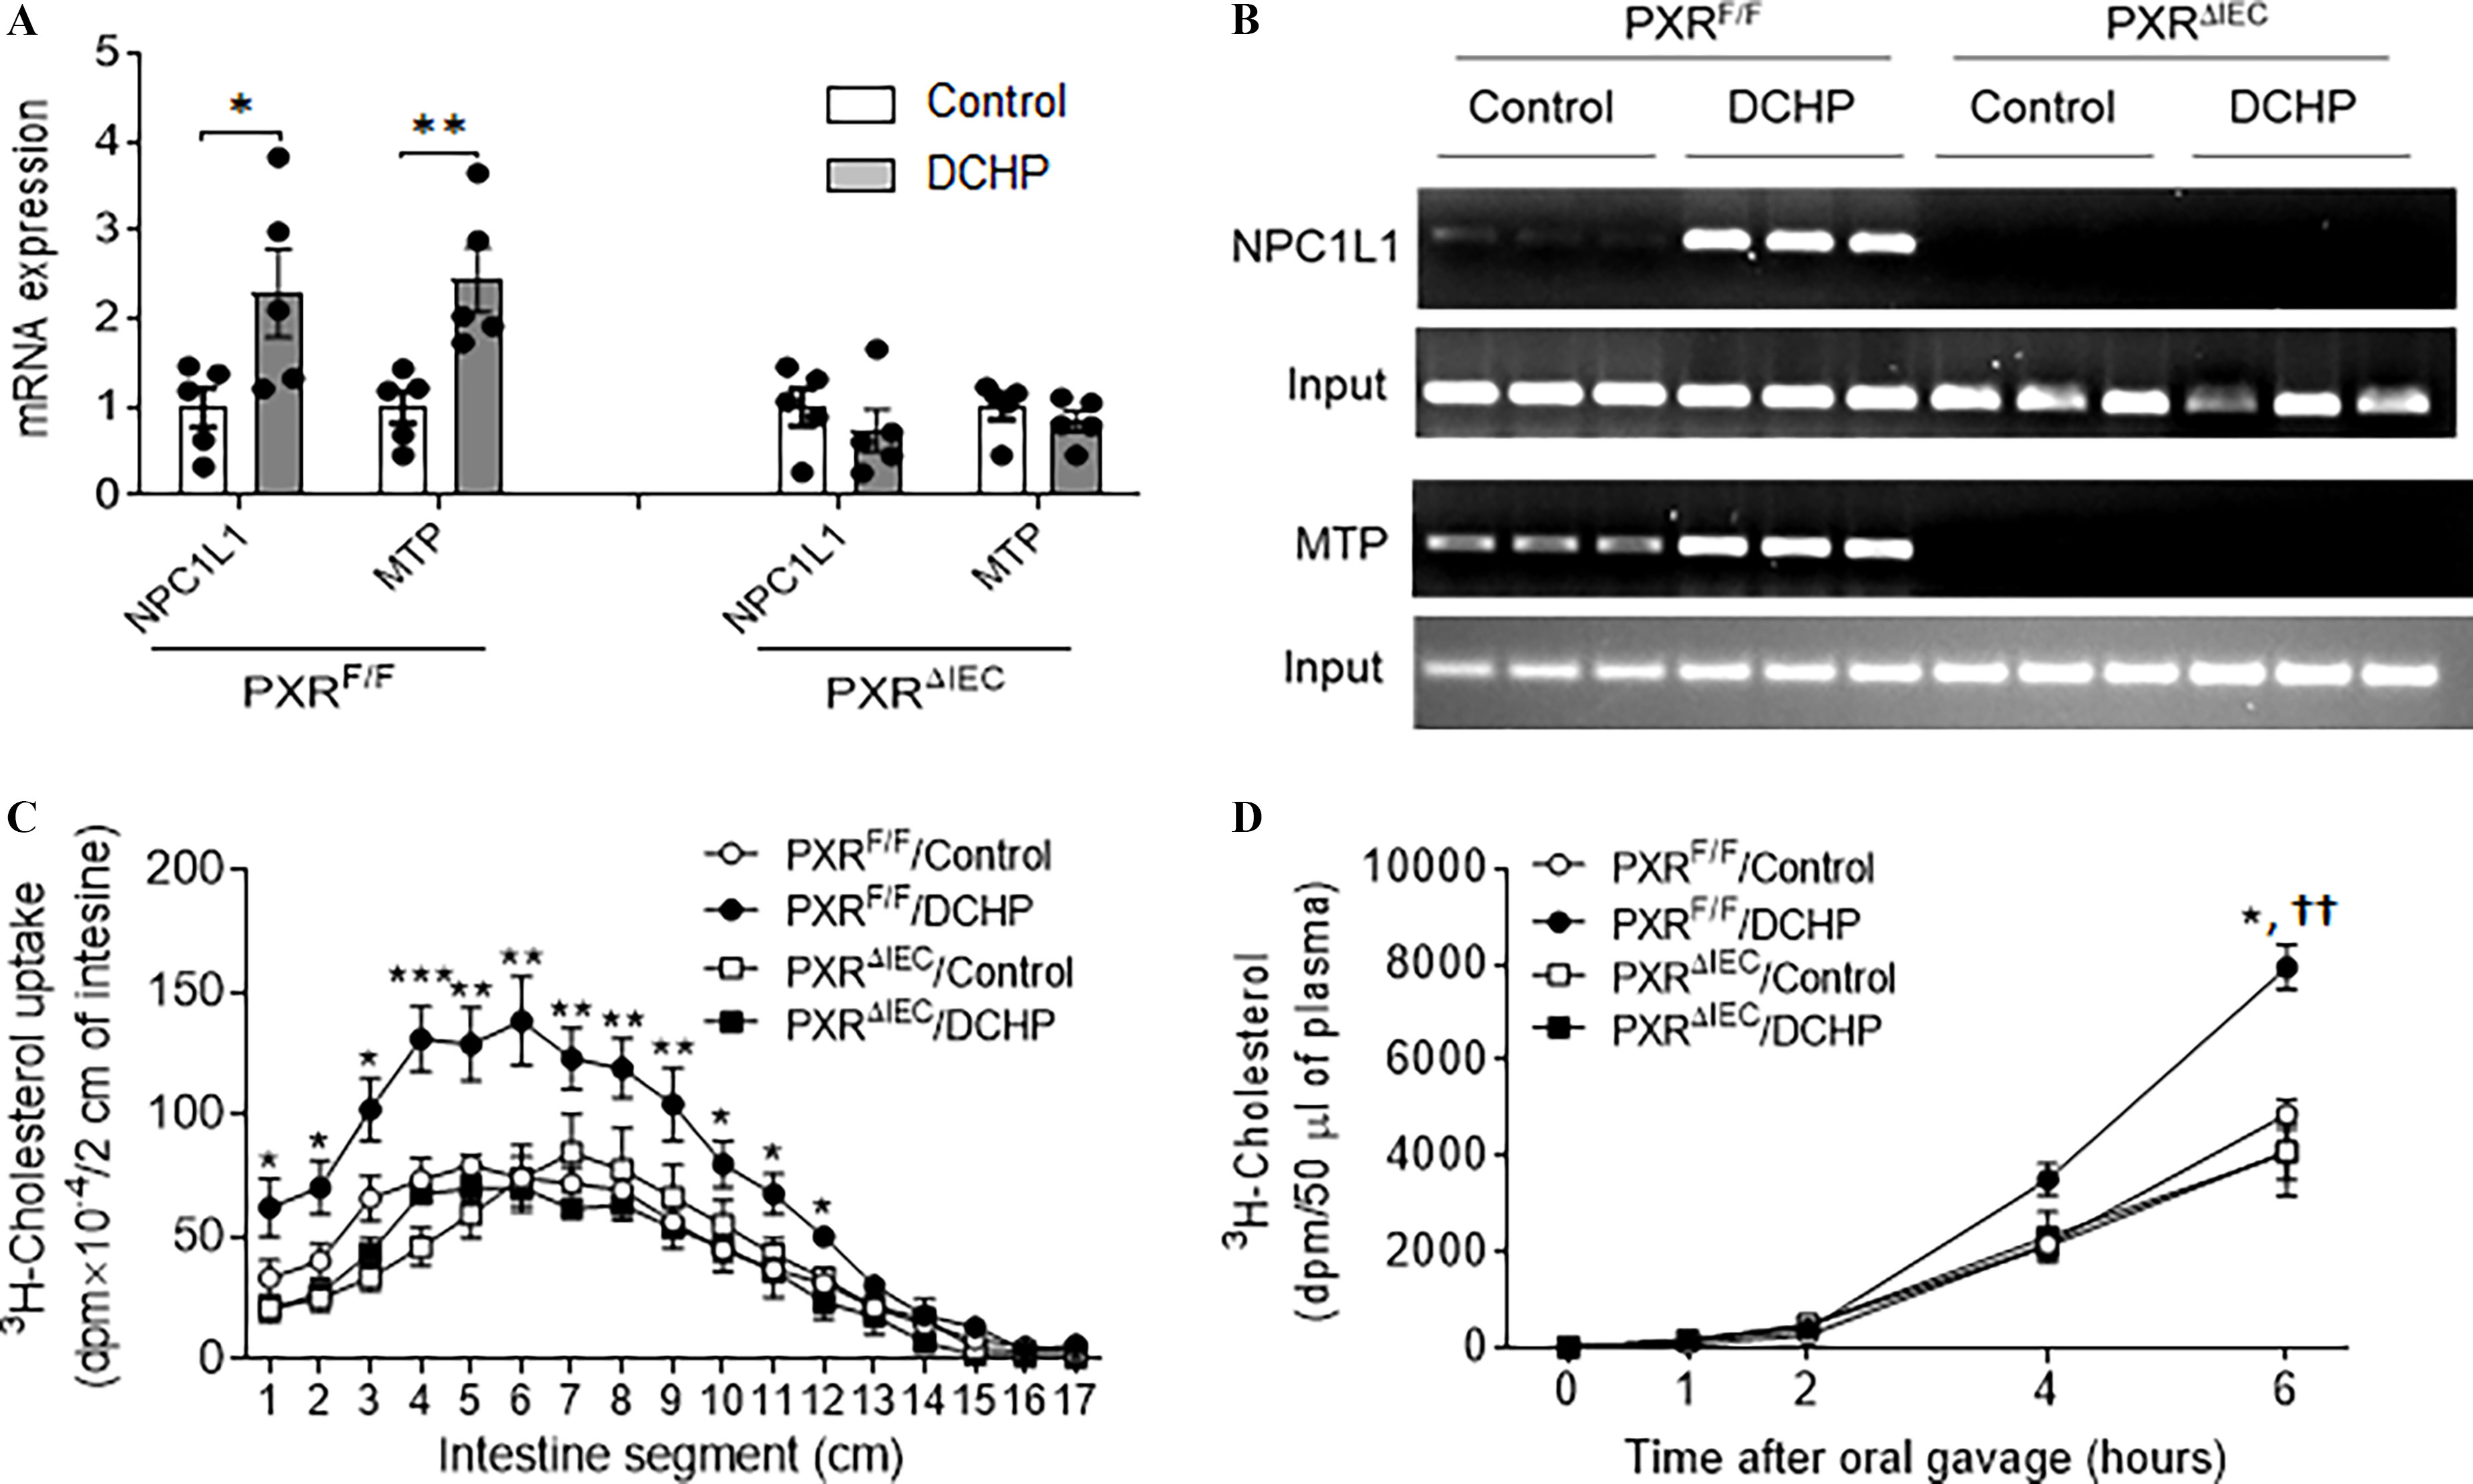
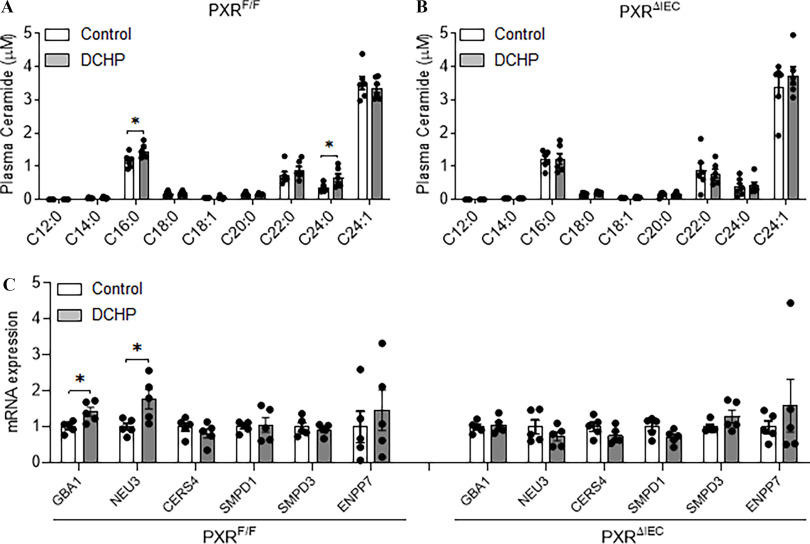
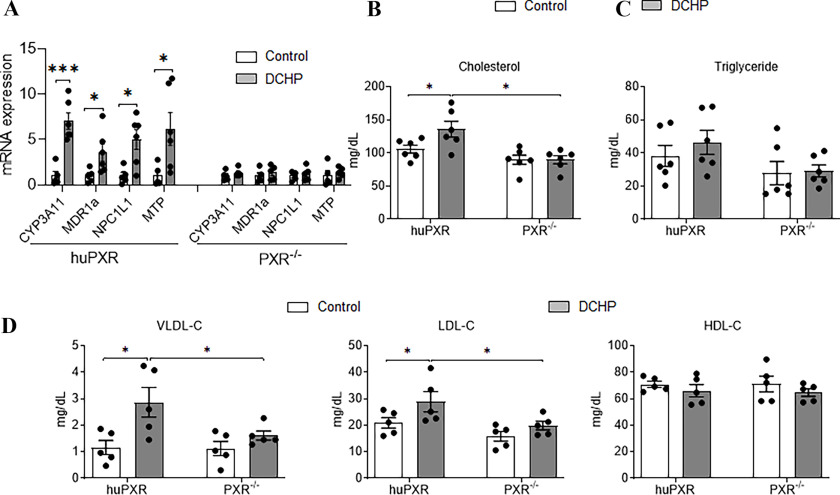
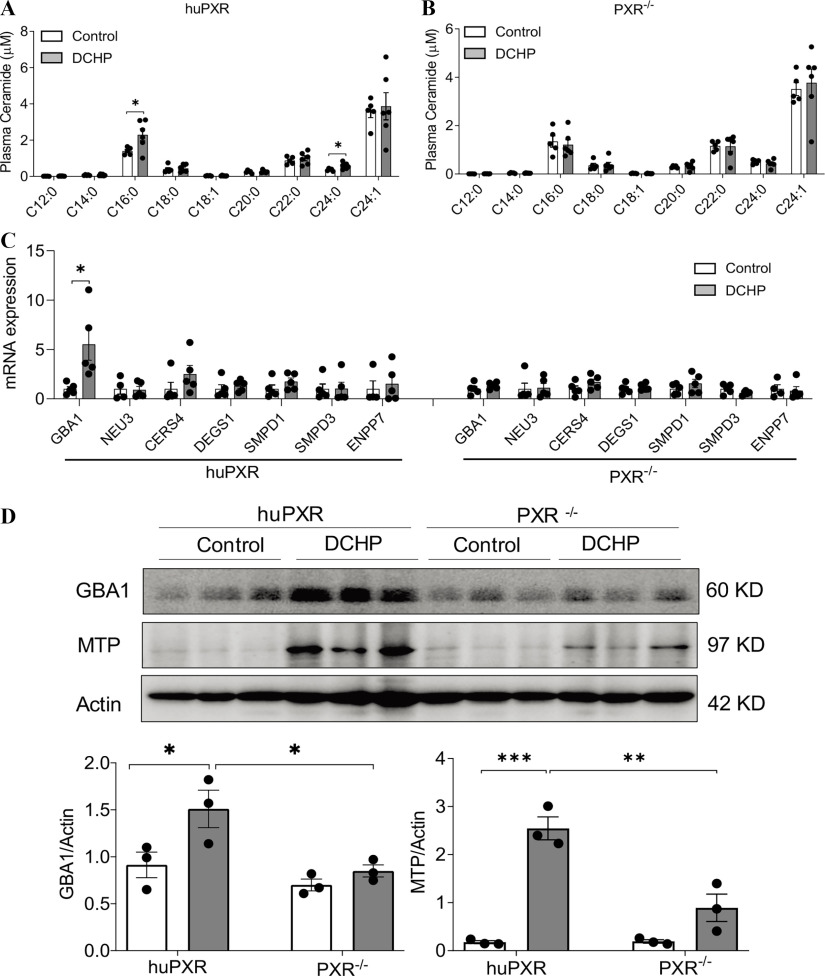
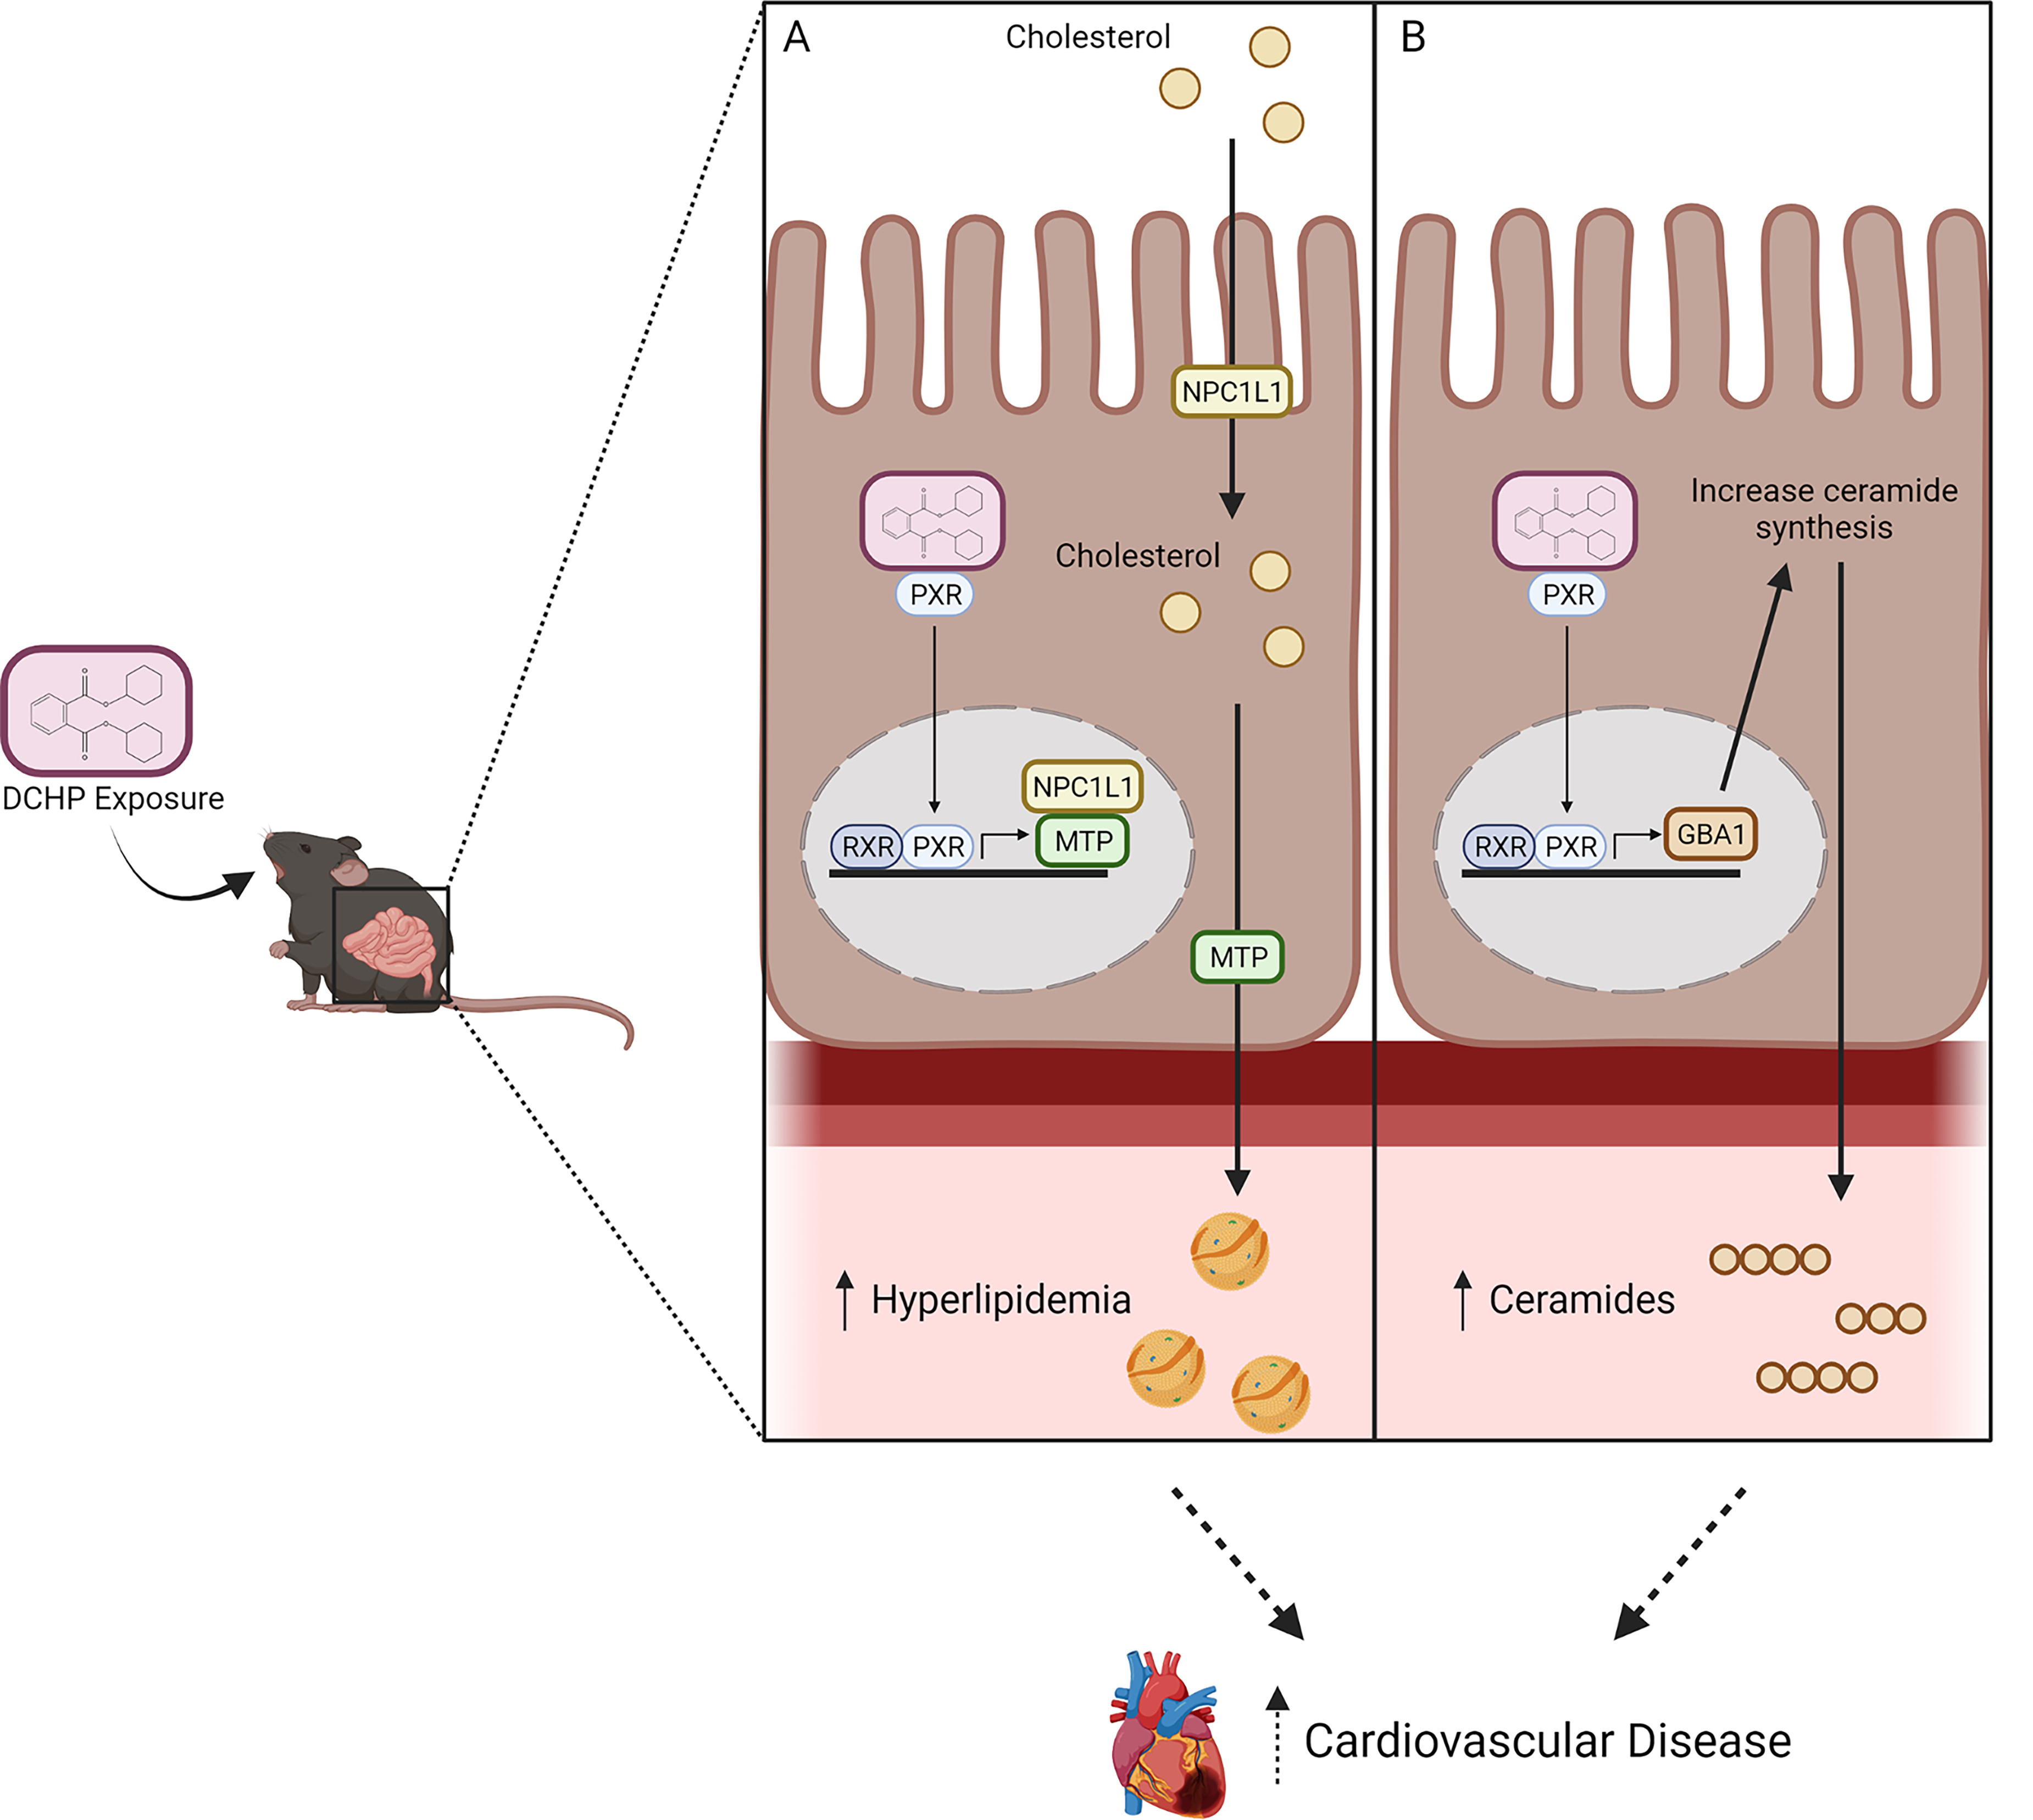
Results: DCHP was identified as a potent PXR-selective agonist that led to higher plasma cholesterol levels in wild-type mice. DCHP was then demonstrated to activate intestinal PXR to elicit hyperlipidemia by using tissue-specific PXR-deficient mice. Interestingly, DCHP exposure also led to higher circulating ceramides in a PXR-dependent manner. DCHP-mediated PXR activation stimulated the expression of intestinal genes mediating lipogenesis and ceramide synthesis. Given that PXR exhibits considerable species-specific differences in receptor pharmacology, PXR-humanized mice were also used to replicate these findings.

Discussion: Although the adverse health effects of several well-known phthalates have attracted considerable attention, little is known about the potential impact of DCHP on human health. Our studies demonstrate that DCHP activated PXR to induce hypercholesterolemia and ceramide production in mice. These results indicate a potentially important role of PXR in contributing to the deleterious effects of plastic-associated EDCs on cardiovascular health in humans. Testing PXR activation should be considered for risk assessment of phthalates and other EDCs. https://doi.org/10.1289/EHP9262.


Figures

Figure 1A is a set of four bar graphs, plotting fold activation, ranging from 0 to 10 in increments of 2 (y-axis) across chemicals (micromolar), ranging as 0, 5, 10, and 20 (x-axis) for Dicyclohexyl phthalate, Diisononyl phthalate, Di(2-ethylhexyl) phthalate, Diisodecyl phthalate, Di-n-butyl phthalate, Di-n-octyl phthalate, Diisobutyl phthalate, Di-n-butyl phthalate, Dihexyl phthalate, Diallyl phthalate, Dimethyl phthalate, and Diethyl phthalate. Figures 1B and 1C are line graphs, plotting fold activation, ranging from 0 to 10 in increments of 2 and 0 to 20 in increments of 5 (y-axis) across log (concentration) (micromolar), ranging from negative 1 to 2 in unit increments (x-axis) for human pregnane X receptor and mouse pregnane X receptor, respectively. Figure 1D is a clustered bar graph, plotting fold activation, ranging from 0 to 10 in increments of 2 (y-axis) across control, human pregnane X receptor, mouse pregnane X receptor, rat pregnane X receptor, Retinoic acid receptor lowercase alpha, Retinoid X receptor, Farnesyl X Receptor, Liver X receptor, Peroxisome proliferator-activated receptor lowercase alpha, vitamin D receptor, constitutive androstane receptor, estrogen receptor lowercase alpha, and estrogen receptor lowercase beta (x-axis) for control and Dicyclohexyl phthalate.
Figure 1.
The effects of DCHP on PXR activity in cell-based transfection assays. (A) Human LS180 intestinal cells were transfected with a full-length hPXR plasmid, hPXR reporter (CYP3A4-luciferase), and CMX-β-galactosidase (β-gal) control plasmid. Cells were treated with various phthalates at the indicated concentrations for 24 h (n=3). (B,C) LS180 cells were transfected with (B) hPXR and CYP3A4-luciferase reporter together with CMX-β-galactosidase plasmid or (C) mPXR and (CYP3A2)3-luciferase reporter together with CMX-β-galactosidase plasmid. After transfection, LS180 cells were then treated with DCHP at the indicated concentrations for 24 h (n=3). (D) LS180 cells were transfected with GAL4 plasmids in which the GAL4 DNA-binding domain is linked to the indicated nuclear receptor ligand-binding domain and a GAL4 reporter. After transfection, LS180 cells were treated with DMSO control or 10μM DCHP for 24 h (n=3, two-sample, two-tailed Student’s t-test, ***, p<0.001 compared with the control group). Reporter gene activity was normalized to the β-gal transfection controls, and the results were normalized to relative light units per OD595 β-gal per minute to facilitate comparisons between plates. Fold activation was calculated relative to vehicle DMSO controls. Mean fold activation is shown. Error bars represent±SEM. The numerical data corresponding to this figure are shown in Tables S2–S5. Note: β-gal, beta galactosidase; CARα, constitutive androstane receptor; DAP, diallyl phthalate; DCHP, dicyclohexyl phthalate; DEHP, di(2-ethylhexyl) phthalate; DEP, diethyl phthalate; DHP, dihexyl phthalate; DiBP, diisobutyl phthalate; DiDP, diisodecyl phthalate; DiNP, diisononyl phthalate; DMP, dimethyl phthalate; DMSO, dimethyl sulfoxide; DnBP, di-n-butyl phthalate; DnOP, di-n-octyl phthalate; ERα, estrogen receptor alpha; ERβ, estrogen receptor beta; FXR, farnesyl X Receptor; hPXR, human pregnane X receptor; LXR, liver X receptor; mPXR, mouse pregnane X receptor; OD, optical density; PPARα, peroxisome proliferator-activated receptor alpha; PXR, pregnane X receptor; RARα, retinoic acid receptor alpha; rPXR, rat pregnane X receptor; RXR, retinoid X receptor; SEM, standard error of the mean; VDR, vitamin D receptor.
Figure 2A is a line graph, plotting 520 nanometers to 495 nanometers ratio, ranging from 0.0 to 0.6 in increments of 0.2 (y-axis) across log of (micromolar), ranging from negative 4 to 4 in increments of 2 (x-axis) for Dicyclohexyl phthalate and Di(2-ethylhexyl) phthalate. Figures 2B and 2C are clustered bar graphs, plotting fold activation, ranging from 0 to 5 in unit increments (y-axis) across Dicyclohexyl phthalate (micromolar), ranging from 0 to 10 in increments of 5 and 10 to 20 in increments of 10 (x-axis) for control, Steroid receptor co-activator-1, and Peroxisome proliferator-activated receptor binding protein, and Control, silencing mediator of retinoid and thyroid hormone receptors, and nuclear receptor corepressor, respectively.
Figure 2.
Binding of DCHP to PXR ligand-binding domain (LBD) and the impact of DCHP on PXR and co-regulator interactions. (A) Competitive ligand binding assays were performed to evaluate the inhibition of FRET between fluorescein-labeled PXR ligand and recombinant GST-PXR LBD by DCHP and DEHP. DEHP was included as a positive control. Results are presented as mean TR-FRET emission ratios based on the signal from the fluorescein emission divided by the terbium signal (n=3). Error bars represent±SEM. (B,C) Human LS180 cells were transfected with a GAL4 reporter, VP16-hPXR vector, and expression vector of GAL4 DNA-binding domain (DBD) or GAL4 DBD linked to the receptor interaction domains of (B) nuclear receptor co-activators (GAL4-SRC1 or GAL4-PBP) or (C) nuclear receptor co-repressors (GAL4-SMRT or GAL4-NCoR). After transfections, LS180 cells were treated with DMSO vehicle control or DCHP at the indicated concentrations for 24 h. Reporter gene activity was normalized to the β-gal transfection controls, and the results were normalized to relative light units per OD595 β-gal per minute to facilitate comparisons between plates (n=3). Mean fold activation was calculated relative to vehicle DMSO controls. Error bars represent±SEM. The numerical data corresponding to this figure are shown in Tables S6–S8. Note: DCHP, dicyclohexyl phthalate; DEHP, di(2-ethylhexyl) phthalate; DMSO, dimethyl sulfoxide; FRET, fluorescence resonance energy transfer; GAL4, galactose-responsive transcription factor; GST, glutathione S-transferase; NCoR, nuclear receptor co-repressor; OD, optical density; PBP, peroxisome proliferator-activated receptor binding protein; PXR, pregnane X receptor; SEM, standard error of the mean; SMRT, silencing mediator of retinoid and thyroid hormone receptors; SRC-1, Steroid receptor co-activator-1; TR-FRET, time-resolved measurement of fluorescence resonance energy transfer.
Figures 3A and 3B are bar graphs titled Cholesterol and Triglyceride, plotting milligram per deciliter, ranging from 0 to 200 in increments of 50 and 0 to 80 in increments of 20 (y-axis) for control and Dicyclohexyl phthalate (x-axis), respectively. Figure 3C is a set of three bar graphs titled Very-low-density lipoproteins-cholesterol, Low-density lipoprotein-cholesterol, and High-density lipoprotein-cholesterol, plotting milligram per deciliter, ranging from 0 to 5 in unit increments, 0 to 50 in increments of 10, and 45 to 60 in increments of 5 (y-axis) for control and Dicyclohexyl phthalate (x-axis), respectively.
Figure 3.
The effects of DCHP exposure on plasma lipid levels in wild-type (WT) mice. Eight-wk-old male WT mice were treated with vehicle control or 10mg/kg BW per day of DCHP daily by oral gavage for 7 d. Fasting plasma (A) total cholesterol and (B) triglyceride levels were measured by enzymatically colorimetric methods. (C) Lipoprotein fractions (VLDL-C, LDL-C, and HDL-C) were isolated from the plasma and the cholesterol levels of each fraction were then measured. (n=58, two-sample, two-tailed Student’s t-test, **, p<0.01, and ***, p<0.001). Results represent mean values. Error bars represent±SEM. The numerical data corresponding to this figure are shown in Table S9. Note: BW, body weight; DCHP, dicyclohexyl phthalate; HDL-C, high-density lipoprotein-cholesterol; LDL-C, low-density lipoprotein-cholesterol; SEM, standard error of the mean; VLDL-C, very-low-density lipoprotein-cholesterol.
Figure 4A is a set of two clustered bar graphs, plotting messenger ribonucleic acid expression, ranging from 0 to 6 in increments of 2 (y-axis) across pregnane X receptor flox mice and intestinal epithelial cell specific pregnane X receptor deficient each includes Cytochrome P450 3 A2, Glutathione S transferase alpha 1, and Multidrug resistance protein 1 a (x-axis) for control and Dicyclohexyl phthalate, respectively. Figures 4B and 4C are clustered bar graphs titled Cholesterol and Triglyceride, plotting milligram per deciliter, ranging from 0 to 180 in increments of 60 and 0 to 80 in increments of 20 (y-axis) across pregnane X receptor flox mice and intestinal epithelial cell specific pregnane X receptor deficient (x-axis) for control and Dicyclohexyl phthalate, respectively. Figure 4D is a set of three clustered bar graphs titled Very-low-density lipoproteins-cholesterol, Low-density lipoprotein-cholesterol, and High-density lipoprotein-cholesterol, plotting milligram per deciliter, ranging from 0 to 8 in increments of 2, 0 to 60 in increments of 20, and 0 to 100 in increments of 20 (y-axis) across pregnane X receptor flox mice and intestinal epithelial cell specific pregnane X receptor deficient (x-axis) for control and Dicyclohexyl phthalate, respectively.
Figure 4.
The impact of DCHP exposure on intestinal PXR target gene expression and plasma lipid levels in PXRF/F and PXRΔIEC mice. Eight-wk-old male PXRF/F and PXRΔIEC littermates were administered vehicle control or 10mg/kg BW per day of DCHP daily by oral gavage for 7 d. (A) Intestinal expression of PXR target genes was analyzed by qPCR (n=5, two-sample, two-tailed Student’s t-test, *, p<0.05). Fasting plasma (B) total cholesterol and (C) triglyceride levels were analyzed enzymatically by colorimetric methods. (D) Lipoprotein fractions (VLDL-C, LDL-C, and HDL-C) were isolated from the plasma, and the cholesterol levels of each fraction were then measured enzymatically. (n=56, two-way ANOVA, Bonferroni multiple comparisons test for multiple comparisons, *, p<0.05). The numerical data corresponding to this figure are shown in Tables S10–S11. Results represent mean values. Error bars represent±SEM. Note: ANOVA, analysis of variance; BW, body weight; CYP3A11, cytochrome P450, family 3, subfamily A, polypeptide 11; DCHP, dicyclohexyl phthalate; GSTα1, glutathione S-transferase; MDR1a, multidrug resistance protein 1a; PXR, pregnane X receptor; PXRΔIEC, intestinal epithelial cell-specific pregnane X receptor deficient; PXRF/F, pregnane X receptor flox; qPCR, quantitative polymerase chain reaction; SEM, standard error of the mean.
Figure 5A is a set of two clustered bar graphs plotting messenger ribonucleic acid expression, ranging 0 to 5 in unit increments (y-axis) across pregnane X receptor flox mice and intestinal epithelial cell specific pregnane X receptor deficient each includes Niemann-Pick C 1-Like 1 and microsomal triglyceride transfer protein (x-axis) for control and Dicyclohexyl phthalate, respectively. Figure 5B is a western blot, plotting control and Dicyclohexyl phthalate each for pregnane X receptor flox mice and intestinal epithelial cell specific pregnane X receptor deficient (columns) across Niemann-Pick C 1-Like 1, Input, microsomal triglyceride transfer protein, and Input (rows). Figures 5C and 5D are line graphs, plotting tritiated-cholesterol uptake (disintegrations per minute times 10 begin superscript 4 end superscript per 2 centimeters of intestine), 0 to 200 in increments of 50 and tritiated-cholesterol uptake (disintegrations per minute per 50 microliters of plasma), ranging from 0 to 10,000 in increments of 2,000 (y-axis) across intestine segment (centimeter), ranging from 1 to 17 in unit increments and time after oral gavage (hours), ranging from 0 to 2 in unit increments and 2 to 6 in increments of 2 (x-axis) for pregnane X receptor flox mice per control, pregnane X receptor flox mice per Dicyclohexyl phthalate, intestinal epithelial cell specific pregnane X receptor deficient per control, and intestinal epithelial cell specific pregnane X receptor deficient per Dicyclohexyl phthalate, respectively.
Figure 5.
The effects of DCHP exposure on intestinal NPC1L1 and MTP expression and lipid absorption in PXRF/F and PXRΔIEC mice. Eight-wk-old male PXRF/F and PXRΔIEC littermates were administered vehicle control or 10mg/kg BW per day of DCHP daily by oral gavage for 7 d. (A) Intestinal expression of NPC1L1 and MTP was measured by qPCR (n=5, two-sample, two-tailed Student’s t-test, *, p<0.05 and **, p<0.01). (B) The recruitment of PXR onto the NPC1L1 and MTP promoter in the intestine was evaluated by chromatin immunoprecipitation (ChIP) assays. The PCR products of the ChIP assays were visualized by loading onto 2% agarose gel (n=3). (C) Control or DCHP-treated PXRF/F and PXRΔIEC mice were given an oral challenge of oil containing [3H]-cholesterol, and the distribution of radioactivity in intestinal segments of the mice was evaluated after 2 h (n=56, two-way ANOVA, Bonferroni multiple comparisons test for multiple comparisons, *, p<0.05, **, p<0.01 and ***, p<0.001). (D) Control or DCHP-treated PXRF/F and PXRΔIEC mice were injected with lipase inhibitor poloxamer-407 and then given an oral challenge of oil containing [3H]-cholesterol. Plasma samples were collected from those mice at several time points within 6 h, and the presence of [3H]-cholesterol was measured (n=5, two-way ANOVA, Bonferroni multiple comparisons test for multiple comparisons. *, p<0.05, compared with PXRF/F mice treated with control; ††, p<0.01, compared with PXRΔIEC mice treated with DCHP). The numerical data corresponding to this figure are shown in Tables S12–S14. Results represent mean values. Error bars represent±SEM. Note: ANOVA, analysis of variance; BW, body weight; DCHP, dicyclohexyl phthalate; MTP, microsomal triglyceride transfer protein; NPCIL1, Niemann-Pick C1-Like 1; PXRΔIEC, intestinal epithelial cell-specific pregnane X receptor deficient; PXRF/F, pregnane X receptor flox; qPCR, quantitative polymerase chain reaction; SEM, standard error of the mean.
Figures 6A and 6B are clustered bar graphs titled pregnane X receptor flox mice and intestinal epithelial cell specific pregnane X receptor deficient, plotting plasma ceramide (micromolar), ranging from 0 to 5 in unit increments (y-axis) across uppercase c 12 colon 0, uppercase c 14 colon 0, uppercase c 16 colon 0, uppercase c 18 colon 0, uppercase c 18 colon 1, uppercase c 20 colon 0, uppercase c 22 colon 0, uppercase c 24 colon 0, and uppercase c 24 colon 1 (x-axis) for control and Dicyclohexyl phthalate, respectively. Figure 6C is a set of two clustered bar graphs, plotting messenger ribonucleic acid expression, ranging from 0 to 5 in unit increments (y-axis) across pregnane X receptor flox mice and intestinal epithelial cell specific pregnane X receptor deficient each includes Glucosylceramidase Beta 1, Neuraminidase 3, Ceramide synthase 4, Sphingomyelin Phosphodiesterase 1, Sphingomyelin Phosphodiesterase 3, and Ectonucleotide Pyrophosphatase or Phosphodiesterase 7 (x-axis) for control and Dicyclohexyl phthalate, respectively.
Figure 6.
The impact of DCHP exposure on circulating ceramide levels and ceramide-synthesis–related gene expression in PXRF/F and PXRΔIEC mice. Eight-wk-old male PXRF/F and PXRΔIEC littermates were treated with vehicle control or 10mg/kg BW per day of DCHP daily by oral gavage for 7 d. Plasma ceramide levels of (A) PXRF/F and (B) PXRΔIEC mice were measured by LC-MS/MS (n=6, two-sample, two-tailed Student’s t-test, *, p<0.05). (C) Intestinal expression of ceramide-synthesis–related genes were measured by qPCR (n=5, two-sample, two-tailed Student’s t-test, *, p<0.05). The numerical data corresponding to this figure are shown in Tables S15–S16. Results represent mean values. Error bars represent±SEM. Note: BW, body weight; CERS4, ceramide synthase 4; DCHP, dicyclohexyl phthalate; ENPP1, ectonucleotide pyrophosphatase/phosphodiesterase 1; GBA1, glucosylceramidase beta 1; LC-MS/MS, liquid chromatography–tandem mass spectrometry; NEU3, neuraminidase 3; PXRΔIEC, intestinal epithelial cell-specific pregnane X receptor deficient; PXRF/F, pregnane X receptor flox; SMPD1, sphingomyelin Phosphodiesterase 1; SMPD3, sphingomyelin Phosphodiesterase 3; qPCR, quantitative polymerase chain reaction; SEM, standard error of the mean.
Figure 7A is a set of two clustered bar graphs, plotting messenger ribonucleic acid expression, ranging from 0 to 15 in increments of 5 (y-axis) across humanized mice pregnane X receptor and pregnane X receptor humanized murine pregnane X receptor deficient each includes Cytochrome P450 3 A2, Multidrug resistance protein 1a, Niemann-Pick C 1-Like 1, microsomal triglyceride transfer protein (x-axis) for control and Dicyclohexyl phthalate, respectively. Figures 7B and 7C are clustered bar graphs titled Cholesterol and Triglyceride, plotting milligram per deciliter, ranging from 0 to 200 in increments of 50 and 0 to 80 in increments of 20 (y-axis) across humanized mice pregnane X receptor and pregnane X receptor humanized murine pregnane X receptor deficient (x-axis) for control and Dicyclohexyl phthalate, respectively. Figures 7D is a set of three clustered bar graphs titled Very-low-density lipoproteins-cholesterol, Low-density lipoprotein-cholesterol, and High-density lipoprotein-cholesterol, plotting milligram per deciliter, ranging from 0 to 5 in unit increments, 0 to 50 in increments of 10, and 0 to 100 in increments of 20 (y-axis) across humanized mice pregnane X receptor and pregnane X receptor humanized murine pregnane X receptor deficient (x-axis) for control and Dicyclohexyl phthalate, respectively.
Figure 7.
The effects of DCHP exposure on PXR target gene expression and plasma lipid levels in PXR-humanized (huPXR) mice. Eight-wk-old male huPXR and PXR/ littermates were treated with 10mg/kg BW per day of DCHP or DMSO control daily by oral gavage for 7 d. (A) The intestinal mRNA expression of PXR target genes and lipogenic genes were measured by qPCR analysis (n=5, two-sample, two-tailed Student’s t-test, *, p<0.05 and ***, p<0.001). Fasting plasma (B) total cholesterol and (C) triglyceride levels were analyzed by enzymatically colorimetric methods. (D) Lipoprotein fractions VLDL, LDL, and HDL were isolated from the plasma, and the cholesterol levels of VLDL, LDL, and HDL were examined by colorimetric methods. (n=56, two-way ANOVA, Bonferroni multiple comparisons test for multiple comparisons, *, p<0.05). Error bars represent±SEM. The numerical data corresponding to this figure are shown in Tables S17–S18. Note: ANOVA, analysis of variance; CYP3A11, cytochrome P450, family 3, subfamily A, polypeptide 11; DCHP, dicyclohexyl phthalate; DMSO, dimethyl sulfoxide; HDL-C, high-density lipoprotein-cholesterol; LDL-C, low-density lipoprotein-cholesterol; MDR1a, multidrug resistance protein 1a; MTP, microsomal triglyceride transfer protein; NPC1L1, Niemann-Pick C 1-Like 1; PXR, pregnane X receptor; PXR/, pregnane X receptor deficient; qPCR, quantitative polymerase chain reaction; SEM, standard error of the mean; VLDL, very-low-density lipoprotein-cholesterol.
Figures 8A and 8B are clustered bar graphs titled humanized mice pregnane X receptor and pregnane X receptor humanized murine pregnane X receptor deficient, plotting plasma ceramide (micromolar), ranging from 0 to 8 in increments of 2 and 0 to 6 in increments of 2 (y-axis) across uppercase c 12 colon 0, uppercase c 14 colon 0, uppercase c 16 colon 0, uppercase c 18 colon 0, uppercase c 18 colon 1, uppercase c 20 colon 0, uppercase c 22 colon 0, uppercase c 24 colon 0, and uppercase c 24 colon 1 (x-axis) for control and Dicyclohexyl phthalate, respectively. Figure 8C is a set of two clustered bar graphs, plotting messenger ribonucleic acid expression, ranging from 0 to 15 in increments of 5 (y-axis) across humanized pregnane X receptor flox mice and intestinal epithelial cell specific pregnane X receptor deficient each includes Glucosylceramidase Beta 1, Neuraminidase 3, Ceramide synthase 4, Sphingomyelin Phosphodiesterase 1, Sphingomyelin Phosphodiesterase 3, and Ectonucleotide Pyrophosphatase or Phosphodiesterase 7 (x-axis) for control and Dicyclohexyl phthalate, respectively. Figure 8D is a set of one western blot and two clustered bar graphs. The western blot plots control and Dicyclohexyl phthalate each for humanized mice pregnane X receptor and pregnane X receptor humanized murine pregnane X receptor deficient (columns) and Glucosylceramidase Beta 1 with 60 kilodalton, microsomal triglyceride transfer protein with 97 kilodalton, Actin with 42 kilodalton (rows). The set of two clustered bar graphs plots Glucosylceramidase Beta 1 to Actin ratio, ranging from 0.0 to 2.0 in increments of 0.5 and microsomal triglyceride transfer protein to Actin ratio, ranging from 0 to 4 in unit increments (y-axis) across humanized mice pregnane X receptor and pregnane X receptor humanized murine pregnane X receptor deficient (x-axis), respectively.
Figure 8.
The impact of DCHP exposure circulating ceramide levels and ceramide-synthesis–related gene expression in PXR-humanized (huPXR) mice. Eight-wk-old male huPXR and PXR/ littermates were treated with 10mg/kg BW per day of DCHP or vehicle control daily by oral gavage for 7 d. Plasma ceramide levels of (A) huPXR and (B) PXR/ mice were measured by LC-MS/MS. (n=56, two-sample, two-tailed Student’s t-test, *, p<0.05). (C) Intestinal expression of ceramide-synthesis–related genes were measured by qPCR (n=45, two-sample, two-tailed Student’s t-test, *, p<0.05). (D) Immunoblotting of GBA1, MTP, and Actin proteins in the intestine of huPXR and PXR/ mice. The densitometry analyses of the protein bands were shown below the immunoblotting panel (n=3, two-way ANOVA, Bonferroni multiple comparisons test for multiple comparisons, *, p<0.05, **, p<0.01, and ***, p<0.001). The numerical data corresponding to this figure are shown in Tables S19–S21. Results represent mean values. Error bars represent±SEM. Note: ANOVA, analysis of variance; DCHP, dicyclohexyl phthalate; GBA1, glucosylceramidase beta 1; LC-MS/MS, liquid chromatography–tandem mass spectrometry; MTP, microsomal triglyceride transfer protein; PXR/, pregnane X receptor deficient; qPCR, quantitative polymerase chain reaction; SEM, standard error of the mean.
Figure 9 is a schematic representation depicting the adverse effects of Dicyclohexyl phthalate exposure on plasma lipid and ceramide levels. On the left, a cartoon illustration of a mouse exposed to Dicyclohexyl phthalate is displayed. On the right, an illustration is divided into two parts, Figure 9A and 9B. In Figure 9A, Dicyclohexyl phthalate leads to higher plasma cholesterol and ceramide levels in mice in an intestinal pregnane X receptor-dependent manner. The dicyclohexyl phthalate-mediated pregnane X receptor activation regulates the expression of key lipogenic genes, including Niemann-Pick C 1-Like 1 and microsomal triglyceride transfer protein which leads to increased hyperlipidemia. In Figure 9B, Dicyclohexyl phthalate leads to ceramide-synthesis–related genes, including glucocerebrosidase gene 1 in the intestine, which leads to increased ceramides. Both, Figure 9A and 9B lead to increased cardiovascular disease.
Figure 9.
Schematic representation of the potential role of PXR in mediating the adverse effects of DCHP exposure on plasma lipid and ceramide levels. DCHP, a widely used phthalate, is a potent agonist of PXR. Exposure to DCHP leads to higher plasma cholesterol and ceramide levels in mice in an intestinal PXR-dependent manner. DCHP-mediated PXR activation regulates the expression of key lipogenic genes (e.g., NPC1L1 and MTP) (A) and ceramide-synthesis–related genes (e.g., GBA1) (B) in the intestine. Intestinal PXR signaling may contribute to adverse effects of DCHP on cardiovascular health through both hyperlipidemia-dependent and -independent mechanisms. This figure was created using BioRender.com. Note: DCHP, dicyclohexyl phthalate; GBA1, glucosylceramidase beta 1; MTP, microsomal triglyceride transfer protein; NPCIL1, Niemann-Pick C1-Like 1; PXR, pregnane X receptor.

Similar articles

Cited by

References

    1. Abumrad NA, Davidson NO. 2012. Role of the gut in lipid homeostasis. Physiol Rev 92(3):1061–1085, PMID: , 10.1152/physrev.00019.2011. - DOI - PMC - PubMed
    1. Ahbab MA, Güven C, Koçkaya EA, Barlas N. 2017. Comparative developmental toxicity evaluation of di-n-hexyl phthalate and dicyclohexyl phthalate in rats. Toxicol Ind Health 33(9):696–716, PMID: , 10.1177/0748233717711868. - DOI - PubMed
    1. Altmann SW, Davis HR Jr, Zhu L-J, Yao X, Hoos LM, Tetzloff G, et al. . 2004. Niemann-Pick C1 Like 1 protein is critical for intestinal cholesterol absorption. Science 303(5661):1201–1204, PMID: , 10.1126/science.1093131. - DOI - PubMed
    1. Autian J. 1973. Toxicity and health threats of phthalate esters: review of the literature. Environ Health Perspect 4:3–26, PMID: , 10.1289/ehp.73043. - DOI - PMC - PubMed
    1. Bachmanov AA, Reed DR, Beauchamp GK, Tordoff MG. 2002. Food intake, water intake, and drinking spout side preference of 28 mouse strains. Behav Genet 32(6):435–443, PMID: , 10.1023/a:1020884312053. - DOI - PMC - PubMed

Publication types