. 2021 Dec 1;21(13):1.
doi: 10.1167/jov.21.13.1.

Perceived group size is determined by the centroids of the component elements

Affiliations

Perceived group size is determined by the centroids of the component elements

Alexandria M Boswell et al. J Vis. .

Abstract

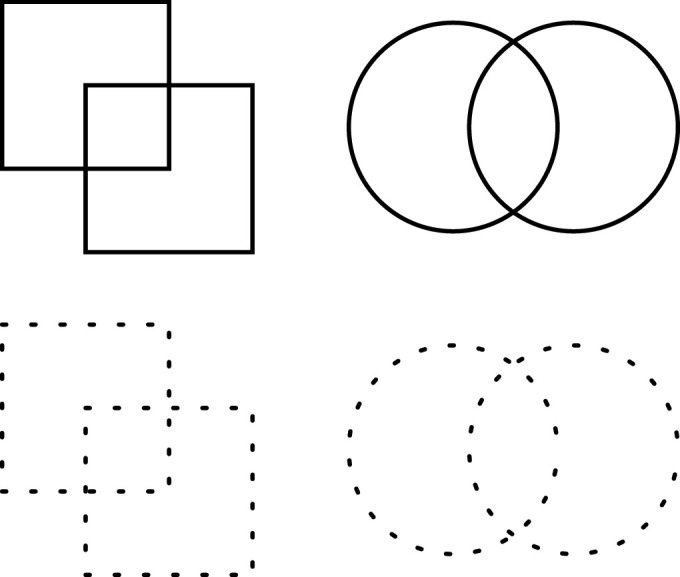
To accomplish the deceptively simple task of perceiving the size of objects in the visual scene, the visual system combines information about the retinal size of the object with several other cues, including perceived distance, relative size, and prior knowledge. When local component elements are perceptually grouped to form objects, the task is further complicated because a grouped object does not have a continuous contour from which retinal size can be estimated. Here, we investigate how the visual system solves this problem and makes it possible for observers to judge the size of perceptually grouped objects. We systematically vary the shape and orientation of the component elements in a two-alternative forced-choice task and find that the perceived size of the array of component objects can be almost perfectly predicted from the distance between the centroids of the component elements and the center of the array. This is true whether the global contour forms a circle or a square. When elements were positioned such that the centroids along the global contour were at different distances from the center, perceived size was based on the average distance. These results indicate that perceived size does not depend on the size of individual elements, and that smooth contours formed by the outer edges of the component elements are not used to estimate size. The current study adds to a growing literature highlighting the importance of centroids in visual perception and may have implications for how size is estimated for ensembles of different objects.


Figures

Figure 1.
Figure 1.
In the top row, objects are grouped by good continuation such that two squares are perceived instead of two abutting L-shapes, and two circles are perceived rather that abutting half-moons. This is true even when objects are not defined by continuous contours.
Figure 2.
Figure 2.
Arrays of circles used in experiment 1. The three circle sizes used are shown in the box.
Figure 3.
Figure 3.
Results of experiment 1. Points of subjective equality averaged across participants. The circular elements used for the three conditions are shown below each bar plot. There was no difference between the different conditions, suggesting that participants were using the center of each element to judge the array size. Error bars are ±1 standard error of the mean.
Figure 4.
Figure 4.
(A) The difference between the triangle's bisector midpoint (half-height) and it's centroid. (B) Example array from experiment 2, featuring circular arrays with triangular elements. There were two element conditions: pointing towards the center of the array or pointing away from the center.
Figure 5.
Figure 5.
Results of experiment 2. Points of subjective equality averaged across participants. There was a significant difference between the two conditions, suggesting that arrays with outward pointing triangles were seen as being smaller than arrays with inward pointing triangles. Error bars are ±1 standard error of the mean.
Figure 6.
Figure 6.
(A) Example array from experiment 3, featuring square arrays with triangular elements. There were two element conditions: either pointing toward or away from the center of the array. (B) Point of subjective equality for participants in experiment 3. There was a significant difference between the two conditions, suggesting that arrays with outward pointing triangles were seen as being smaller than arrays with inward pointing triangles. Error bars are ±1 standard error of the mean.
Figure 7.
Figure 7.
(A) Example array from experiment 4, featuring square arrays with triangular elements. There were two element conditions: either all elements pointing toward the center or the non-corner elements pointing away from the center of the array. (B) Point of subjective equality averaged across participants. There was a significant difference between the two conditions, suggesting that arrays with outward pointing non-corner triangle elements were seen as being smaller than arrays where all elements were pointing inward. The mean difference here is much smaller but consistent with what would be expected if a participant used the average distance of the element centroids. Error bars are ±1 standard error of the mean.
Figure 8.
Figure 8.
(A) Example array from experiment 5, featuring square arrays with triangular elements. There were two element conditions: either all elements pointing toward the center or the corner elements pointing away from the center of the array. (B) Point of subjective equality averaged across participants. There was a significant difference between the two conditions, suggesting that arrays with outward pointing triangles were seen as being smaller than arrays with inward pointing triangles. Like in experiment 4, the results here suggest that participants are using the average location of the centroids of the triangles to judge the size of the array. Error bars are ±1 standard error of the mean.

Similar articles

References

    1. Anstis, S., Gregory, R., & Heard, P. (2009). The Triangle-Bisection Illusion. Perception, 38, 321–332. - PubMed
    1. Ariely, D. (2008). Better than average? When can we say that subsampling of items is better than statistical summary representations? Perception Psychophysics, 70, 1325–1326. - PubMed
    1. Ariely, D. (2001). Seeing Sets: Representation by Statistical Properties. Psychological Science, 12, 157–162. - PubMed
    1. Baud-Bovy, G., & Soechting, J. (2001). Visual localization of the center of mass of compact, asymmetric, two-dimensional shapes. Journal of Experimental Psychology. Human Perception and Performance, 27, 692–706. - PubMed
    1. Brainard, D. H. (1997). The psychophysics toolbox. Spatial Vision, 10, 433–436. - PubMed

Publication types