

Native glycan fragments detected by MALDI mass spectrometry imaging are independent prognostic factors in pancreatic ductal adenocarcinoma
- PMID: 34851463
- PMCID: PMC8636555
- DOI: 10.1186/s13550-021-00862-y
Native glycan fragments detected by MALDI mass spectrometry imaging are independent prognostic factors in pancreatic ductal adenocarcinoma
Abstract
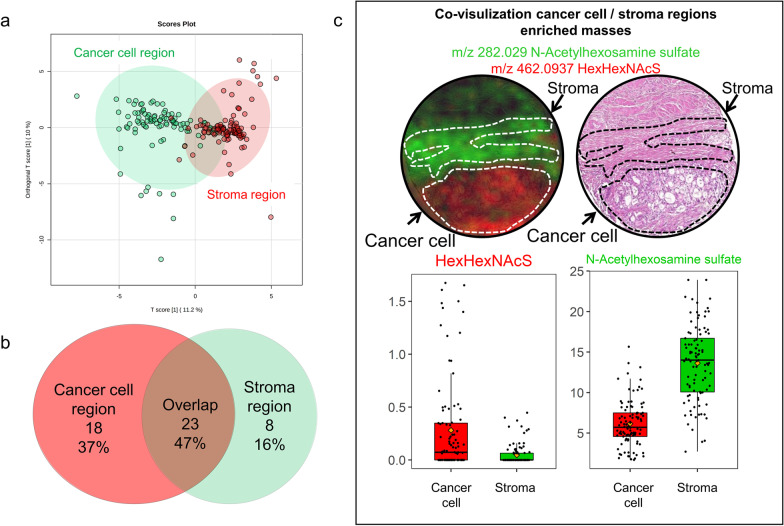
Background: Pancreatic ductal adenocarcinoma (PDAC) remains one of the deadliest malignancies to date. The impressively developed stroma that surrounds and modulates the behavior of cancer cells is one of the main factors regulating the PDAC growth, metastasis and therapy resistance. Here, we postulate that stromal and cancer cell compartments differentiate in protein/lipid glycosylation patterns and analyze differences in glycan fragments in those compartments with clinicopathologic correlates.
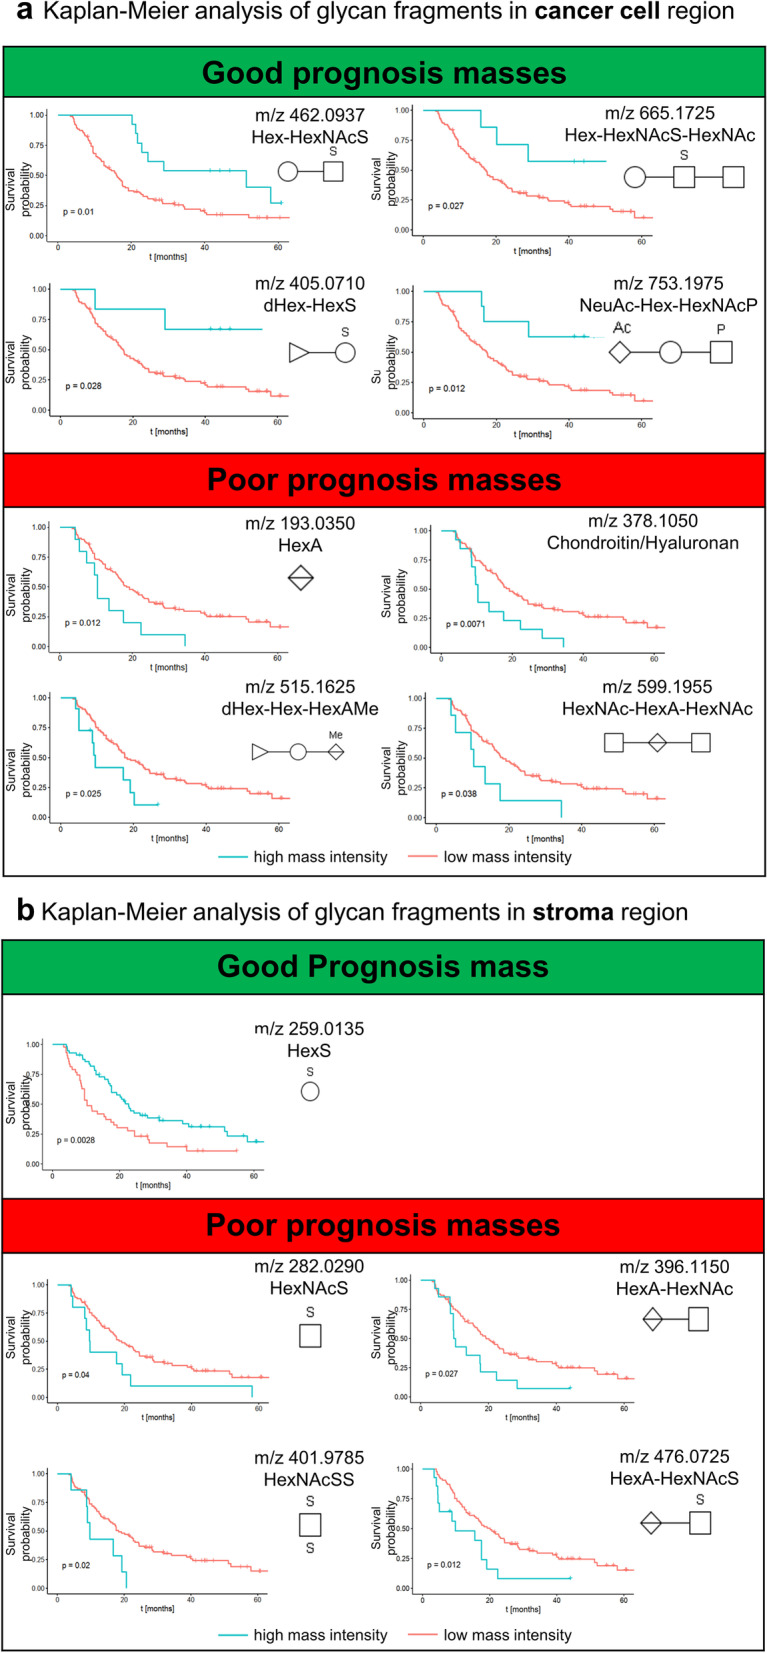
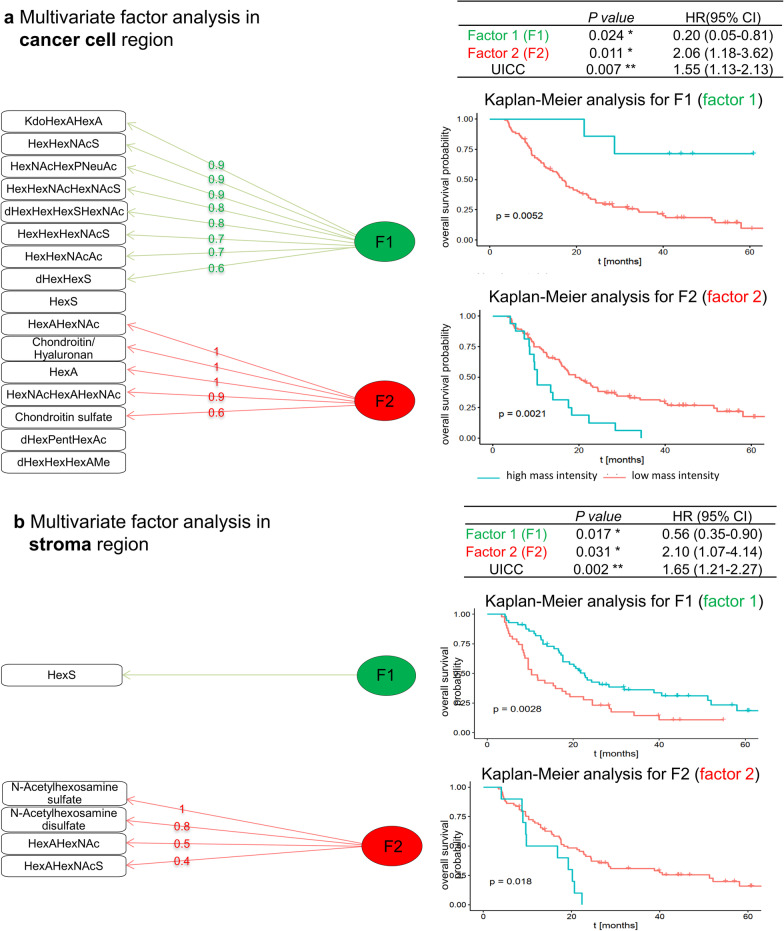
Results: We analyzed native glycan fragments in 109 human FFPE PDAC samples using high mass resolution matrix-assisted laser desorption/ionization Fourier-transform ion cyclotron resonance mass spectrometric imaging (MALDI-FT-ICR-MSI). Our method allows detection of native glycan fragments without previous digestion with PNGase or any other biochemical reaction. With this method, 8 and 18 native glycans were identified as uniquely expressed in only stromal or only cancer cell compartment, respectively. Kaplan-Meier survival model identified glycan fragments that are expressed in cancer cell or stromal compartment and significantly associated with patient outcome. Among cancer cell region-specific glycans, 10 predicted better and 6 worse patient survival. In the stroma, 1 glycan predicted good and 4 poor patient survival. Using factor analysis as a dimension reduction method, we were able to group the identified glycans in 2 factors. Multivariate analysis revealed that these factors can be used as independent survival prognostic elements with regard to the established Union for International Cancer Control (UICC) classification both in tumor and stroma regions.
Conclusion: Our method allows in situ detection of naturally occurring glycans in FFPE samples of human PDAC tissue and highlights the differences among glycans found in stromal and cancer cell compartment offering a basis for further exploration on the role of specific glycans in cancer-stroma communication.
Keywords: Glycans; MALDI-FT-ICR-MSI; PDAC.
© 2021. The Author(s).
Conflict of interest statement
WW has attended Advisory Boards and served as speaker for Roche, MSD, BMS, AstraZeneca, Pfizer, Merck, Lilly, Boehringer, Novartis, Takeda, Bayer, Amgen, Astellas, Eisai, Illumina, Siemens, Agilent, ADC, GSK and Molecular Health. WW receives research funding from Roche, MSD, BMS and AstraZeneca, all outside the submitted work; JTS reports the following disclosures: Bristol Myers Squibb, Celgene, Roche (Research Funding); AstraZeneca, Bayer, Bristol Myers Squibb, Celgene, Immunocore, Novartis, Roche, Shire (Consulting or advisory role); AstraZeneca, Aurikamed, Baxalta, Bristol Myers Squibb, Celgene, Falk Foundation, iomedico, Immunocore, Novartis, Roche, Shire (honoraria); minor equity in iTheranostics and Pharma15 (< 3%) and member of the Board of Directors for Pharma15, all outside the submitted work. KS is member of the advisory board of TRIMT and received research funding from Roche, all outside the submitted work. KS has a patent filed for a radiopharmaceutical compound. MS served as speaker and scientific advisor for Roche, MSD and BioNTech.
Figures
References
Grants and funding
LinkOut - more resources
Full Text Sources
