. 2021 Dec 3;7(49):eabj1215.
doi: 10.1126/sciadv.abj1215. Epub 2021 Dec 1.

Autocrine inhibition by a glutamate-gated chloride channel mediates presynaptic homeostatic depression

Affiliations

Autocrine inhibition by a glutamate-gated chloride channel mediates presynaptic homeostatic depression

Xiling Li et al. Sci Adv. .

Abstract

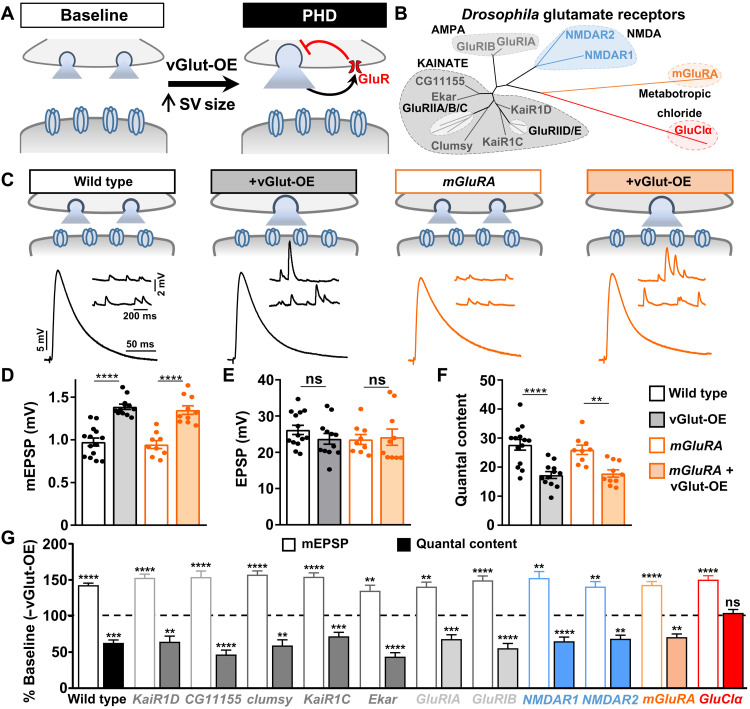
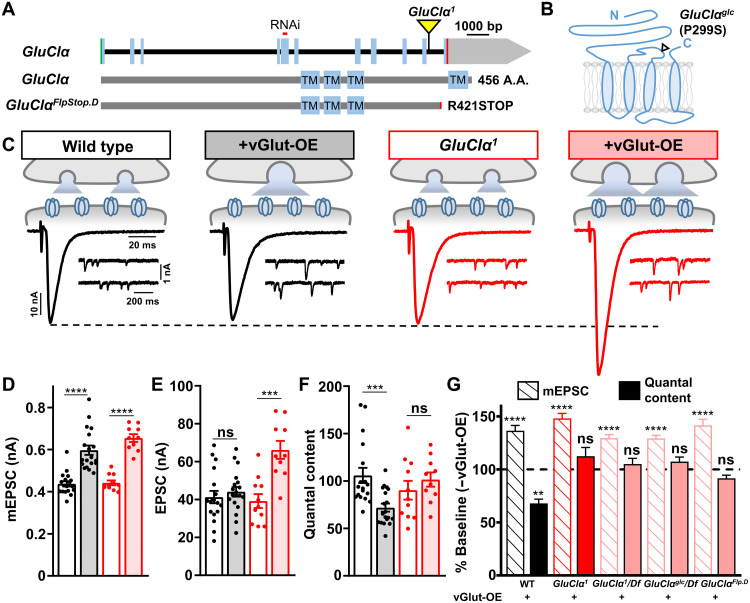
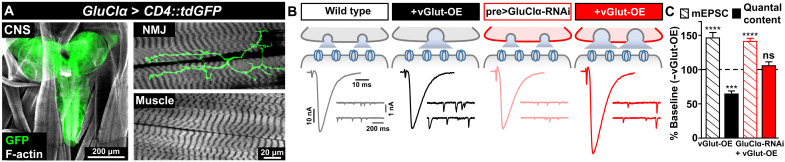
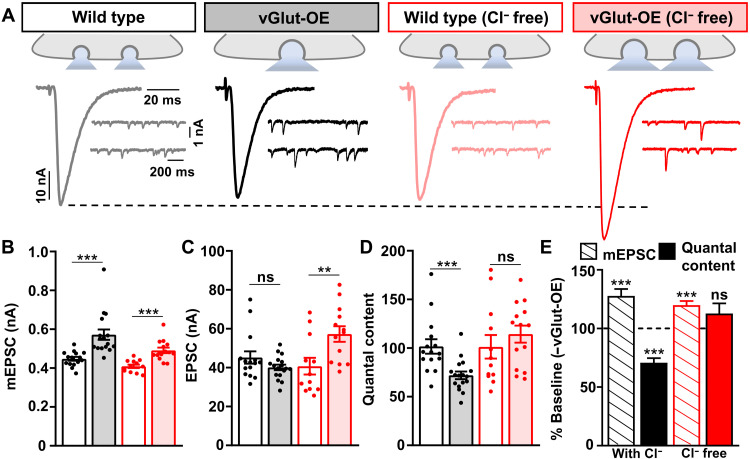
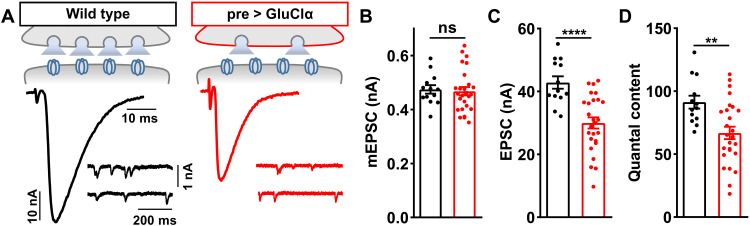
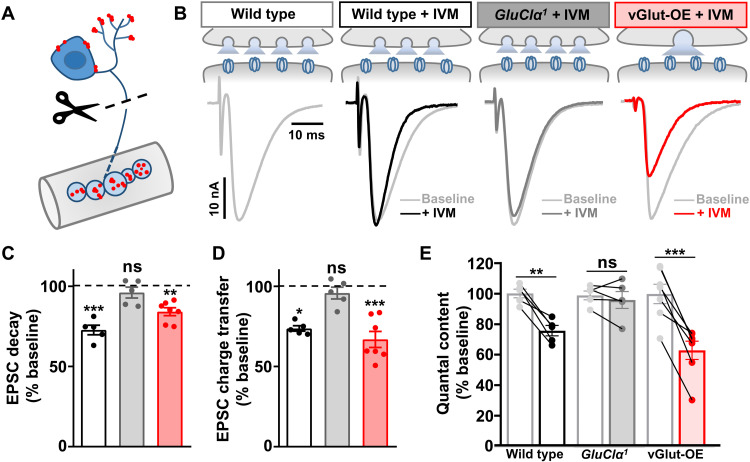
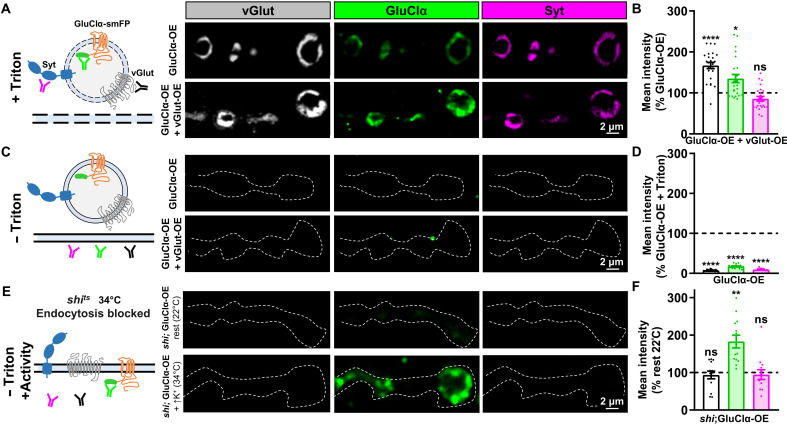
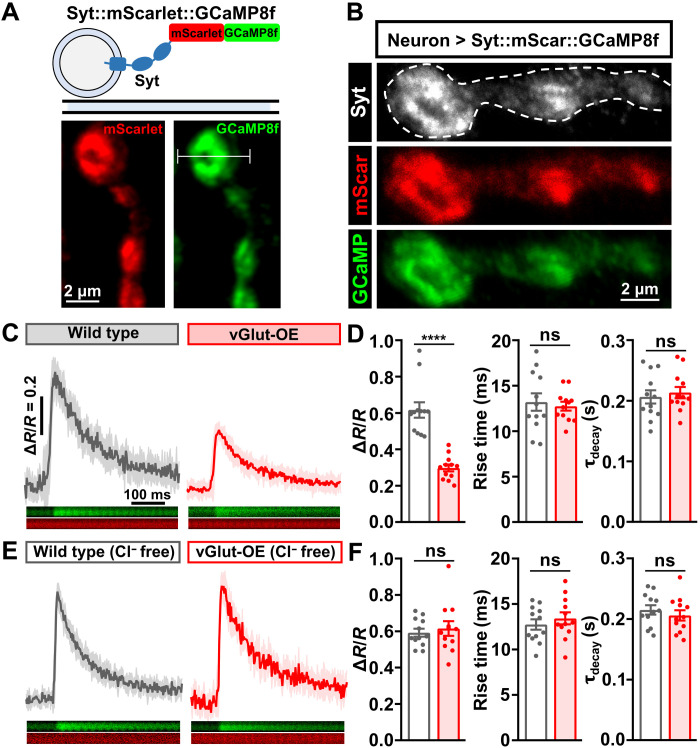
Homeostatic modulation of presynaptic neurotransmitter release is a fundamental form of plasticity that stabilizes neural activity, where presynaptic homeostatic depression (PHD) can adaptively diminish synaptic strength. PHD has been proposed to operate through an autocrine mechanism to homeostatically depress release probability in response to excess glutamate release at the Drosophila neuromuscular junction. This model implies the existence of a presynaptic glutamate autoreceptor. We systematically screened all neuronal glutamate receptors in the fly genome and identified the glutamate-gated chloride channel (GluClα) to be required for the expression of PHD. Pharmacological, genetic, and Ca2+ imaging experiments demonstrate that GluClα acts locally at axonal terminals to drive PHD. Unexpectedly, GluClα localizes and traffics with synaptic vesicles to drive presynaptic inhibition through an activity-dependent anionic conductance. Thus, GluClα operates as both a sensor and effector of PHD to adaptively depress neurotransmitter release through an elegant autocrine inhibitory signaling mechanism at presynaptic terminals.


Figures

Fig. 1.
Fig. 1.. A screen of Drosophila GluRs identifies the glutamate-gated chloride channel to be necessary for PHD.
(A) Schematic illustrating enlarged synaptic vesicle (SV) size and excess glutamate release following vGlut-OE (OK371-Gal4/UAS-vGlut). A putative presynaptic glutamate autoreceptor is shown mediating an autocrine, homeostatic inhibition of neurotransmitter release that drives PHD. (B) Phylogenic analysis of putative GluRs encoded in the D. melanogaster genome. The maximum likelihood (ML) topology tree is constructed by GluRs separated into the following GluR subtypes: kainate (10), AMPA (2), NMDA (2), metabotropic (1), and glutamate-gated (1). Note that the five muscle-specific GluR subunits (GluRIIA, IIB, IIC, IID, and IIE) were not screened but are shown in light gray. (C) Schematic and representative electrophysiological traces of NMJ recordings from wild-type (w1118) and mGluRA mutants (w;mGluRA112b) at baseline and following vGlut-OE (w;UAS-vGlut/OK371-Gal4;mGluRA112b). Increased mEPSP amplitudes are observed in both wild-type and mGluRA mutant NMJs after vGlut overexpression due to excess glutamate released from individual synaptic vesicles, while EPSP amplitudes are maintained at baseline levels due to a homeostatic decrease in neurotransmitter release (quantal content). (D to F) Quantification of mEPSP amplitude (D), EPSP amplitude (E), and quantal content (F) in the indicated genotypes (wild type, n = 14; +vGlut, n = 12; mGluRA, n = 9; +vGlut, n = 10). **P < 0.01 and ****P < 0.0001. (G) Quantification of mEPSP amplitude and quantal content in the indicated genotypes normalized to baseline values (−vGlut-OE; n ≥ 8; see table S1). **P < 0.01, ***P < 0.001, and ****P < 0.0001. Note that mEPSP amplitudes are enhanced following vGlut overexpression in each mutant, while a homeostatic decrease in presynaptic glutamate release (quantal content) is observed in all mutants screened except GluClα. The homeostatic inhibition of glutamate release normally induced by vGlut-OE fails to be induced in GluClα mutants. ns, not significant.
Fig. 2.
Fig. 2.. The glutamate-gated chloride channel GluClα is necessary for PHD expression.
(A) Schematic of the Drosophila GluClα locus with the MiMIC transposon insertion causing the GluClα1 mutation (GluClαMI02890) and RNAi targeting sequence shown. Bottom: Protein structure and transmembrane domains of GluClα. (B) Diagram of the membrane topology of a single GluClα subunit with the location of the GluClαglc mutation illustrated; GluCl channels are homopentamers (36). (C) Schematic and representative traces of two-electrode voltage clamp NMJ recordings from wild-type (w1118) and GluClα mutants (w;GluClα1) at baseline (w;OK371-Gal4/UAS-vGlut) and +vGlut-OE (w;OK371-Gal4/UAS-vGlut;GluClα1). Increased mEPSC amplitudes are observed in both wild-type and GluClα1 NMJs following vGlut overexpression. PHD maintains stable evoked amplitude in vGlut-OE NMJs, while EPSC amplitude is significantly enhanced in GluClα1 + vGlut-OE because of a failure to homeostatically diminish quantal content. (D to F) Quantification of mEPSC amplitude (D), EPSC amplitude (E), and quantal content (F) values in the indicated genotypes (wild type, n = 18; +vGlut-OE, n = 19; GluClα1, n = 13; +vGlut-OE, n = 10). ***P < 0.001 and ****P < 0.0001. (G) Quantification of mEPSC and quantal content values normalized to baseline values in the indicated genotypes, including vGlut-OE, GluClα1 + vGlut-OE and GluClα1/Df + vGlut-OE (w;OK371-Gal4/UAS-vGlut;GluCl1/Df), and GluClαglc/Df + vGlut-OE (w;OK371-Gal4/UAS-vGlut;GluClglc/Df). **P < 0.01 and ****P < 0.0001. bp, base pairs.
Fig. 3.
Fig. 3.. GluClα is expressed in motor neurons and required presynaptically for PHD.
(A) Representative images of the larval brain [central nervous system (CNS)] and muscle 6/7 NMJ of a GFP reporter driven by the GluClα promoter (w;GluClα-Gal4/UAS-CD4::tdGFP). Immunostaining using anti-GFP and anti-phalloidin (F-actin marker) is shown. GluClα is expressed in the CNS and in motor neurons, while no signal is detected in the muscle. (B) Schematic and representative EPSC and mEPSC traces in wild type, vGlut-OE, and following knockdown of GluClα expression in motor neurons by RNAi at baseline (pre>GluClα-RNAi: w;OK371-Gal4/UAS-GluClα RNAi;UAS-Dcr2/+) and with vGlut-OE (w;OK371-Gal4/UAS-vGlut,UAS-GluClα RNAi;UAS-Dcr2/+). PHD fails to be expressed in pre>GluClα-RNAi+vGlut-OE. (C) Quantification of mEPSC and quantal content values in the indicated genotypes relative to baseline (wild type, n = 12; +vGlut-OE, n = 13; pre>GluClα-RNAi, n = 16; +vGlut-OE, n = 20). ***P < 0.001 and ****P < 0.0001.
Fig. 4.
Fig. 4.. Extracellular chloride ions are required for PHD expression.
(A) Schematics and representative traces of mEPSC and EPSC recordings in the indicated genotypes performed in standard or modified (Cl free) saline. Although vGlut-OE increases mEPSC amplitude in both saline conditions, no change in presynaptic neurotransmitter release is observed in vGlut-OE NMJs recorded in Cl-free saline, leading to enhanced EPSC amplitude and a failure to express PHD. (B to D) Quantification of average mEPSC amplitude (B), EPSC amplitude (C), and quantal content values (D) for the indicated genotypes and conditions (wild type, n = 15; vGlut-OE, n = 17; wild type Cl free, n = 12; vGlut-OE Cl free, n = 13). **P < 0.01 and ***P < 0.001. (E) Quantification of mEPSC and quantal content values normalized to baseline values (−vGlut-OE) for wild-type NMJs in standard or Cl -free saline. ***P < 0.001.
Fig. 5.
Fig. 5.. Presynaptic GluClα overexpression diminishes glutamate release.
(A) Schematic and representative EPSC and mEPSC traces in wild type and presynaptic overexpression of GluClα (pre>GluClα: w;OK371-Gal4/UAS-GluClα). Presynaptic GluClα overexpression reduces EPSC amplitude without significantly changing mEPSCs, indicating diminished neurotransmitter release. (B to D) Quantification of mEPSC amplitude (B), EPSC amplitude (C), and quantal content (D) in the indicated genotypes (wild type, n = 10; pre > GluClα, n = 13). **P < 0.01 and ****P < 0.0001.
Fig. 6.
Fig. 6.. Acute application of the GluClα agonist IVM induces local presynaptic inhibition.
(A) Schematic illustrating the putative subcellular locations of GluClα (illustrated in red) at dendrites and axon terminals of motor neurons. Cutting the motor nerve and then applying IVM enables a pharmacological and functional test for the local and acute action of GluClα at motor neuron terminals. (B) Schematic and representative EPSC traces in wild type, GluClα, and vGlut-OE before (gray) and after (color) IVM application to the same NMJ. IVM application to wild-type NMJs significantly increases the EPSC decay time constant while having no significant effect on GluClα-mutant NMJs. In contrast, IVM application to vGlut-OE diminishes EPSC amplitude and decay kinetics, suggesting an increased sensitivity to IVM. (C) Quantification of the average EPSC decay time constant of the indicated genotypes after IVM application normalized to baseline (before IVM application) values (wild type, n = 5; GluClα1, n = 5; vGlut-OE, n = 7). **P < 0.01 and ***P < 0.001. (D) Quantification of the average EPSC total charge transfer in the indicated genotype after IVM application normalized to its baseline value before IVM application (wild type, n = 5; GluClα1, n = 5; vGlut-OE, n = 7). *P < 0.05 and ***P < 0.001. (E) Quantification of mEPSC and quantal content values in the indicated genotypes after IVM application normalized to baseline values (wild type, n = 5; GluClα1, n = 5; vGlut-OE, n = 7). **P < 0.01 and ***P < 0.001.
Fig. 7.
Fig. 7.. GluClα colocalizes and traffics with synaptic vesicles.
(A) Schematic illustrating permeabilized neuronal membrane and antibodies binding to their antigens on synaptic vesicles (left). Representative images of NMJs immunostained for the synaptic vesicle markers vGlut and Syt, as well as GluClα::smFP (anti-Flag) at presynaptic boutons in control (GluClα-OE: w;OK371-Gal4/UAS-GluClα::smFP) or in combination with vGlut-OE (GluClα-OE + vGlut-OE: w;OK371-Gal4/UAS-GluClα::smFP,UAS-vGlut). (B) Quantification of fluorescence intensity of the indicated signals in GluClα-OE + vGlut-OE normalized to GluClα-OE alone. Note that both anti-vGlut and anti-GluClα signals are enhanced, while anti-Syt signals remain unchanged (GluClα-OE, n = 24; GluClα-OE + vGlut-OE, n = 22). *P < 0.05. (C) Schematic illustrating nonpermeabilized membrane, in which case the antibodies do not access intracellular compartments. Representative images as described in (A) but in the absence of the detergent Triton. Little antigenic signal was observed in this nonpermeabilized condition, indicating that the majority of GluClα is located in intracellular compartments. The dashed line indicates the neuronal membrane [horseradish peroxidase (HRP) signal]. (D) Quantification of fluorescence intensity of nonpermeabilized GluCl-OE staining normalized to the signal found in permeabilized conditions (GluClα-OE, n = 16; GluClα-OE + vGlut-OE, n = 16). ****P < 0.0001. (E) Schematics of the antigens trapped at the plasma membrane using the temperature-sensitive shibire mutant (shits) at the restrictive temperature (34°C) following high K+ stimulation. Representative images of NMJs immunostained with synaptic vesicle markers as described in (C) in permissive or restrictive temperatures without membrane permeabilization. (F) Quantification of fluorescence intensities of the indicated antigens in shits1;OK371-Gal4/UAS-GluCl-smFP at 34°C after high K+ normalized to the baseline signal at 22°C. **P < 0.05.
Fig. 8.
Fig. 8.. PHD is achieved through a Cl-dependent reduction in presynaptic Ca2+.
(A) Schematic and live confocal images of the Syt::mScarlet::GCaMP8f ratiometric Ca2+ reporter. The white line indicates a line scan across a single bouton. (B) Representative images of NMJ boutons stained with anti-Syt and endogenous signals of mScarlet and GCaMP8f. (C) Representative averaged trace of single action potential–evoked Ca2+ transients (ΔR = F488/F561) across time normalized to the baseline F488/F561 ratio (R) before stimulation in the indicated genotypes: wild type (w;OK371-GAL4/+;UAS-syt-mScarlet-GCaMP8f/+) and vGlut-OE (w;OK371-GAL4/UAS-vGlut;UAS-syt-mScarlet-GCaMP8f/+). SEM of 10 independent single action potential–evoked traces is shown in the shaded area (wild type, n = 12; vGlut-OE, n = 12). (D) Quantification of ΔR/R, rise time (10 to 90% to peak), and decay time constant (τdecay) at individual boutons in the indicated genotypes in (C). ****P < 0.0001. (E) Representative averaged trace of the same experiment and genotypes shown in (C) in 0 Cl HL3 saline (wild type, n = 12; vGlut-OE, n = 12). (F) Quantification as described in (D) but of the data shown in (E).

Similar articles

Cited by

References

    1. Turrigiano G., Homeostatic synaptic plasticity: Local and global mechanisms for stabilizing neuronal function. Cold Spring Harb. Perspect. Biol. 4, a005736 (2012). - PMC - PubMed
    1. Pozo K., Goda Y., Unraveling mechanisms of homeostatic synaptic plasticity. Neuron 66, 337–351 (2010). - PMC - PubMed
    1. Delvendahl I., Muller M., Homeostatic plasticity-a presynaptic perspective. Curr. Opin. Neurobiol. 54, 155–162 (2019). - PubMed
    1. Davis G. W., Muller M., Homeostatic control of presynaptic neurotransmitter release. Annu. Rev. Physiol. 77, 251–270 (2015). - PubMed
    1. Wondolowski J., Dickman D., Emerging links between homeostatic synaptic plasticity and neurological disease. Front. Cell. Neurosci. 7, 223 (2013). - PMC - PubMed

LinkOut - more resources