. 2021 Dec 3;7(49):eabj0186.
doi: 10.1126/sciadv.abj0186. Epub 2021 Dec 1.

A neural circuit linking two sugar sensors regulates satiety-dependent fructose drive in Drosophila

Affiliations

A neural circuit linking two sugar sensors regulates satiety-dependent fructose drive in Drosophila

Pierre-Yves Musso et al. Sci Adv. .

Abstract

In flies, neuronal sensors detect prandial changes in circulating fructose levels and either sustain or terminate feeding, depending on internal state. Here, we describe a three-part neural circuit that imparts satiety-dependent modulation of fructose sensing. We show that dorsal fan-shaped body neurons display oscillatory calcium activity when hemolymph glucose is high and that these oscillations require glutamatergic input from SLP-AB or “Janus” neurons projecting from the protocerebrum to the asymmetric body. Suppression of activity in this circuit, either by starvation or by genetic silencing, promotes specific drive for fructose ingestion. This is achieved through neuropeptidergic signaling by tachykinin, which is released from the fan-shaped body when glycemia is high. Tachykinin, in turn, signals to Gr43a-positive fructose sensors to modulate their response to fructose. Together, our results demonstrate how a three-layer neural circuit links the detection of two sugars to produce precise satiety-dependent control of feeding behavior.


Figures

Fig. 1.
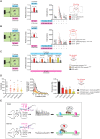
Fig. 1.. Starvation regulates FB oscillations.
(A) Schematic of imaging preparation to monitor calcium oscillations (left) with GCaMP6f signal from R70H05-GAL4 expression in the dFB (right). (B) Calcium traces from R70H05-GAL4 > UAS-GCamP6f flies after different periods of starvation or expressing RNAi against Glut1 or HexC. (C) Amplitudes of dFB oscillations. (D) Power spectra of dFB oscillations. (E) Frequencies of dFB oscillations. (F) Model: In sated flies, d-glucose enters the dFB neurons through Glut1 and triggers oscillations through the activity of HexC; in starved flies, the low availability of d-glucose prevents oscillations. Values represent mean ± SEM. n = 19 to 27. Statistical tests: one-way analysis of variance (ANOVA) and Tukey post hoc; different letters represent significant differences P < 0.05.
Fig. 2.
Fig. 2.. Silencing dFB neurons increases fructose feeding.
(A) Immunofluorescent detection of UAS-GFP driven by R70H05-GAL4. (B) Experimental timeline: Flies are placed at 29°C for 47 hours and starved for 18 hours, and experiments are performed at 25°C . (C) Experimental setup: One channel is filled with sugar and the other one is filled with 1% agar. (D) Effect of dFB neuron silencing on interactions with various concentrations of sucrose (5, 50, and 1000 mM; n = 16 to 21). UAS-Kirts represents UAS-Kir2.1 plus tub-Gal80ts. (E) Effect of dFB neuron silencing on interactions with various concentrations of l-glucose (5, 50, and 1000 mM; n = 10 to 19). (F) Effect of dFB neuron silencing on interactions with 50 mM d-sorbitol (n = 15). (G) Effect of dFB neuron silencing on interactions with 50 mM l-glucose mixed with various concentrations of d-sorbitol (0, 5, 50, 200, and 1000 mM; n = 10 to 16). (H) Effect of dFB neuron silencing on interactions with various concentrations of d-glucose (5, 50, and 1000 mM; n = 8 to 26). (I) Effect of dFB neuron silencing on flies’ interactions with various concentrations of fructose (5, 50, and 1000 mM; n = 11 to 17). Values represent mean ± SEM. Statistical tests: one-way ANOVA and Tukey post hoc; ns, P > 0.05; *P < 0.05; **P < 0.01; ***P < 0.001.
Fig. 3.
Fig. 3.. Fructose feeding preference relies on starvation.
(A) Experimental setup: The left channel is filled with fructose and the right channel is filled with the same concentration of d-glucose. (B) Effect of dFB neuron silencing on flies’ preference between fructose and d-glucose at different concentrations after 20-hour starvation (left) and their corresponding interactions (right; n = 13 to 21). (C) Experimental setup: Flies are starved for different amounts of time and given the choice between 50 mM fructose and 50 mM d-glucose. (D) Effect of starvation length on preference between 50 mM fructose and 50 mM d-glucose in controls and flies with silenced dFB neurons (n = 21 to 36). (E) Refeeding 30-hour starved flies with 500 mM d-glucose for 30 min restores oscillations in dFB, while 500 mM fructose does not (n = 23). (F) Effect of knocking down Glut1 in dFB neurons on the preference between 50 mM fructose and d-glucose after 20-hour starvation (n = 19 to 23). (G) Effect of HexC knockdown in dFB neurons on preference between 50 mM fructose and d-glucose after 20-hour starvation (n = 15 to 18). (H) Model for regulation of fructose preference by dFB activity. Values represent mean ± SEM. Statistical tests: one-way ANOVA and Tukey post hoc; ns, P > 0.05; **P < 0.01; ***P < 0.001.
Fig. 4.
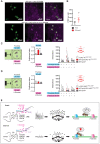
Fig. 4.. Janus neurons contact dFB neurons on the asymmetric body and modulate oscillations.
(A) Immunofluorescent detection of UAS-Syt (green) and UAS-DenMark (magenta) driven by R70H05-GAL4. Arrows show dendritic compartment localized on the asymmetric body. (B) Immunofluorescent detection of UAS-GFP driven by Janus split-GAL4. Arrows show projections to the asymmetric body. (C) Trans-Tango expression driven by Janus split-Gal4. Arrows show the contact between Janus neurons and postsynaptic targets, and the dotted line outlines trans-Tango expression in the FB layer 8. (D) GRASP between dFB and Janus neurons produces a signal at the asymmetric body. (E) Calcium trace from R70H05-GAL4 > UAS-GCamP6f (top) and R70H05-GAL4; R72A10-LexA > UAS-GCamP6f; LexAop-tnt (bottom) fed flies. (F) Amplitudes of oscillations. (G) Power spectra of oscillations. (H) Frequencies of oscillations. Imaging data are from ROI placed in the middle part of dFB neurons. Values represent mean ± SEM. n = 23 to 25. Statistical test: t test, ***P < 0.001.
Fig. 5.
Fig. 5.. Janus neurons act on dFB via glutamate acting on multiple receptors.
(A) Effect of silencing Janus neurons on preference between fructose and d-glucose after 20-hour starvation and their corresponding interactions (n = 13 to 14). (B) Effect of Vglut knockdown in Janus neurons on preference between fructose and d-glucose after 20-hour starvation and their corresponding interactions (n = 16 to 19). (C) Effect of knocking down GluClα, KaiR1D, NmdaR1, and NmdaR2 in dFB neurons on preference between fructose and d-glucose after 20-hour starvation and their corresponding interactions (for GluClα, n = 14 to 19; KaiR1D, n = 25 to 28; NmdaR1, n = 18 to 20; NmdaR2, n = 23 to 24). (D) Knocking down GluClα, KaiR1D, NmdaR1, and NmdaR2 in dFB neurons moderately inhibits oscillations in fed flies (for controls, n = 21; GluClα, n = 25; KaiR1D, n = 23; NmdaR1, n = 29; NmdaR2, n = 31). (E) Glutamatergic input from Janus neurons is permissive for dFB oscillations. Values represent mean ± SEM. Statistical tests: one-way ANOVA and Tukey post hoc; ns, P > 0.05; *P < 0.05; **P < 0.01; ***P < 0.001.
Fig. 6.
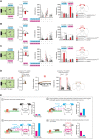
Fig. 6.. dFB neurons regulate fructose-feeding preference through tachykinin release.
(A) Immunofluorescent detection of UAS-GFP (green) driven by dFB-split and tachykinin (magenta) in the dFB cell bodies in fed flies (top) and flies starved for 30 hours (bottom). (B) Tachykinin peptide levels are lower in fed flies compared to flies starved for 30 hours (n = 17). CTCF, corrected total cell fluorescence. (C) Effect of knocking down tachykinin in dFB neurons on preference between fructose and d-glucose after 20-hour starvation and their corresponding interactions (n = 16 to 20). (D) Effect of sNPF knockdown in dFB neurons on preference between fructose and d-glucose after 20-hour starvation and their corresponding interactions (n = 14 to 18). (E) Tachykinin secretion in sated flies inhibits fructose feeding preference. Values represent mean ± SEM. Statistical tests: one-way ANOVA, Tukey post hoc for behavior, and t test for peptides levels. ns, P > 0.05; ***P < 0.001.
Fig. 7.
Fig. 7.. Tachykinin acts through TkR99D to regulate Gr43a brain neurons and fructose-feeding preference.
(A) Effect of TkR99D knockdown in Gr43a brain neurons on preference between fructose and d-glucose after 20-hour starvation and their corresponding interactions (n = 18 to 26). (B) Effect of TkR86C knockdown in Gr43a brain neurons on preference between fructose and d-glucose after 20-hour starvation and their corresponding interactions (n = 14 to 19). (C) Model: Tachykinin secretion in sated flies inhibits fructose feeding preference by acting on TkR99D expressed in Gr43a neurons. Values represent mean ± SEM. Statistical tests: one-way ANOVA and Tukey post hoc. ns, P > 0.05; *P < 0.05; ***P < 0.001.
Fig. 8.
Fig. 8.. Gr43a brain neurons acutely regulate feeding.
(A) Effect of Gr43a brain neuron silencing on preference between fructose and d-glucose after 24-hour starvation and their corresponding interactions (n = 15 to 19). (B) Effect of Gr43a knockdown in Gr43a brain neurons on preference between fructose and d-glucose after 20-hour starvation and their corresponding interactions (n = 22 to 28). (C) Effect of Gr64a knockdown in Gr43a brain neurons on preference between fructose and d-glucose after 20-hour starvation and their corresponding interactions (n = 19 to 22). (D) Closed-loop activation of Gr43a brain neurons in the STROBE produces preference for the light-triggering food after 20-hour starvation, with corresponding interactions (n = 40 to 41). (E) Model for how fructose serves as a cue for promoting sugar ingestion and how rising glucose levels signal satiety through dFB neurons, which then inhibit sensitivity to fructose and terminate feeding. Values represent mean ± SEM. Statistical tests: one-way ANOVA, Tukey post hoc, and t test for CsChrimson experiment. ns, P > 0.05; *P < 0.05; ***P < 0.001.

Similar articles

Cited by

References

    1. Le M. T., Frye R. F., Rivard C. J., Cheng J., McFann K. K., Segal M. S., Johnson R. J., J. A. Johnson, Effects of high-fructose corn syrup and sucrose on the pharmacokinetics of fructose and acute metabolic and hemodynamic responses in healthy subjects. Metabolism 61, 641–651 (2012). - PMC - PubMed
    1. Payant M. A., Chee M. J., Neural mechanisms underlying the role of fructose in overfeeding. Neurosci. Biobehav. Rev. 128, 346–357 (2021). - PubMed
    1. Merino B., Fernández-Díaz C. M., Cózar-Castellano I., Perdomo G., Intestinal fructose and glucose metabolism in health and disease. Nutrients 12, 94 (2019). - PMC - PubMed
    1. Niwano Y., Adachi T., Kashimura J., Sakata T., Sasaki H., Sekine K., Yamamoto S., Yonekubo A., Kimura S., Is glycemic index of food a feasible predictor of appetite, hunger, and satiety? J. Nutr. Sci. Vitaminol. 55, 201–207 (2009). - PubMed
    1. Dus M., Min S., Keene A. C., Lee G. Y., Suh G. S. B., Taste-independent detection of the caloric content of sugar in Drosophila. Proc. Natl. Acad. Sci. U.S.A. 108, 11644–11649 (2011). - PMC - PubMed

LinkOut - more resources