. 2021 Dec;13(622):eabg2919.
doi: 10.1126/scitranslmed.abg2919. Epub 2021 Dec 1.

The CD22-IGF2R interaction is a therapeutic target for microglial lysosome dysfunction in Niemann-Pick type C

Affiliations

The CD22-IGF2R interaction is a therapeutic target for microglial lysosome dysfunction in Niemann-Pick type C

John V Pluvinage et al. Sci Transl Med. 2021 Dec.

Abstract

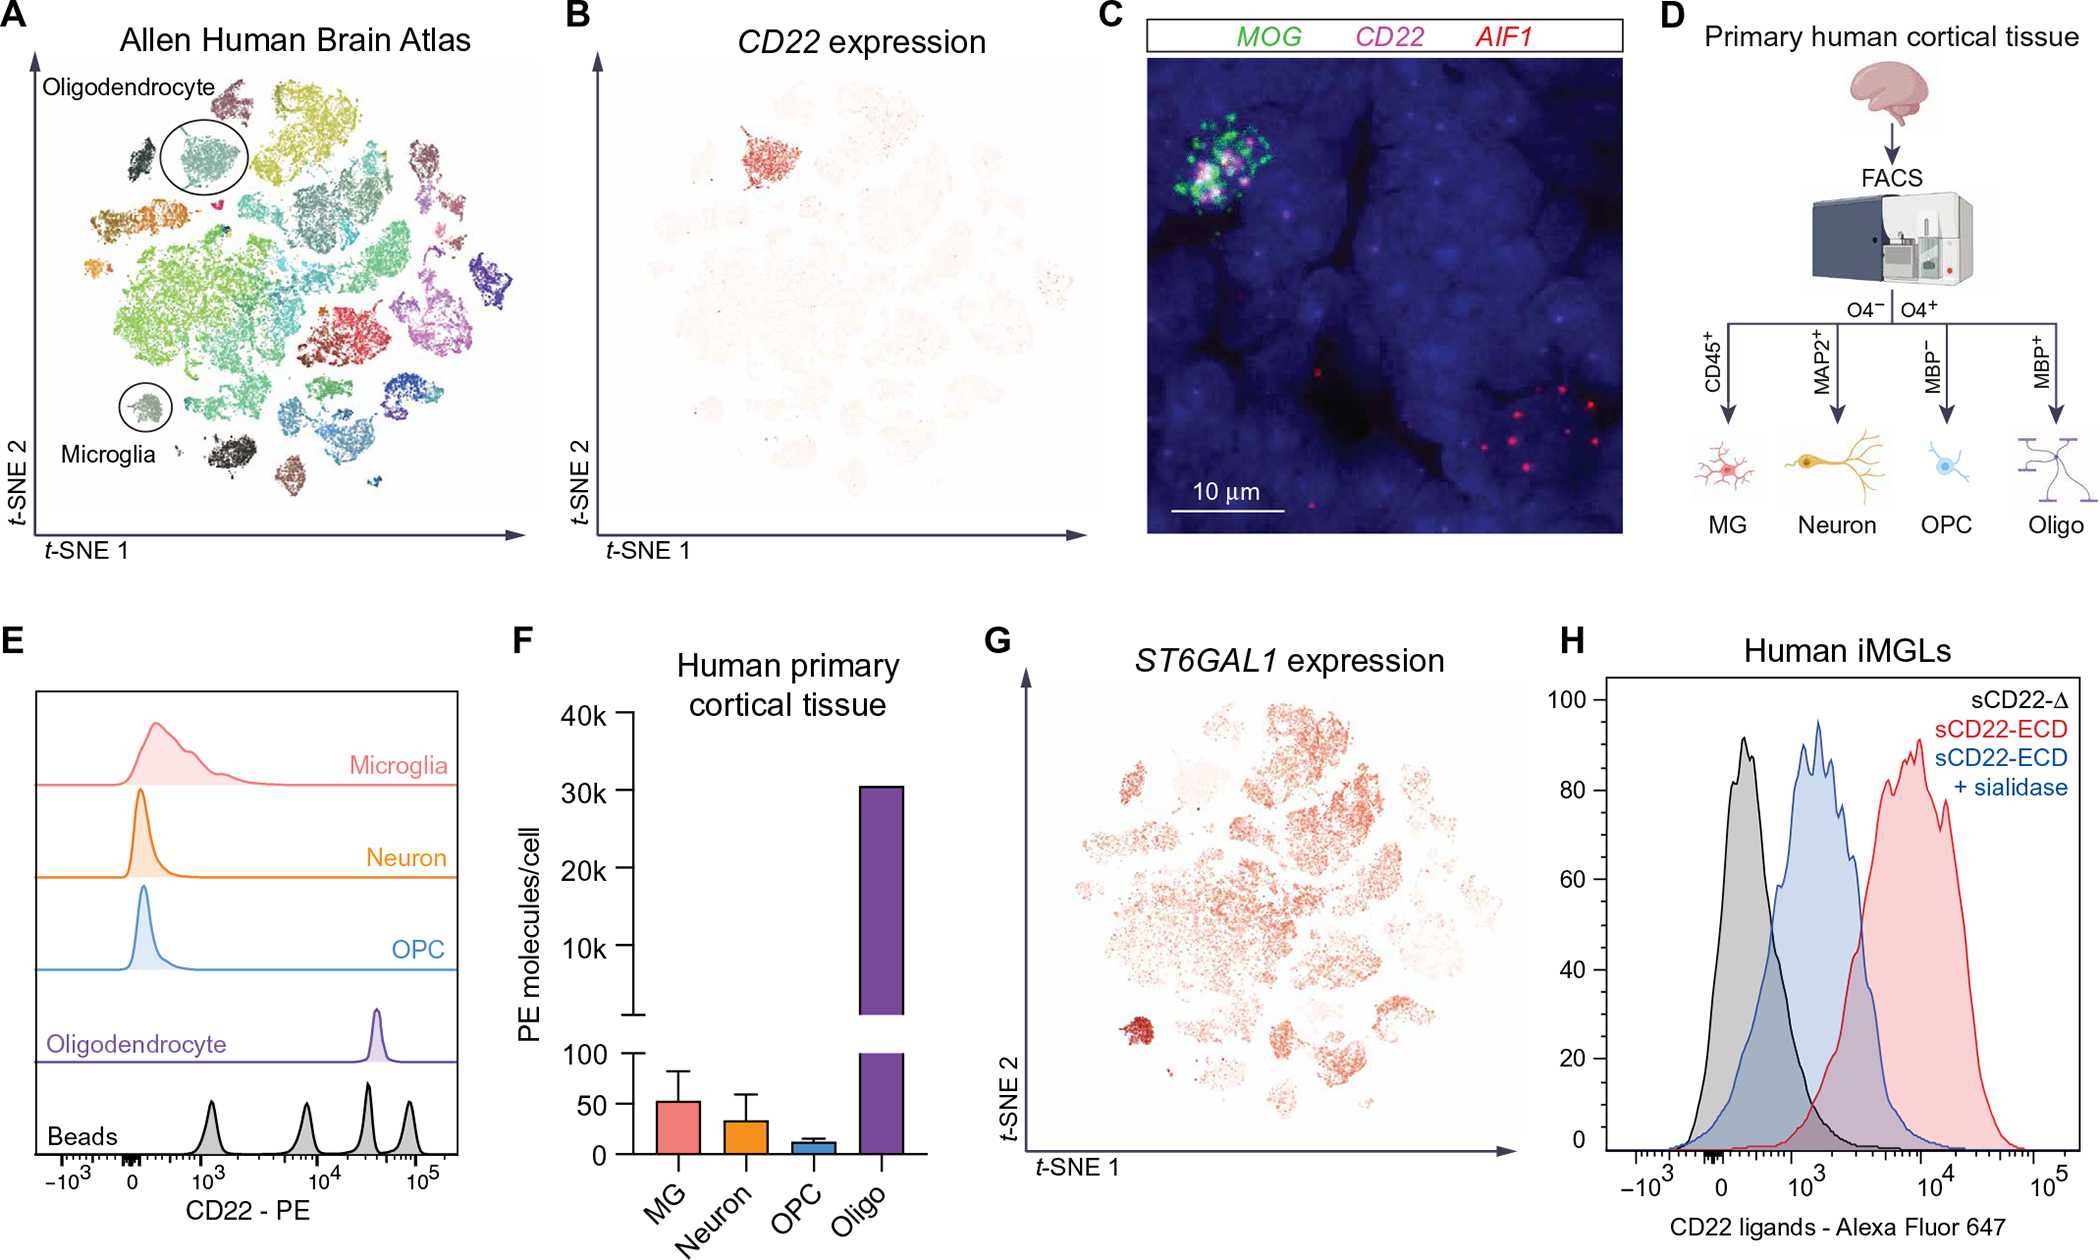
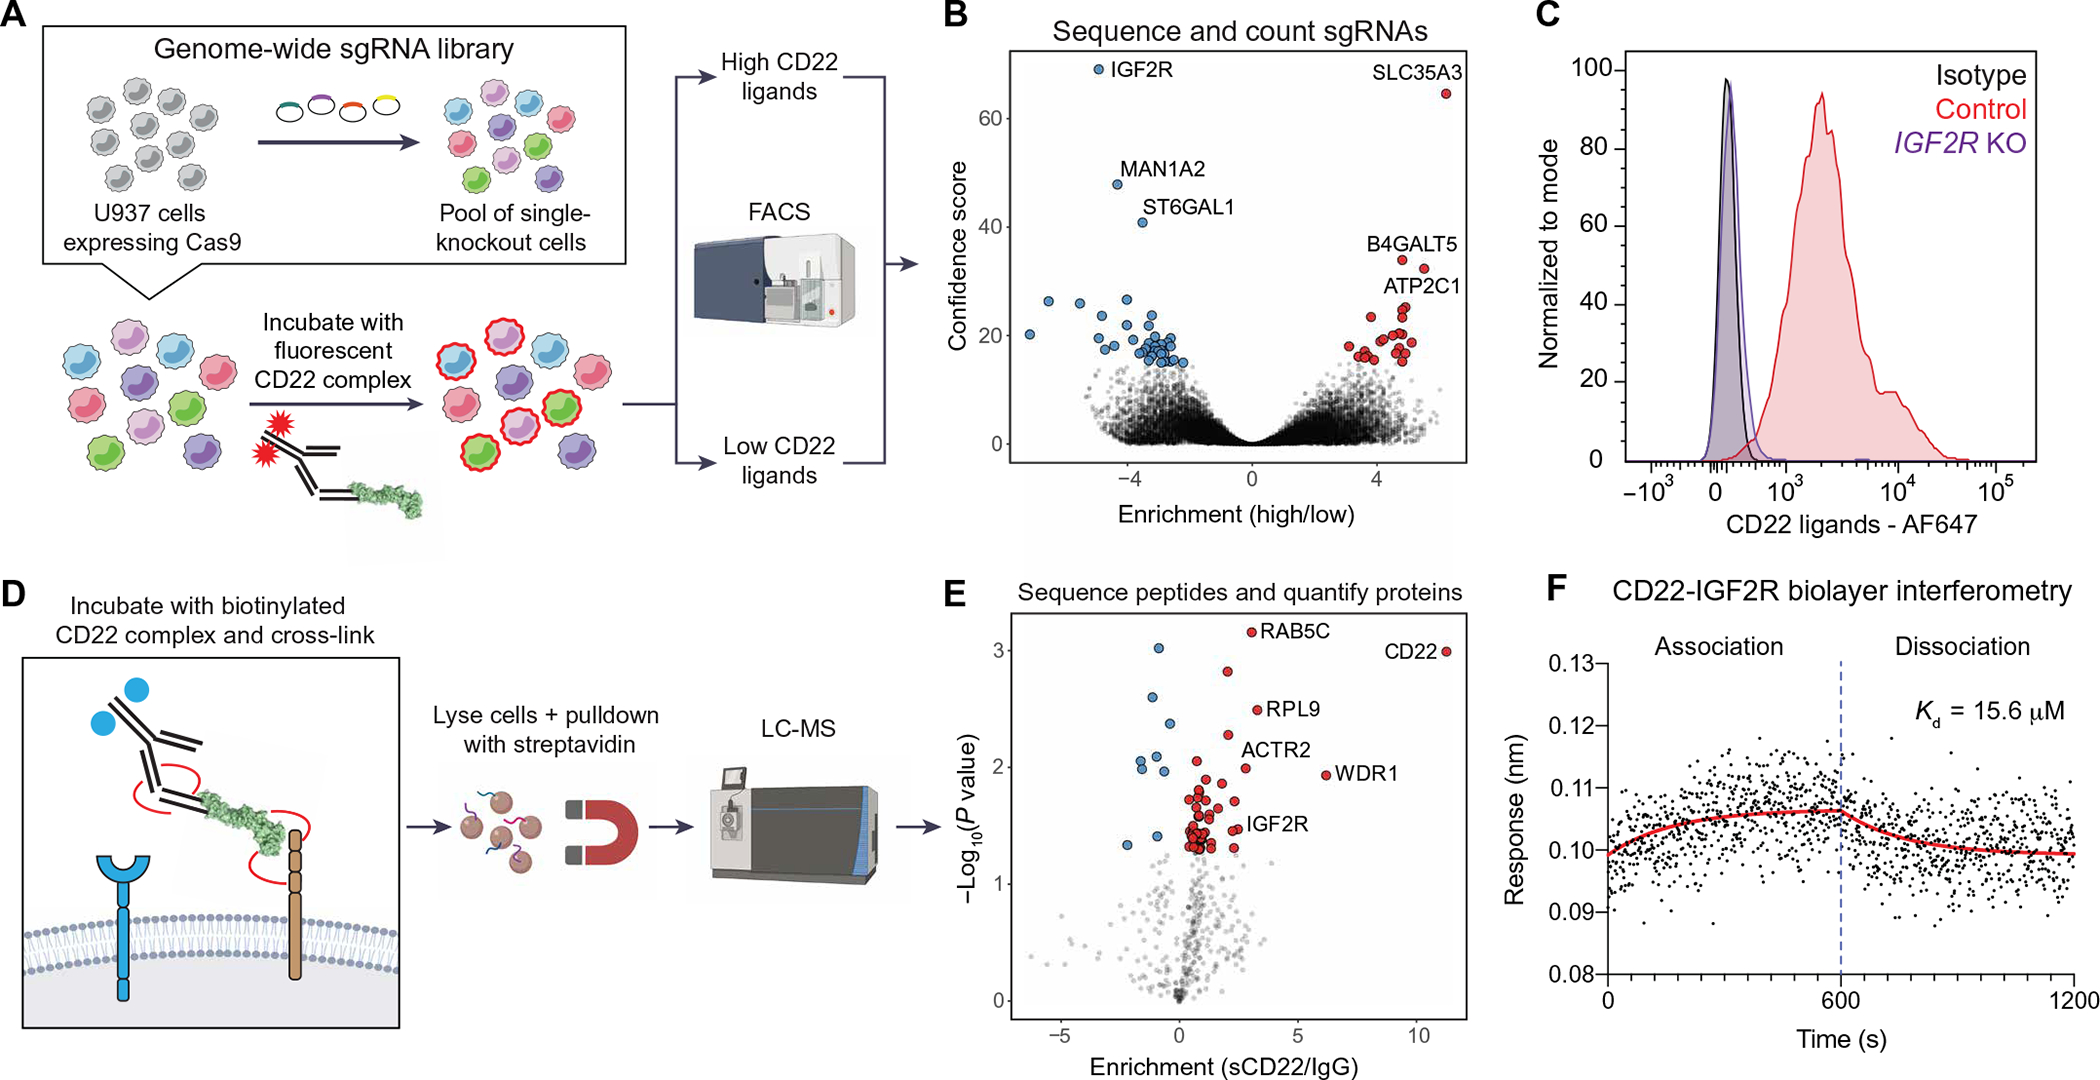
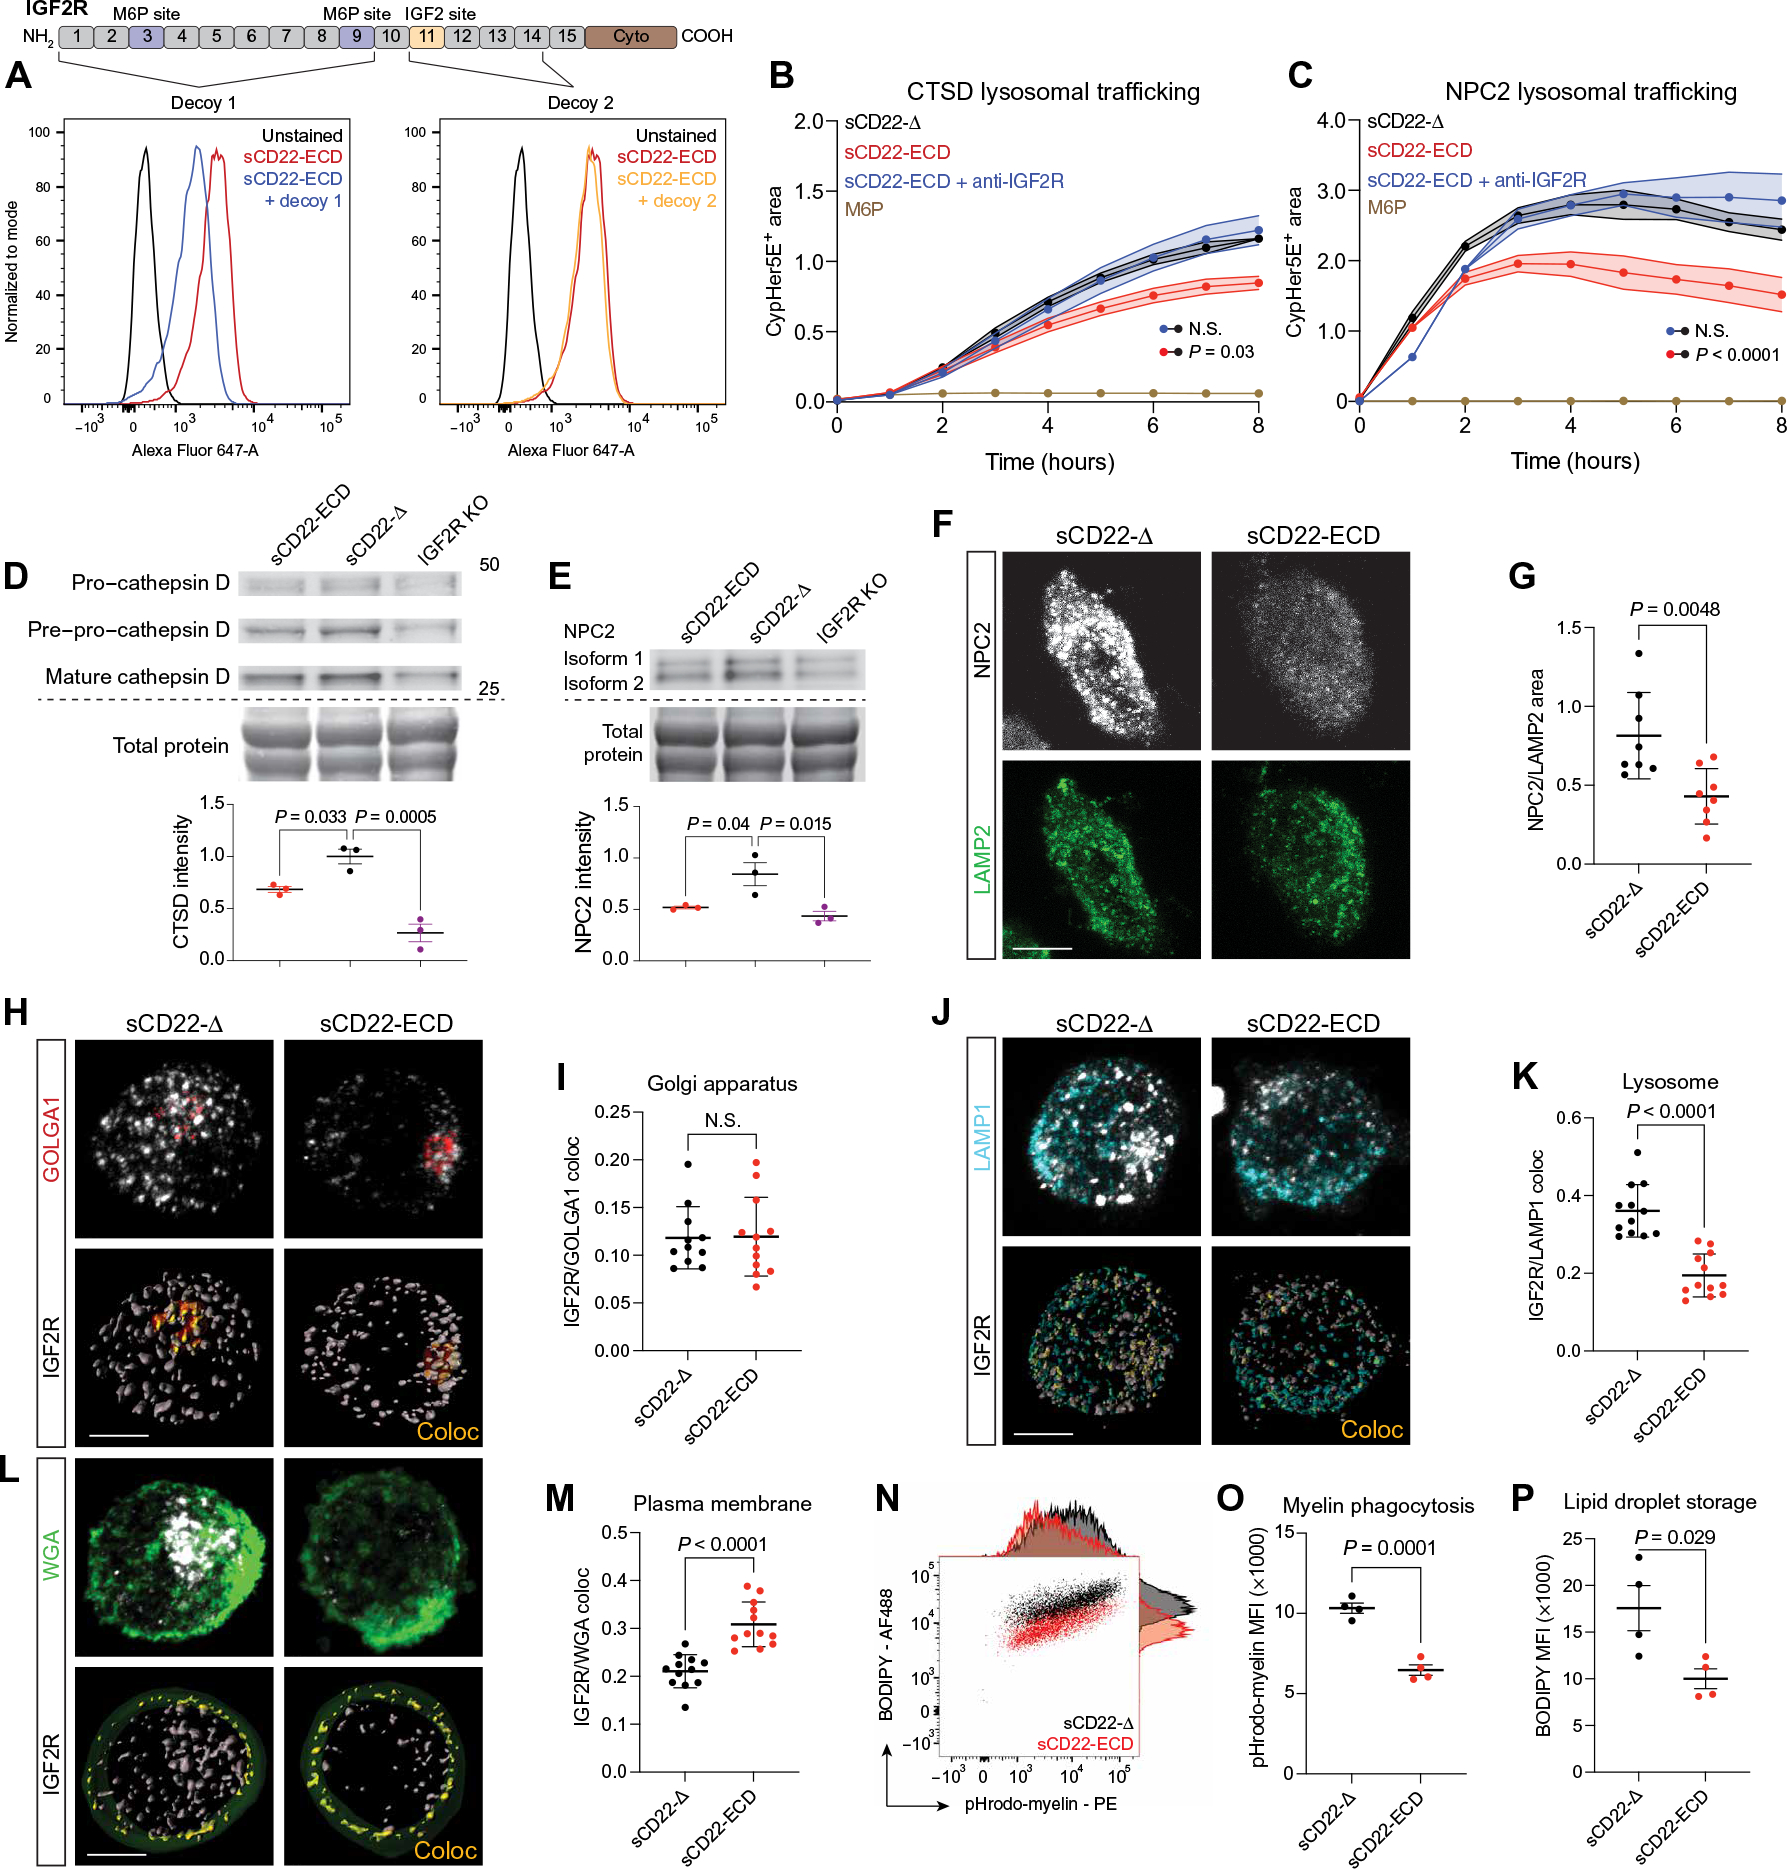
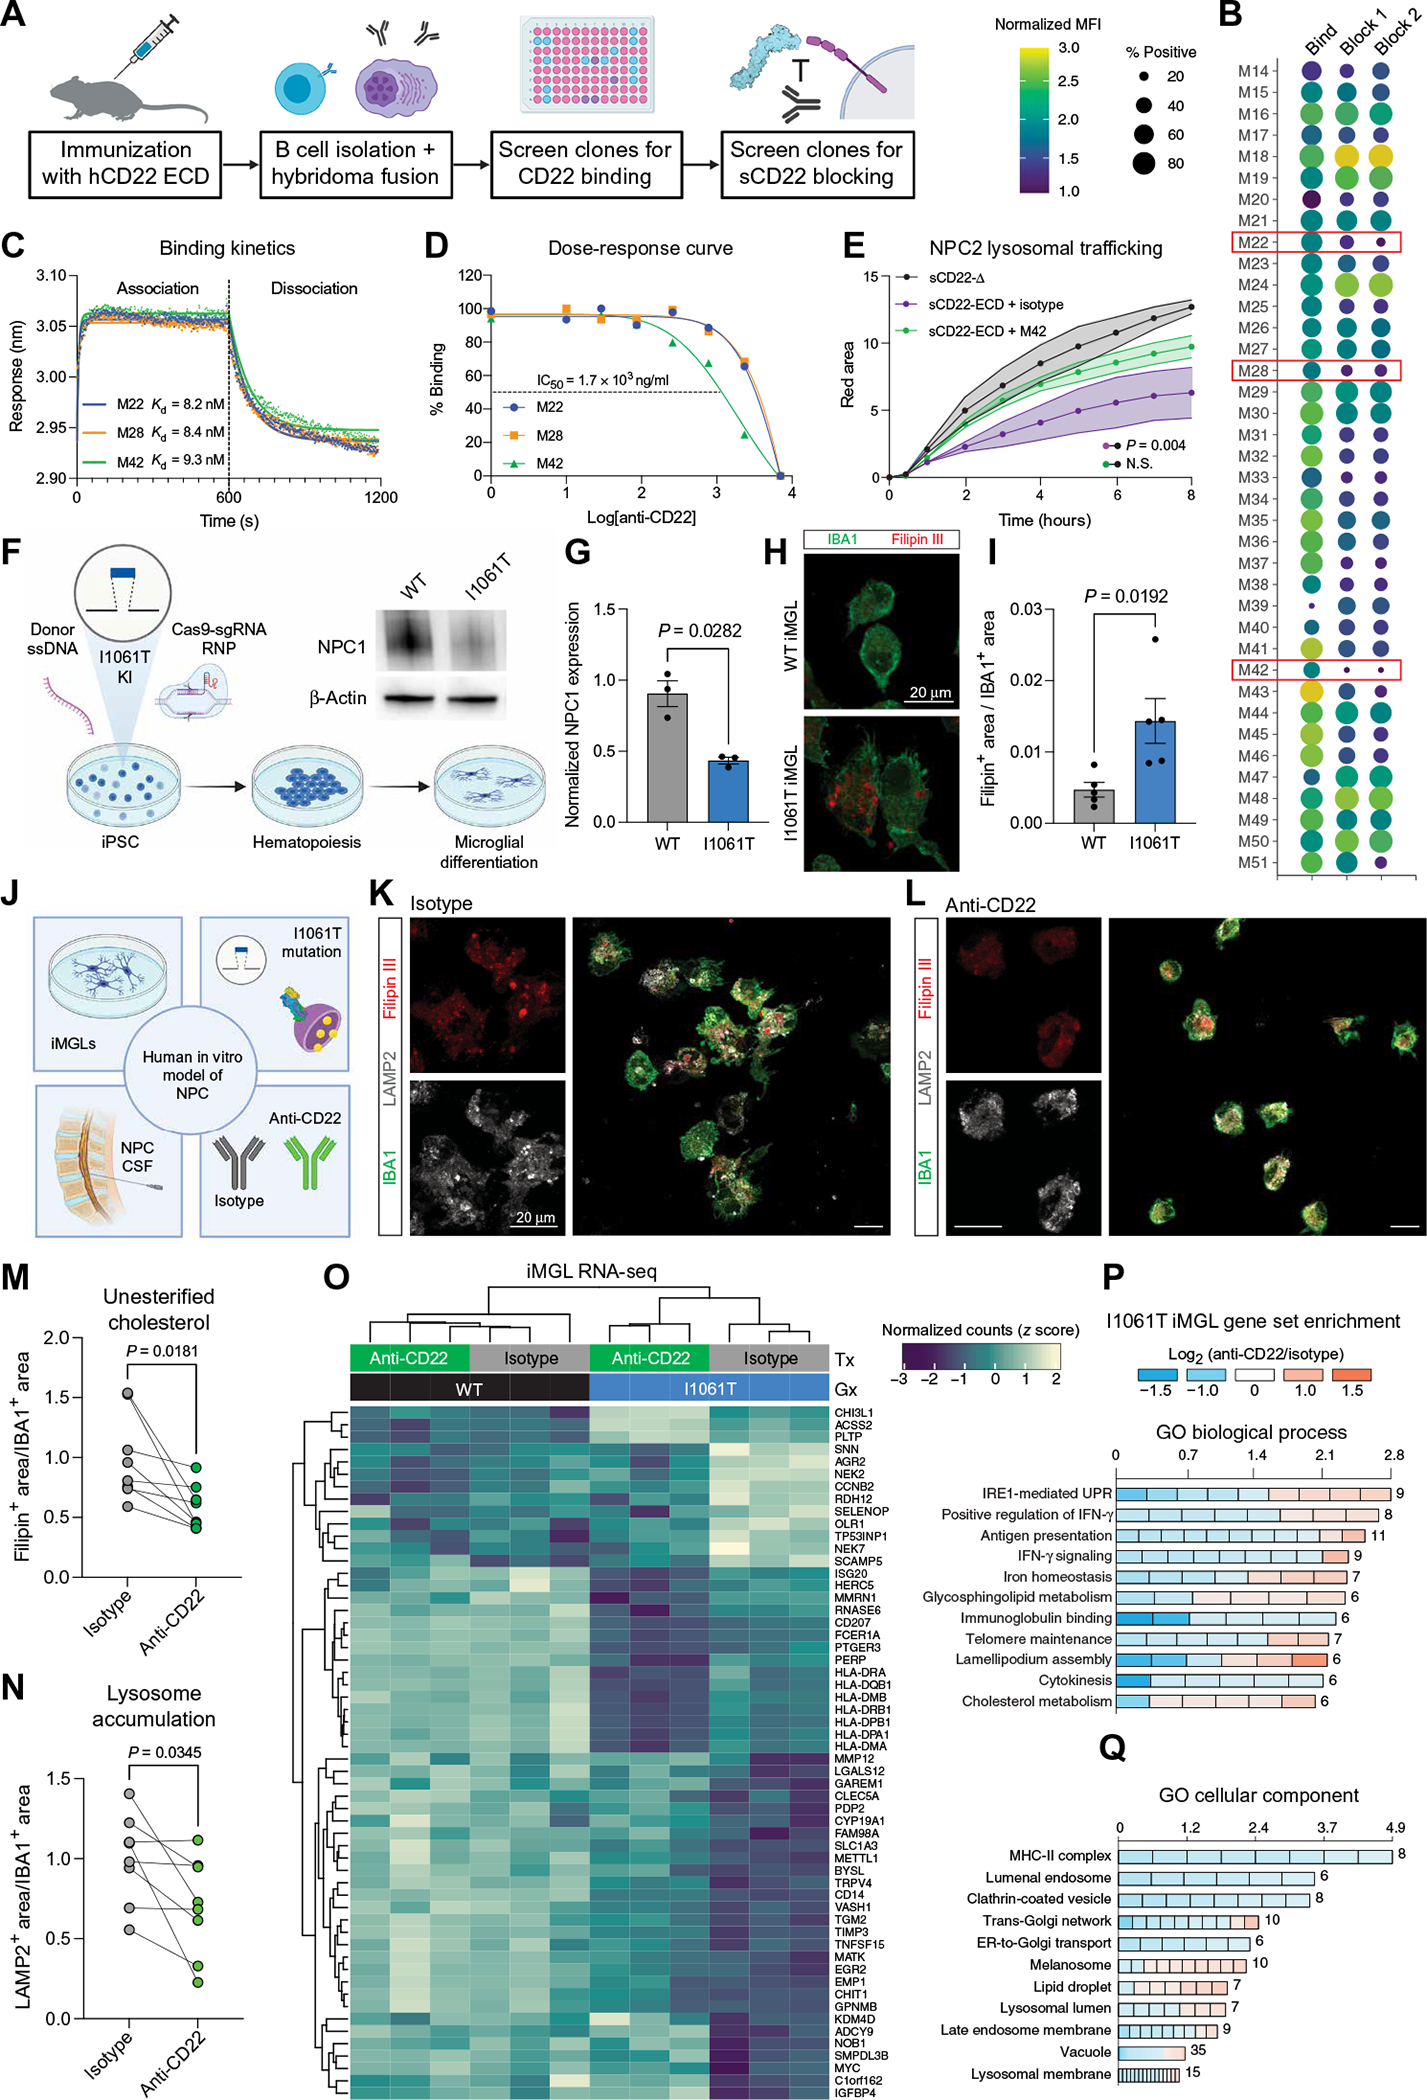
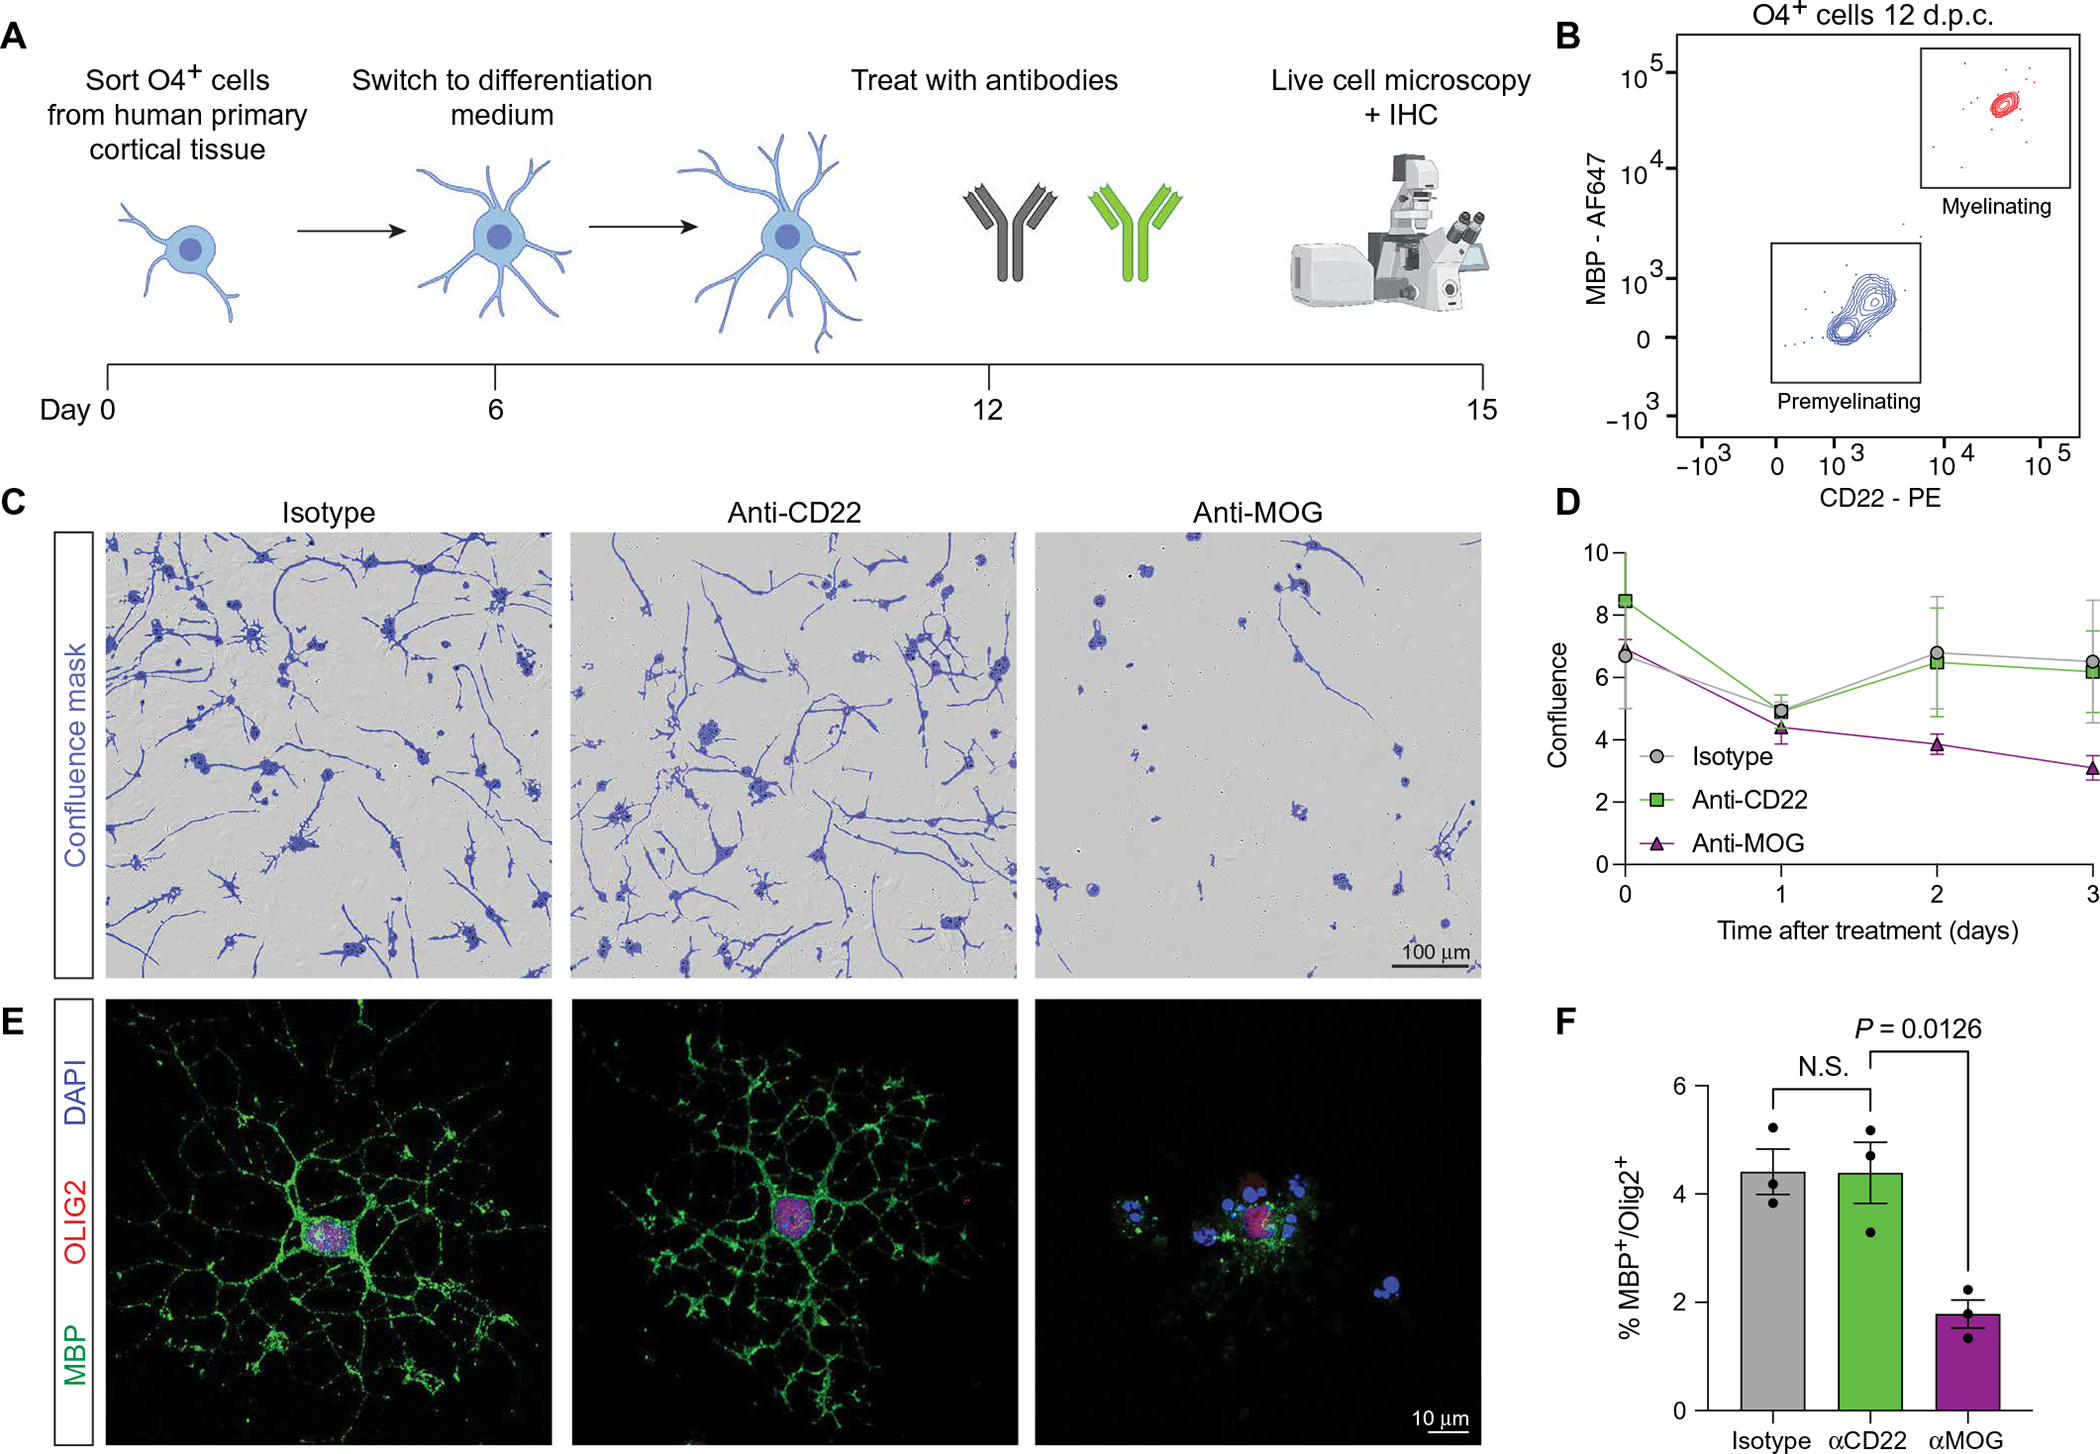
Lysosome dysfunction is a shared feature of rare lysosomal storage diseases and common age-related neurodegenerative diseases. Microglia, the brain-resident macrophages, are particularly vulnerable to lysosome dysfunction because of the phagocytic stress of clearing dying neurons, myelin, and debris. CD22 is a negative regulator of microglial homeostasis in the aging mouse brain, and soluble CD22 (sCD22) is increased in the cerebrospinal fluid of patients with Niemann-Pick type C disease (NPC). However, the role of CD22 in the human brain remains unknown. In contrast to previous findings in mice, here, we show that CD22 is expressed by oligodendrocytes in the human brain and binds to sialic acid–dependent ligands on microglia. Using unbiased genetic and proteomic screens, we identify insulin-like growth factor 2 receptor (IGF2R) as the binding partner of sCD22 on human myeloid cells. Targeted truncation of IGF2R revealed that sCD22 docks near critical mannose 6-phosphate–binding domains, where it disrupts lysosomal protein trafficking. Interfering with the sCD22-IGF2R interaction using CD22 blocking antibodies ameliorated lysosome dysfunction in human NPC1 mutant induced pluripotent stem cell–derived microglia-like cells without harming oligodendrocytes in vitro. These findings reinforce the differences between mouse and human microglia and provide a candidate microglia-directed immunotherapeutic to treat NPC.


Conflict of interest statement

Competing interests: C.R.B. is a cofounder and Scientific Advisory Board member of Lycia Therapeutics, Palleon Pharmaceuticals, Enable Bioscience, InterVenn Bio, and Redwood Bioscience (a subsidiary of Catalent) and a member of the Board of Directors of Eli Lilly and Company. M.B.-J. is a cofounder of NovoGlia Inc. and coinventor of patent application WO/2018/160496, related to the differentiation of stem cells into microglia. T.W.-C., J.V.P., M.S.H., and C.R.B. are coinventors on a patent application related to the work in this paper (US16/956,339, “Compositions and methods for treating age related disesases”). T.W.-C. and J.V.P. are coinventors on a patent application related to the work in this paper (PCT/US21/32875, “Compositions and methods for treating lysosomal storage disorders”).

Figures

Fig. 1.
Fig. 1.. Oligodendrocyte-derived sCD22 binds sialic acid ligands on microglia.
(A) t-distributed stochastic neighbor embedding (t-SNE) visualization of snRNA-seq data (Smart-seq) from multiple cortical areas of human brain colored by cell type. Data from Allen Brain Atlas (19). (B) t-SNE visualization of snRNA-seq data from multiple cortical areas of human brain colored by CD22 expression. (C) Representative image of human brain tissue probed for MOG (green), CD22 (magenta), and AIF1 (red) transcripts by multiplexed fluorescent RNAscope. Clustered puncta within 4′,6-diamidino-2-phenylindole–positive nuclei suggest true signal. (D) Schematic of FACS analysis of various cell types from fresh human primary cortical tissue. (E) Flow cytometry analysis of surface CD22 protein expression in CD45+ microglia (pink), MAP2+ neurons (orange), O4+MBP OPCs (blue) and O4+MBP+ oligodendrocytes (purple) from fresh human primary cortical tissue (PCW 22). PE quantification beads are shown in gray. (F) Quantification of CD22-PE molecules bound to the surface of various human brain cell types calculated using PE bead standards (n = 2 biological replicates; PCWs 20 to 22; O4+MBP+ cells only detected at PCW 22). (G) t-SNE visualization of snRNA-seq data from multiple cortical areas of human brain colored by ST6GAL1 expression. (H) Flow cytometry analysis of human iMGLs stained with fluorophore-conjugated CD22 lacking its sialic acid–binding domain (sCD22-Δ, gray) or the full-length CD22 ECD (sCD22-ECD, red). In one condition, cells were pretreated with sialidase before sCD22-ECD staining (blue).
Fig. 2.
Fig. 2.. Genetic and proteomic screens elucidate CD22-IGF2R interaction.
(A) Schematic of CRISPR-Cas9 screen for genetic modifiers of sCD22 binding. (B) Volcano plot of hits from CRISPR-Cas9 screen, highlighting KOs that inhibit CD22 binding (blue) and promote CD22 binding (red). (C) Flow cytometry analysis of CD22 ligand expression on U937 cells infected with a safe-targeting sgRNA (control, red) or an IGF2R-targeting sgRNA (purple). Isotype control–stained WT cells are shown in gray. AF647, Alexa Fluor 647. (D) Schematic of affinity purification LC-MS screen for direct binding partners of sCD22. (E) Volcano plot of hits from affinity purification LC-MS screen, highlighting proteins enriched in the CD22-bound fraction (red). (F) Kinetics of the CD22-IGF2R interaction determined by biolayer interferometry. Red line shows nonlinear fit of association-dissociation curve. Kd, dissociation constant.
Fig. 3.
Fig. 3.. CD22 impairs M6P-dependent lysosomal trafficking.
(A) Flow cytometry analysis of U937 cells stained with sCD22-ECD alone (red) or sCD22 precomplexed with a decoy peptide comprising the M6P-binding sites (blue) or the IGF2 site (orange) on IGF2R. (B) Time-lapse fluorescence microscopy analysis of cathepsin D trafficking to lysosomes in U937 cells treated with sCD22-Δ (black), sCD22-ECD (red), sCD22-ECD, and anti-IGF2R (blue) or saturating amounts of M6P (brown) (n = 3, ANOVA, means ± SEM). N.S., not significant. (C) Time-lapse fluorescence microscopy analysis of NPC2 trafficking to lysosomes in U937 cells treated with sCD22-Δ (black), sCD22-ECD (red), sCD22-ECD and anti-IGF2R (blue), or saturating amounts of M6P (brown) (n = 2, ANOVA, means ± SEM). (D) Western blot analysis of CTSD proteoform expression in WT and IGF2R KO U937 cells treated with sCD22-ECD or sCD22-Δ for 24 hours. Equal loading was confirmed across lanes by total protein stain (n = 3, one-way ANOVA, means ± SEM). (E) Western blot analysis of NPC2 expression in WT and IGF2R KO U937 cells treated with sCD22-ECD or sCD22-Δ for 24 hours. Equal loading was confirmed across lanes by total protein stain (n = 3, one-way ANOVA, means ± SEM). (F) Representative images of NPC2 (gray) and LAMP2 (green) expression in U937 cells treated with sCD22-Δ or sCD22-ECD. Scale bar, 5 μm. (G) Proportion of NPC2+ area to LAMP2+ area in U937 cells treated with sCD22-Δ or full-length sCD22-ECD (n = 8, t test, means ± SD). (H) Representative images of IGF2R (gray) colocalization (Coloc) (yellow) with the Golgi marker GOLGA1 (red) in U937 cells treated with sCD22-Δ or sCD22-ECD. Scale bar, 5 μm. (I) Proportion of IGF2R localized to the Golgi in U937 cells treated with sCD22-Δ or sCD22-ECD (n = 3 biological replicates, three to four cells quantified per replicate, t test, means ± SD). (J) Representative images of IGF2R (gray) colocalization (yellow) with the lysosomal marker LAMP1 (cyan) in U937 cells treated with sCD22-Δ or sCD22-ECD. Scale bar, 5 μm. (K) Proportion of IGF2R localized to the lysosome in U937 cells treated with sCD22-Δ or sCD22-ECD (n = 3 biological replicates, two to three cells quantified per replicate, t test, means ± SD). (L) Representative images of IGF2R (gray) colocalization (yellow) with wheat germ agglutinin (WGA) cell surface staining (green) in U937 cells treated with sCD22-Δ or sCD22-ECD. Scale bar, 5 μm. (M) Proportion of IGF2R localized to the cell surface in U937 cells treated with sCD22-Δ or sCD22-ECD (n = 3 biological replicates, three to four cells quantified per replicate, t test, means ± SD). (N) Flow cytometry analysis of iMGLs treated with sCD22-Δ or sCD22-ECD, incubated with pHrodo-myelin for 24 hours, and stained with BODIPY, with corresponding histograms. (O) Quantification of phagocytosis by pHrodo-myelin mean fluorescence intensity (MFI) in iMGLs treated with sCD22-Δ or sCD22-ECD (n = 4, t test, means ± SEM). (P) Quantification of lipid droplet storage by BODIPY MFI in iMGLs treated with sCD22-Δ or sCD22-ECD (n = 4, t test, means ± SEM).
Fig. 4.
Fig. 4.. Generation of a CD22 antibody that ameliorates lysosome dysfunction.
(A) Schematic of mAb generation and screening pipeline. (B) Screening results of 38 mAb clones for binding to CD22 (first column) and blocking of sCD22 to IGF2R on cell surface (second and third columns are two independent experiments). Three clones with adequate binding and potent blocking are highlighted (M22, M28, and M42). (C) Association-dissociation curves of antibody candidates binding to CD22 determined by biolayer interferometry. (D) Dose-response curves of CD22-IGF2R blockade by antibody candidates determined by flow cytometry. IC50, median inhibitory concentration. (E) Time-lapse fluorescence microscopy analysis of NPC2 trafficking to lysosomes in U937 cells treated with sCD22-Δ (gray), sCD22-ECD and an isotype control antibody (purple), or sCD22-ECD and clone M42 (green) (n = 2, ANOVA, means ± SEM). (F) Schematic of pipeline to generate isogenic WT and I1061T mutant iMGLs from iPSCs edited by CRISPR-Cas9–directed homologous recombination. After introduction of donor single-stranded DNA (ssDNA) by electroporation, a homozygous T3182C nucleotide substitution was confirmed by Sanger sequencing. NPC1 reduction was confirmed by Western blot. Mutant and isogenic control iPSCs were subsequently directed toward a hematopoietic lineage and differentiated into microglia-like cells. (G) Western blot quantification of NPC1 expression normalized to a loading control (β-actin) in WT and I1061T mutant iPSCs (n = 3, t test, means ± SEM). (H) Representative images of WT and I1061T mutant iMGLs stained for Filipin III (red, unesterified cholesterol) and IBA1 (green, microglia marker). Scale bar, 20 μm. (I) Quantification of Filipin-positive area normalized to total IBA1-positive area in WT (gray) and I1061T mutant (blue) iMGLs (n = 5 biological replicates, t test, means ± SEM). (J) Schematic of human in vitro model of microglia in NPC. Three components (iPSC-derived microglia, I1061T patient mutation, and NPC patient CSF) were combined to test the proof-of-principal in vitro efficacy of anti-CD22 in NPC. (K) Representative images of I1061T mutant iMGLs treated with NPC CSF and an isotype control antibody stained for Filipin III (red, unesterified cholesterol), LAMP2 (gray, lysosome marker), and IBA1 (green, microglia marker). Scale bars, 20 μm. (L) Representative images of I1061T mutant iMGLs treated with NPC CSF and anti-CD22 stained for Filipin III (red, unesterified cholesterol), LAMP2 (gray, lysosome marker), and IBA1 (green, microglia marker). Scale bars, 20 μm. (M) Quantification of Filipin-positive area normalized to total IBA1-positive area in isotype (gray)– and anti-CD22 (green)–treated iMGLs (n = 7 biological replicates, paired t test, means ± SEM; lines connect wells treated with the same patient’s CSF). (N) Quantification of LAMP2-positive area normalized to total IBA1-positive area in isotype (gray)– and anti-CD22 (green)–treated iMGLs (n = 7 biological replicates, paired t test, means ± SEM; lines connect wells treated with the same patient’s CSF). (O) Heatmap of normalized counts (z score) for differentially expressed genes in WT and I1061T mutant iMGLs treated with NPC CSF and isotype or anti-CD22. (P) Gene Ontology (GO) biological process enrichment analysis of differentially expressed genes between anti-CD22− and isotype–treated I1061T iMGLs. Up- or down-regulation is represented on the color scale, and the number of genes differentially expressed is indicated for each term. IRE1, inositol-requiring enzyme 1; IFN-γ, interferon-γ; UPR, unfolded protein response. (Q) GO cellular component enrichment analysis of differentially expressed genes between anti-CD22− and isotype–treated I1061T iMGLs. Up- or down-regulation is represented on the color scale, and the number of genes differentially expressed is indicated for each term. MHC-II, major histocompatibility complex class II; ER, endoplasmic reticulum.
Fig. 5.
Fig. 5.. CD22 blockade does not disrupt oligodendrocyte maturation in vitro.
(A) Schematic of human primary cortical oligodendrocyte isolation and differentiation protocol [adapted from (64)]. IHC, immunohistochemistry. (B) Representative flow cytometry of O4+ cells after 12 days in culture (d.p.c.) at the onset of antibody treatment, showing a mixed population of premyelinating O4+MBPCD22 cells (blue) and a subpopulation of myelinating O4+MBP+CD22+ oligodendrocytes (red). (C) Representative bright-field images of isotype-, anti-CD22−, and anti-MOG–treated oligodendrocytes on day 15 after isolation (day 3 after treatment). Confluence mask overlaid in purple. Scale bar, 100 μm. (D) Quantification of confluence in isotype (gray)–, anti-CD22 (green)–, and anti-MOG (purple)–treated cells assessed by time-lapse microscopy over 3 days (n = 3 from two separate primary tissue samples, means ± SEM). (E) Representative immunofluorescence images of isotype-, anti-CD22−, and anti-MOG–treated oligodendrocytes on day 15 after isolation (day 3 after treatment), stained for MBP (green), and OLIG2 (red). Scale bar, 10 μm. DAPI, 4′,6-diamidino-2-phenylindole. (F) Quantification of MBP+ cells among OLIG2+ nuclei in isotype (gray)–, anti-CD22 (green)–, and anti-MOG (purple)–treated cells (n = 3 from two separate primary tissue samples, one-way ANOVA, means ± SEM).

References

    1. de Duve C, Pressman BC, Gianetto R, Wattiaux R, Appelmans F, Tissue fractionation studies. 6. Intracellular distribution patterns of enzymes in rat-liver tissue. Biochem. J. 60, 604–617 (1955). - PMC - PubMed
    1. Platt FM, d’Azzo A, Davidson BL, Neufeld EF, Tifft CJ, Lysosomal storage diseases. Nat. Rev. Dis. Primers. 4, 27 (2018). - PubMed
    1. Ballabio A, Bonifacino JS, Lysosomes as dynamic regulators of cell and organismal homeostasis. Nat. Rev. Mol. Cell Biol. 21, 101–118 (2020). - PubMed
    1. Aharon-Peretz J, Rosenbaum H, Gershoni-Baruch R, Mutations in the glucocerebrosidase gene and Parkinson’s disease in Ashkenazi Jews. N. Engl. J. Med. 351, 1972–1977 (2004). - PubMed
    1. Reddy JV, Ganley IG, Pfeffer SR, Clues to neuro-degeneration in Niemann-Pick type C disease from global gene expression profiling. PLOS ONE 1, e19 (2006). - PMC - PubMed

Publication types

Substances