Dynamic PET-facilitated modeling and high-dose rifampin regimens for Staphylococcus aureus orthopedic implant-associated infections
- PMID: 34851697
- PMCID: PMC8693472
- DOI: 10.1126/scitranslmed.abl6851
Dynamic PET-facilitated modeling and high-dose rifampin regimens for Staphylococcus aureus orthopedic implant-associated infections
Abstract
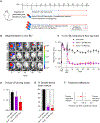
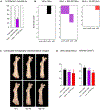
Staphylococcus aureus is a major human pathogen causing serious implant–associated infections. Combination treatment with rifampin (10 to 15 mg/kg per day), which has dose-dependent activity, is recommended to treat S. aureus orthopedic implant–associated infections. Rifampin, however, has limited bone penetration. Here, dynamic 11C-rifampin positron emission tomography (PET) performed in prospectively enrolled patients with confirmed S. aureus bone infection (n = 3) or without orthopedic infection (n = 12) demonstrated bone/plasma area under the concentration-time curve ratio of 0.14 (interquartile range, 0.09 to 0.19), exposures lower than previously thought. PET-based pharmacokinetic modeling predicted rifampin concentration-time profiles in bone and facilitated studies in a mouse model of S. aureus orthopedic implant infection. Administration of high-dose rifampin (human equipotent to 35 mg/kg per day) substantially increased bone concentrations (2 mg/liter versus <0.2 mg/liter with standard dosing) in mice and achieved higher bacterial killing and biofilm disruption. Treatment for 4 weeks with high-dose rifampin and vancomycin was noninferior to the recommended 6-week treatment of standard-dose rifampin with vancomycin in mice (risk difference, −6.7% favoring high-dose rifampin regimen). High-dose rifampin treatment ameliorated antimicrobial resistance (0% versus 38%; P = 0.04) and mitigated adverse bone remodeling (P < 0.01). Last, whole-genome sequencing demonstrated that administration of high-dose rifampin in mice reduced selection of bacterial mutations conferring rifampin resistance (rpoB) and mutations in genes potentially linked to persistence. These data suggest that administration of high-dose rifampin is necessary to achieve optimal bone concentrations, which could shorten and improve treatments for S. aureus orthopedic implant infections.
Figures


Similar articles
-
Efficacy of high doses of levofloxacin in experimental foreign-body infection by methicillin-susceptible Staphylococcus aureus.Antimicrob Agents Chemother. 2006 Dec;50(12):4011-7. doi: 10.1128/AAC.00523-06. Epub 2006 Oct 2. Antimicrob Agents Chemother. 2006. PMID: 17015630 Free PMC article.
-
Efficacy of antibiotic treatment of implant-associated Staphylococcus aureus infections with moxifloxacin, flucloxacillin, rifampin, and combination therapy: an animal study.Drug Des Devel Ther. 2017 Jun 14;11:1729-1736. doi: 10.2147/DDDT.S138888. eCollection 2017. Drug Des Devel Ther. 2017. PMID: 28652709 Free PMC article.
-
Adjunctive rifampin is crucial to optimizing daptomycin efficacy against rabbit prosthetic joint infection due to methicillin-resistant Staphylococcus aureus.Antimicrob Agents Chemother. 2011 Oct;55(10):4589-93. doi: 10.1128/AAC.00675-11. Epub 2011 Aug 8. Antimicrob Agents Chemother. 2011. PMID: 21825285 Free PMC article.
-
Vancomycin in combination with other antibiotics for the treatment of serious methicillin-resistant Staphylococcus aureus infections.Clin Infect Dis. 2009 Oct 1;49(7):1072-9. doi: 10.1086/605572. Clin Infect Dis. 2009. PMID: 19725789 Review.
-
Role of Rifampin against Staphylococcal Biofilm Infections In Vitro, in Animal Models, and in Orthopedic-Device-Related Infections.Antimicrob Agents Chemother. 2019 Jan 29;63(2):e01746-18. doi: 10.1128/AAC.01746-18. Print 2019 Feb. Antimicrob Agents Chemother. 2019. PMID: 30455229 Free PMC article. Review.
Cited by
-
Application of Nuclear Medicine Techniques in Musculoskeletal Infection: Current Trends and Future Prospects.J Clin Med. 2024 Feb 13;13(4):1058. doi: 10.3390/jcm13041058. J Clin Med. 2024. PMID: 38398371 Free PMC article. Review.
-
Antibiotic-Derived Radiotracers for Positron Emission Tomography: Nuclear or "Unclear" Infection Imaging?Angew Chem Int Ed Engl. 2022 Nov 7;61(45):e202204955. doi: 10.1002/anie.202204955. Epub 2022 Sep 20. Angew Chem Int Ed Engl. 2022. PMID: 35834311 Free PMC article. Review.
-
High-dose rifampin improves bactericidal activity without increased intracerebral inflammation in animal models of tuberculous meningitis.J Clin Invest. 2022 Mar 15;132(6):e155851. doi: 10.1172/JCI155851. J Clin Invest. 2022. PMID: 35085105 Free PMC article.
-
Systemic rifampicin shows accretion to locally implanted hydroxyapatite particles in a rat abdominal muscle pouch model.J Bone Jt Infect. 2023 Jan 9;8(1):19-28. doi: 10.5194/jbji-8-19-2023. eCollection 2023. J Bone Jt Infect. 2023. PMID: 36687463 Free PMC article.
-
Is Imaging Bacteria with PET a Realistic Option or an Illusion?Diagnostics (Basel). 2023 Mar 24;13(7):1231. doi: 10.3390/diagnostics13071231. Diagnostics (Basel). 2023. PMID: 37046449 Free PMC article. Review.
References
-
- Rasigade JP, Vandenesch F, Staphylococcus aureus: A pathogen with still unresolved issues. Infect. Genet. Evol 21, 510–514 (2014). - PubMed
-
- Richter K, Van den Driessche F, Coenye T, Innovative approaches to treat Staphylococcus aureus biofilm-related infections. Essays Biochem. 61, 61–70 (2017). - PubMed
-
- Costerton JW, Stewart PS, Greenberg EP, Bacterial biofilms: A common cause of persistent infections. Science 284, 1318–1322 (1999). - PubMed
Publication types
MeSH terms
Substances
Grants and funding
LinkOut - more resources
Full Text Sources
Medical

