

Quantification and Surface Localization of the Hemolysin A Type I Secretion System at the Endogenous Level and under Conditions of Overexpression
- PMID: 34851699
- PMCID: PMC8824266
- DOI: 10.1128/AEM.01896-21
Quantification and Surface Localization of the Hemolysin A Type I Secretion System at the Endogenous Level and under Conditions of Overexpression
Abstract
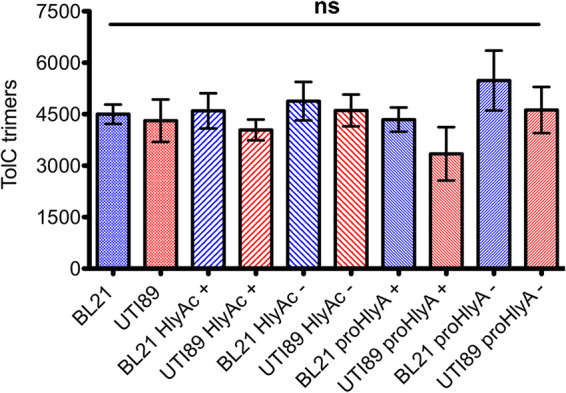
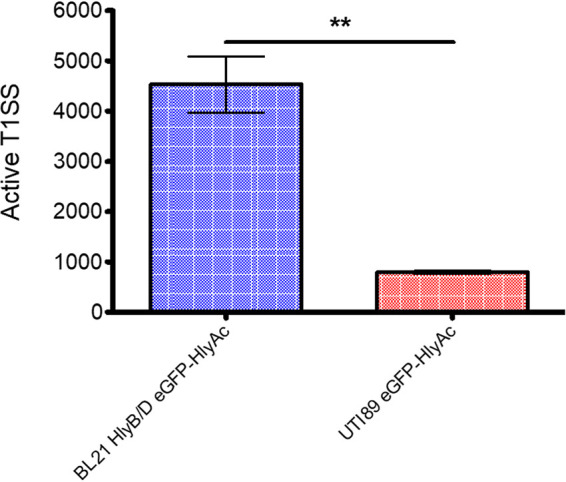
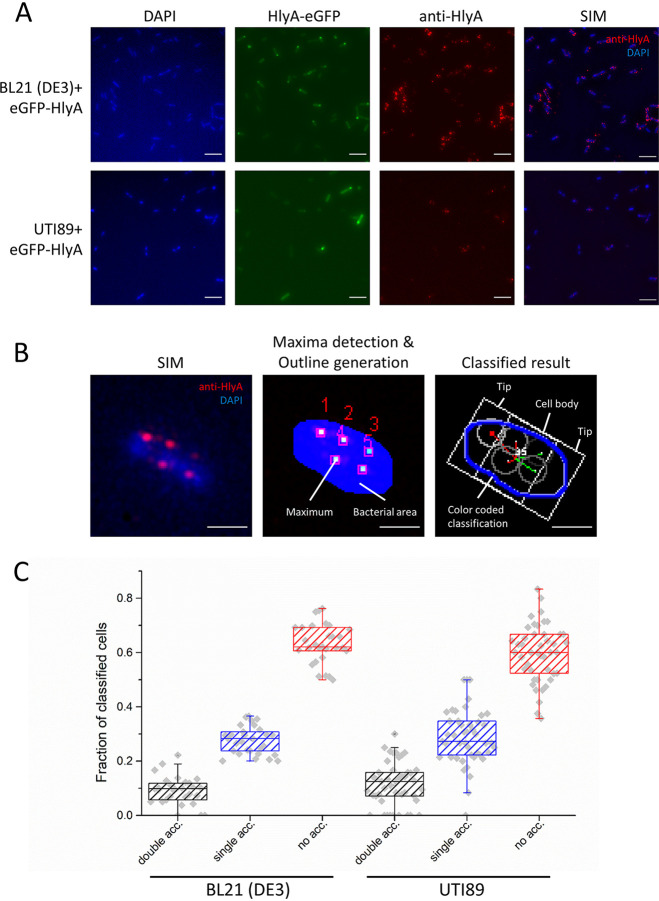
Secretion systems are essential for Gram-negative bacteria, as these nanomachineries allow communication with the outside world by exporting proteins into the extracellular space or directly into the cytosol of a host cell. For example, type I secretion systems (T1SS) secrete a broad range of substrates across both membranes into the extracellular space. One well-known example is the hemolysin A (HlyA) T1SS from Escherichia coli, which consists of an ABC transporter (HlyB), a membrane fusion protein (HlyD), the outer membrane protein TolC, and the substrate HlyA, a member of the family of repeats in toxins (RTX) toxins. Here, we determined the amount of TolC at the endogenous level (parental strain, UTI89) and under conditions of overexpression [T7 expression system, BL21(DE3)-BD]. The overall amount of TolC was not influenced by the overexpression of the HlyBD complex. Moving one step further, we determined the localization of the HlyA T1SS by superresolution microscopy. In contrast to other bacterial secretion systems, no polarization was observed with respect to endogenous or overexpression levels. Additionally, the cell growth and division cycle did not influence polarization. Most importantly, the size of the observed T1SS clusters did not correlate with the recently proposed outer membrane islands. These data indicate that T1SS clusters at the outer membrane, generating domains of so-far-undescribed identity. IMPORTANCE Uropathogenic Escherichia coli (UPEC) strains cause about 110 million urinary tract infections each year worldwide, representing a global burden to the health care system. UPEC strains secrete many virulence factors, among these, the TX toxin hemolysin A via a cognate T1SS into the extracellular space. In this study, we determined the endogenous copy number of the HlyA T1SS in UTI89 and analyzed the surface localization in BL21(DE3)-BD and UTI89, respectively. With approximately 800 copies of the T1SS in UTI89, this is one of the highest expressed bacterial secretion systems. Furthermore, and in clear contrast to other secretion systems, no polarized surface localization was detected. Finally, quantitative analysis of the superresolution data revealed that clusters of the HlyA T1SS are not related to the recently identified outer membrane protein islands. These data provide insights into the quantitative molecular architecture of the HlyA T1SS.
Keywords: T1SS; TolC; membrane cluster; membrane localization; secretion systems; type I secretion.
Conflict of interest statement
The authors declare no conflict of interest.
Figures
Similar articles
-
Type 1 secretion necessitates a tight interplay between all domains of the ABC transporter.Sci Rep. 2024 Apr 18;14(1):8994. doi: 10.1038/s41598-024-59759-0. Sci Rep. 2024. PMID: 38637678 Free PMC article.
-
Investigations on the substrate binding sites of hemolysin B, an ABC transporter, of a type 1 secretion system.Front Microbiol. 2022 Dec 1;13:1055032. doi: 10.3389/fmicb.2022.1055032. eCollection 2022. Front Microbiol. 2022. PMID: 36532430 Free PMC article.
-
In vivo quantification of the secretion rates of the hemolysin A Type I secretion system.Sci Rep. 2016 Sep 12;6:33275. doi: 10.1038/srep33275. Sci Rep. 2016. PMID: 27616645 Free PMC article.
-
The Type 1 secretion pathway - the hemolysin system and beyond.Biochim Biophys Acta. 2014 Aug;1843(8):1629-41. doi: 10.1016/j.bbamcr.2013.09.017. Epub 2013 Oct 12. Biochim Biophys Acta. 2014. PMID: 24129268 Review.
-
Redefining the bacterial Type I protein secretion system.Adv Microb Physiol. 2023;82:155-204. doi: 10.1016/bs.ampbs.2022.10.003. Epub 2022 Dec 5. Adv Microb Physiol. 2023. PMID: 36948654 Review.
Cited by
-
Unveiling the impact of Leptospira TolC efflux protein on host tissue adherence, complement evasion, and diagnostic potential.Infect Immun. 2024 Nov 12;92(11):e0041924. doi: 10.1128/iai.00419-24. Epub 2024 Oct 11. Infect Immun. 2024. PMID: 39392312 Free PMC article.
References
Publication types
MeSH terms
Substances
LinkOut - more resources
Full Text Sources
