. 2022 May 15;33(6):ar53.
doi: 10.1091/mbc.E21-10-0494. Epub 2021 Dec 1.

VAMP2 and synaptotagmin mobility in chromaffin granule membranes: implications for regulated exocytosis

Affiliations

VAMP2 and synaptotagmin mobility in chromaffin granule membranes: implications for regulated exocytosis

Prabhodh S Abbineni et al. Mol Biol Cell. .

Abstract

Granule-plasma membrane docking and fusion can only occur when proteins that enable these reactions are present at the granule-plasma membrane contact. Thus, the mobility of granule membrane proteins may influence docking and membrane fusion. We measured the mobility of vesicle associated membrane protein 2 (VAMP2), synaptotagmin 1 (Syt1), and synaptotagmin 7 (Syt7) in chromaffin granule membranes in living chromaffin cells. We used a method that is not limited by standard optical resolution. A bright flash of strongly decaying evanescent field produced by total internal reflection was used to photobleach GFP-labeled proteins in the granule membrane. Fluorescence recovery occurs as unbleached protein in the granule membrane distal from the glass interface diffuses into the more bleached proximal regions, enabling the measurement of diffusion coefficients. We found that VAMP2-EGFP and Syt7-EGFP are mobile with a diffusion coefficient of ∼3 × 10⁻¹⁰ cm2/s. Syt1-EGFP mobility was below the detection limit. Utilizing these diffusion parameters, we estimated the time required for these proteins to arrive at docking and nascent fusion sites to be many tens of milliseconds. Our analyses raise the possibility that the diffusion characteristics of VAMP2 and Syt proteins could be a factor that influences the rate of exocytosis.


Figures
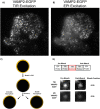
FIGURE 1:
FIGURE 1:
TIR-based photobleaching protocol to measure the mobility of chromaffin granule membrane proteins. Image of a chromaffin cell expressing VAMP2-EGFP imaged using low-intensity TIR (A) or EPI (B) illumination. (C) Schematic of the principle underlying the TIR-FRAP method. Chromaffin granules labeled with a fluorophore-tagged membrane protein are photobleached using TIR excitation light. The gradient of bleached fluorophore imprinted on the granule membrane dissipates over time if the protein is mobile, or remains stable if the protein is immobile. (D) Fluorescence of the granules is measured using low-intensity TIR and EPI illumination before and after bleaching in TIR. Shown is an example of a typical granule labeled with VAMP2-EGFP. The bleach depth (fraction of fluorescence lost) in TIR and EPI is calculated, 1-F(postbleach)/F(prebleach).
FIGURE 2:
FIGURE 2:
Simulation of diffusion on the surface of a sphere. Fluorescent proteins with a given diffusion coefficient (D), present on the surface of a 300-nm sphere, were photobleached for 45 ms in an evanescent field with a decay constant of 80 nm. The bleach depth (fraction of fluorescence lost) evident by TIR and EPI illumination (A, B), and fluorescence recovery following photobleaching (C, D) is plotted. The degree of scattering present in the evanescent field at the coverslip/sample interface was varied (A, C) while D was kept constant, or the degree of scattering was kept constant at 20% while varying D (B, D).
FIGURE 3:
FIGURE 3:
VAMP2 and synaptotagmins have low enough mobility in the granule membrane to retain a bleaching imprint within the duration of a bleaching pulse. Chromaffin cells were transfected with plasmids encoding (A) VAMP2-EGFP, (B) Syt1-msfGFP or Syt1-EGFP, (C) Syt7-EGFP, and (D) the signal sequence of NPY fused to mOxGFP (ss-mOxGFP). Chromaffin cells expressing the fusion proteins were photobleached for 46 ms (granule membrane probes), or 169 ms (ss-moxGFP) with high-intensity 488-nm excitation light in TIR mode. Fluorescence intensity was probed pre- and postbleach using low-intensity TIR and EPI illumination as described in the Materials and Methods section. The bleach depth (fraction of fluorescence lost) in TIR and EPI is plotted. Each data point represents an individual granule. The black 45° line is indicative of equivalent bleaching in EPI and TIR and is expected for highly mobile fluorophores. The red, purple, and green curved lines are the expected result for a fluorophore with a diffusion coefficient of D = 3 × 10⁻¹⁰ cm2/s, photobleached in an evanescent field with 0%, 10%, or 20% scattering, respectively, and an exponential decay constant of 80 nm. The theoretical curves for membrane proteins (A–C) and for lumenal proteins (D) are somewhat different, as discussed in the Theory section. (E) The data shown in A–D expressed as the ratio of the bleach depths in TIR and EPI; the red line represents the median value in each group. Data from Syt1-msfGFP and Syt1-EGFP are colored blue and black, respectively. A ratio of 1 represents equivalent bleaching in TIR and EPI; *** indicates p < 0.0001 (unpaired Student’s t test). (F) The ratio of experimentally observed differences in bleach depths probed with TIR and EPI illumination compared with the theoretically expected differences for an immobile fluorophore. A ratio of 0 or 1 is expected for highly mobile or immobile fluorophores, respectively. Scattering was assumed to be 0 when deriving the expected theoretical results.
FIGURE 4:
FIGURE 4:
Simulations indicate that confinement of granule membrane protein reduces the difference in bleach depths measured by low-intensity TIR and EPI illumination after high-intensity TIR bleaching. Simulations were performed assuming a diffusion coefficient of 3 × 10⁻¹⁰ cm2/s, 45 ms bleach time, and an evanescent decay constant of 80 nm. Molecules were either confined to defined areas at the base of a 300-nm sphere or were homogeneously distributed on the surface of the sphere. Bleach depths measured with low-intensity TIR or EPI probe illumination are plotted. The dashed line in A corresponds to equal TIR and EPI bleach depths. Confinement and homogeneous distribution of granule membrane protein are depicted in B and C, respectively. Increasing confinement decreases the difference in TIR and EPI bleach depths after high-intensity TIR bleaching.
FIGURE 5:
FIGURE 5:
FRAP analysis of chromaffin granules expressing fluorophore-tagged membrane or lumenal proteins. Chromaffin cells expressing (A) VAMP2-EGFP, or (B) Syt1-msf or EGFP, or (C) Syt7-EGFP were photobleached with high-intensity 488 nm light in TIR mode, and fluorescence recovery was measured using low-intensity 488 nm light. Fluorescence recovery after photobleaching is shown. Experimental data were grouped into bins based on the fractional bleaching evident immediately after the photobleaching (bins: 0.4–0.5, 0.5–0.6, and each bin contains averaged data from 10 to 22 granules). Simulated theoretical curves are shown overlaid on the experimental data for three different diffusion coefficients. The kinetics and pathway (mode C) for irreversible bleaching were incorporated into the simulations. (D–F) Chi-square goodness-of-fit analysis was used to identify the simulated recovery curves that best described the experimental data. For VAMP2 (E) and Syt7 (F), the goodness of fit is better at the D = 3 × 10⁻¹⁰ (highlighted by the red horizontal line) than it is for D = 0 (highlighted by the orange horizontal line). The fit for Syt1 is similar for D = 0 and D = 3 × 10⁻¹⁰.
FIGURE 6:
FIGURE 6:
Experimental observation of fluorescence recovery of EGFP from a reversibly bleached state, and comparison with theoretical simulations, for EPI bleach and EPI probe (the case where diffusion does not matter). Chromaffin cells transfected with plasmids encoding VAMP2-EGFP, Syt1-EGFP, or Syt7-EGFP were photobleached with high-intensity 488-nm EPI excitation light. Fluorescence recovery following photobleaching was probed using low-intensity EPI illumination. The data from cells expressing the various fusion proteins were pooled based on an initial bleach depth of either 50–60% (n = 19 granules, blue line), or 60–70% (n = 27 granules, red line), and the normalized fluorescence recovery after the bleach is shown. Parameters in the simulations (shown here as smooth curves without error bars) were adjusted to produce curves that match the observed average bleach at t = 0 (i.e., at the end of the bleach pulse) for each of those two groups. The early recoveries reflect reversible bleaching. The incompleteness of the longer-term fluorescence reflects rapid irreversible bleaching that occurred during the bleaching pulse, and continued but more slowly during the probe phase. Three theoretically possible modes of reversible recovery were simulated, with a range of the most relevant adjustable parameter for each, as follows: (Mode A, solid colored lines) Reversible and irreversible bleaching can occur from an unbleached ground state, each with its own probability; the ratio of these probabilities (indicated as “rev:irr”) strongly affects the match of simulations to experimental data. (Mode B, dashed colored lines) Irreversible bleaching can spontaneously occur from a reversibly bleached state without the need for the fluorophore to encounter a second photon. The probability (in each time increment) for this second step to occur is indicated as “prob irr.” (Mode C, solid black line) Irreversible bleaching can only occur from an already-reversibly bleached state and the irreversible bleaching step requires another photon. Parameters for the irreversible part of the bleach were chosen to best match the experimental data and “rev:irr” was set to 0.15. These same parameters were then used in all the simulations involving TIR and diffusion. The characteristic time parameters for reversible recovery were chosen to be 45 ms for modes A and C and 75 ms for mode B. For all modes, the intensity of the bleach pulse was adjusted so that the simulation curve matched the experimental data at t = 0.
FIGURE 7:
FIGURE 7:
Influence of diffusion and protein abundance on the time required for proteins to reach a fusion pore of a defined radius. (A) The influence of vesicle membrane protein abundance on the time required for proteins to reach a fusion pore. Given a D of 3 × 10⁻¹⁰ cm2/s, we calculated the amount of time needed for four copies of a protein to reach a fusion pore 1 nm in radius, with protein density ranging from 820 to 26,000 copies/µm2. The inset shows a magnified view of the 12,000–26,000 copies/µm2 range. The red and black arrows show Syt1 and VAMP2 densities on synaptic vesicles, respectively. (B) Time required for four copies of Syt1 or VAMP2 to arrive at a fusion pore of a defined radius. A diffusion coefficient of 3 × 10⁻¹⁰ cm2/s was used to describe the mobility of both VAMP2 and Syt7, and the concentration of VAMP2 and Syt7 was set to the same densities as on synaptic vesicles (equivalent to 70 copies of VAMP2 and 15 copies of Syt per synaptic vesicle). The diffusion time calculations were performed as described in the Discussion section.

References

    1. Abbineni PS, Bittner MA, Axelrod D, Holz RW (2018). Chromogranin A, the major lumenal protein in chromaffin granules, controls fusion pore expansion. J Gen Physiol 151, 118–130. - PMC - PubMed
    1. Alenghat FJ, Golan DE (2013). Membrane protein dynamics and functional implications in mammalian cells. Curr Top Membr 72, 89–120. - PMC - PubMed
    1. Allersma MW, Bittner MA, Axelrod D, Holz RW (2006). Motion matters: secretory granule motion adjacent to the plasma membrane and exocytosis. Mol Biol Cell 17, 2424–2438. - PMC - PubMed
    1. Allersma MW, Wang L, Axelrod D, Holz RW (2004). Visualization of regulated exocytosis with a granule-membrane probe using total internal reflection microscopy. Mol Biol Cell 15, 4658–4668. - PMC - PubMed
    1. Axelrod JJ, Axelrod D (2021). Light scattering in TIRF microscopy: a theoretical study of the limits to surface selectivity. Biophys J 120, 2952–2968. - PMC - PubMed

Publication types

MeSH terms

LinkOut - more resources