Polyphenol Utilization Proteins in the Human Gut Microbiome
- PMID: 34851722
- PMCID: PMC8824206
- DOI: 10.1128/AEM.01851-21
Polyphenol Utilization Proteins in the Human Gut Microbiome
Abstract
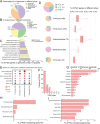
Dietary polyphenols can significantly benefit human health, but their bioavailability is metabolically controlled by human gut microbiota. To facilitate the study of polyphenol metabolism for human gut health, we have manually curated experimentally characterized polyphenol utilization proteins (PUPs) from published literature. This resulted in 60 experimentally characterized PUPs (named seeds) with various metadata, such as species and substrate. Further database search found 107,851 homologs of the seeds from UniProt and UHGP (unified human gastrointestinal protein) databases. All PUP seeds and homologs were classified into protein classes, families, and subfamilies based on Enzyme Commission (EC) numbers, Pfam (protein family) domains, and sequence similarity networks. By locating PUP homologs in the genomes of UHGP, we have identified 1,074 physically linked PUP gene clusters (PGCs), which are potentially involved in polyphenol metabolism in the human gut. The gut microbiome of Africans was consistently ranked the top in terms of the abundance and prevalence of PUP homologs and PGCs among all geographical continents. This reflects the fact that dietary polyphenols are consumed by the African population more commonly than by other populations, such as Europeans and North Americans. A case study of the Hadza hunter-gatherer microbiome verified the feasibility of using dbPUP to profile metagenomic data for biologically meaningful discovery, suggesting an association between diet and PUP abundance. A Pfam domain enrichment analysis of PGCs identified a number of putatively novel PUP families. Lastly, a user-friendly web interface (https://bcb.unl.edu/dbpup/) provides all the data online to facilitate the research of polyphenol metabolism for improved human health. IMPORTANCE Long-term consumption of polyphenol-rich foods has been shown to lower the risk of various human diseases, such as cardiovascular diseases, cancers, and metabolic diseases. Raw polyphenols are often enzymatically processed by gut microbiome, which contains various polyphenol utilization proteins (PUPs) to produce metabolites with much higher bioaccessibility to gastrointestinal cells. This study delivered dbPUP as an online database for experimentally characterized PUPs and their homologs in human gut microbiome. This work also performed a systematic classification of PUPs into enzyme classes, families, and subfamilies. The signature Pfam domains were identified for PUP families, enabling conserved domain-based PUP annotation. This standardized sequence similarity-based PUP classification system offered a guideline for the future inclusion of new experimentally characterized PUPs and the creation of new PUP families. An in-depth data analysis was further conducted on PUP homologs and physically linked PUP gene clusters (PGCs) in gut microbiomes of different human populations.
Keywords: PUP; PUP gene clusters; gut microbiota; microbiome; polyphenol; polyphenol utilization proteins.
Conflict of interest statement
The authors declare no conflict of interest.
We declare no conflict of interest.
Figures


Similar articles
-
Decoding polyphenol metabolism in patients with Crohn's disease: Insights from diet, gut microbiota, and metabolites.Food Res Int. 2024 Sep;192:114852. doi: 10.1016/j.foodres.2024.114852. Epub 2024 Jul 27. Food Res Int. 2024. PMID: 39147529
-
The Reciprocal Interactions between Polyphenols and Gut Microbiota and Effects on Bioaccessibility.Nutrients. 2016 Feb 6;8(2):78. doi: 10.3390/nu8020078. Nutrients. 2016. PMID: 26861391 Free PMC article. Review.
-
Dietary polyphenol impact on gut health and microbiota.Crit Rev Food Sci Nutr. 2021;61(4):690-711. doi: 10.1080/10408398.2020.1744512. Epub 2020 Mar 25. Crit Rev Food Sci Nutr. 2021. PMID: 32208932 Review.
-
The Role of the Gut Microbiota in the Metabolism of Polyphenols as Characterized by Gnotobiotic Mice.J Alzheimers Dis. 2018;63(2):409-421. doi: 10.3233/JAD-171151. J Alzheimers Dis. 2018. PMID: 29660942 Free PMC article. Review.
-
Ultra-deep sequencing of Hadza hunter-gatherers recovers vanishing gut microbes.Cell. 2023 Jul 6;186(14):3111-3124.e13. doi: 10.1016/j.cell.2023.05.046. Epub 2023 Jun 21. Cell. 2023. PMID: 37348505 Free PMC article.
Cited by
-
CAMPER: curated annotations for profiling microbial polyphenol metabolic potential.bioRxiv [Preprint]. 2024 Mar 5:2023.09.24.559193. doi: 10.1101/2023.09.24.559193. bioRxiv. 2024. PMID: 38496483 Free PMC article. Preprint.
-
Plant Polyphenols Attenuate DSS-induced Ulcerative Colitis in Mice via Antioxidation, Anti-inflammation and Microbiota Regulation.Int J Mol Sci. 2023 Jun 29;24(13):10828. doi: 10.3390/ijms241310828. Int J Mol Sci. 2023. PMID: 37446006 Free PMC article.
-
A Mixture of Pure, Isolated Polyphenols Worsens the Insulin Resistance and Induces Kidney and Liver Fibrosis Markers in Diet-Induced Obese Mice.Antioxidants (Basel). 2022 Jan 5;11(1):120. doi: 10.3390/antiox11010120. Antioxidants (Basel). 2022. PMID: 35052623 Free PMC article.
References
-
- Tomás‐Barberán FA, Espín JC. 2001. Phenolic compounds and related enzymes as determinants of quality in fruits and vegetables. J Sci Food Agric 81:853–876. 10.1002/jsfa.885. - DOI
-
- Gowd V, Karim N, Shishir MRI, Xie L, Chen W. 2019. Dietary polyphenols to combat the metabolic diseases via altering gut microbiota. Trends Food Sci Technol 93:81–93. 10.1016/j.tifs.2019.09.005. - DOI
Publication types
MeSH terms
Substances
Grants and funding
LinkOut - more resources
Full Text Sources

