. 2022 Jan 1;322(1):L102-L115.
doi: 10.1152/ajplung.00315.2021. Epub 2021 Dec 1.

Short palate, lung, and nasal epithelial clone 1 (SPLUNC1) level determines steroid-resistant airway inflammation in aging

Affiliations

Short palate, lung, and nasal epithelial clone 1 (SPLUNC1) level determines steroid-resistant airway inflammation in aging

Anil Kumar Jaiswal et al. Am J Physiol Lung Cell Mol Physiol. .

Abstract

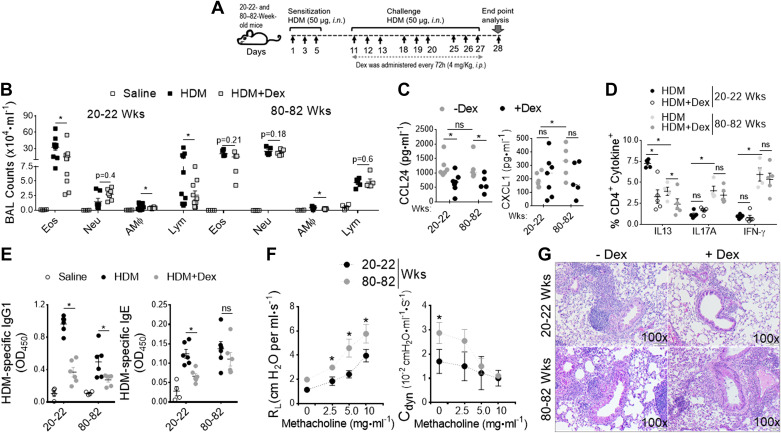
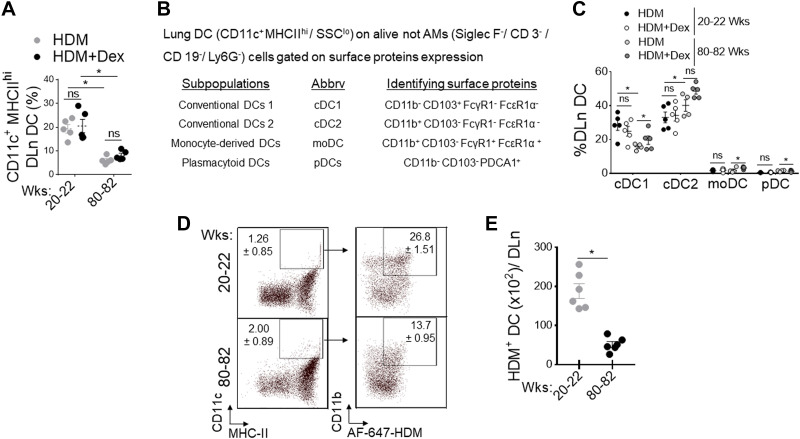
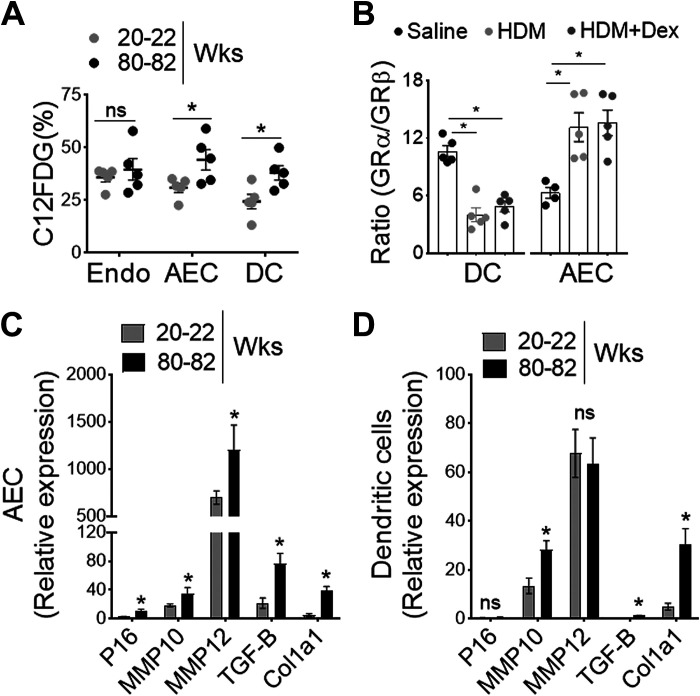
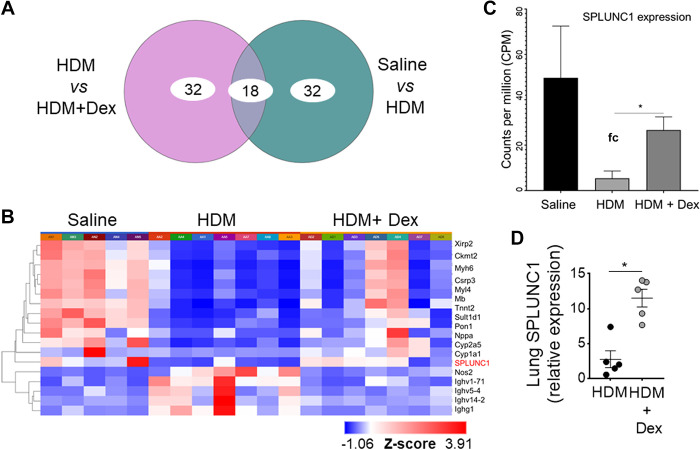
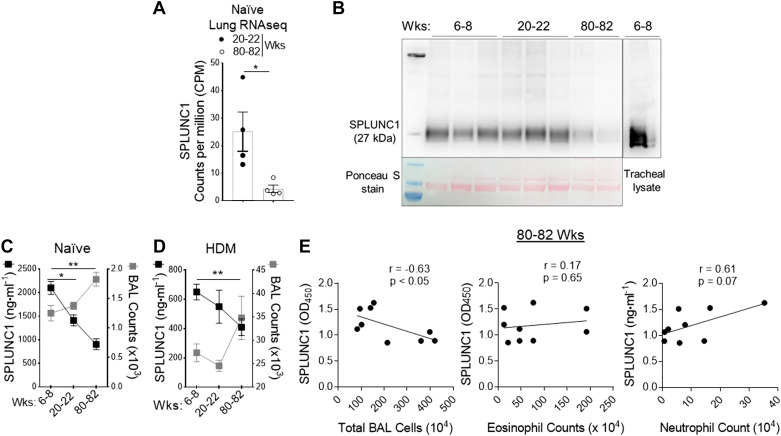
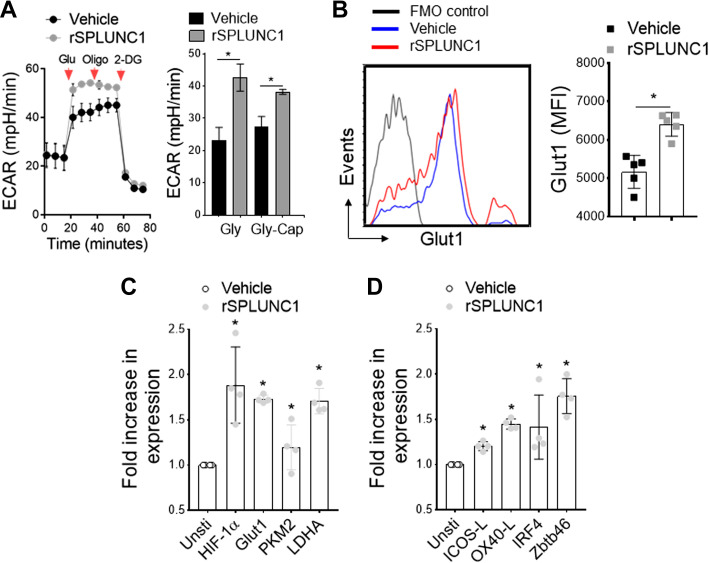
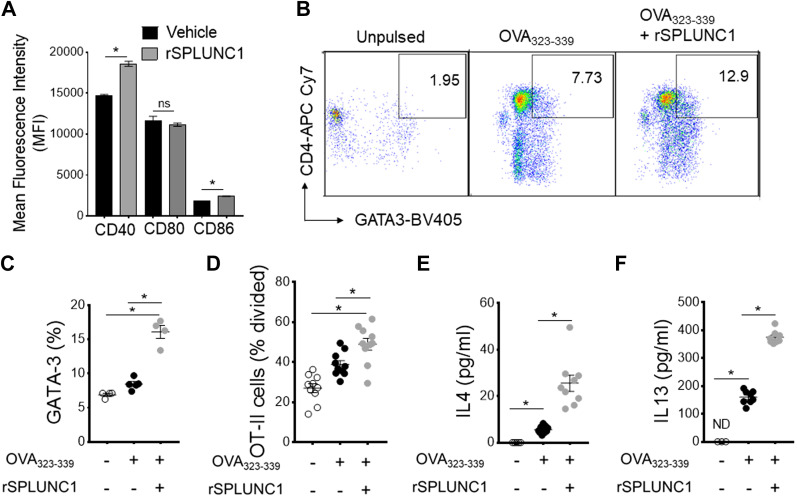
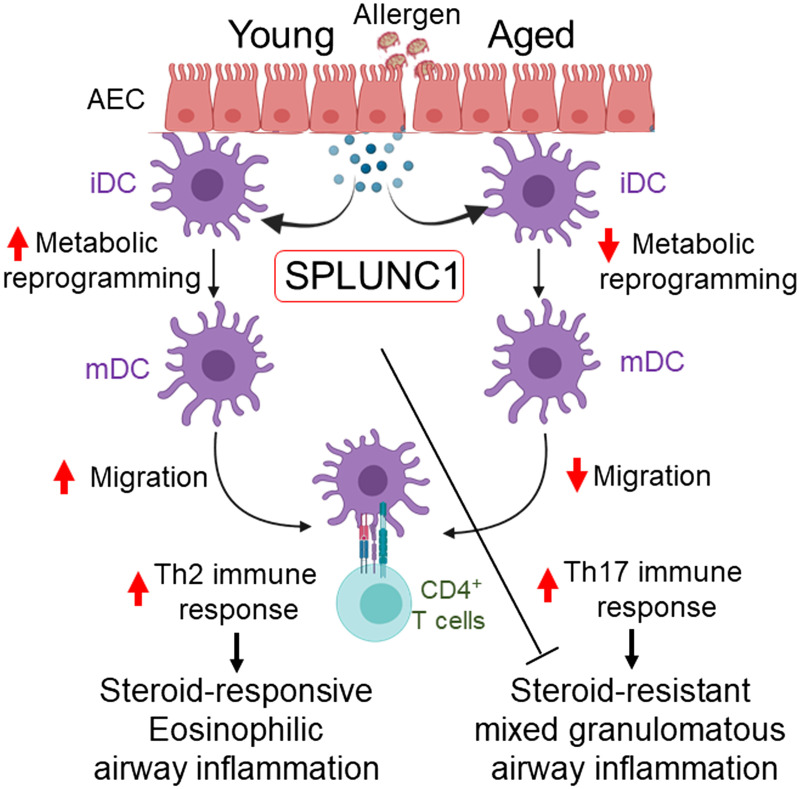
Asthma and its heterogeneity change with age. Increased airspace neutrophil numbers contribute to severe steroid-resistant asthma exacerbation in the elderly, which correlates with the changes seen in adults with asthma. However, whether that resembles the same disease mechanism and pathophysiology in aged and adults is poorly understood. Here, we sought to address the underlying molecular mechanism of steroid-resistant airway inflammation development and response to corticosteroid (Dex) therapy in aged mice. To study the changes in inflammatory mechanism, we used a clinically relevant treatment model of house-dust mite (HDM)-induced allergic asthma and investigated lung adaptive immune response in adult (20-22 wk old) and aged (80-82 wk old) mice. Our result indicates an age-dependent increase in airway hyperresponsiveness (AHR), mixed granulomatous airway inflammation comprising eosinophils and neutrophils, and Th1/Th17 immune response with progressive decrease in frequencies and numbers of HDM-bearing dendritic cells (DC) accumulation in the draining lymph node (DLn) of aged mice as compared with adult mice. RNA-Seq experiments of the aged lung revealed short palate, lung, and nasal epithelial clone 1 (SPLUNC1) as one of the steroid-responsive genes, which progressively declined with age and further by HDM-induced inflammation. Moreover, we found increased glycolytic reprogramming, maturation/activation of DCs, the proliferation of OT-II cells, and Th2 cytokine secretion with recombinant SPLUNC1 (rSPLUNC1) treatment. Our results indicate a novel immunomodulatory role of SPLUNC1 regulating metabolic adaptation/maturation of DC. An age-dependent decline in the SPLUNC1 level may be involved in developing steroid-resistant airway inflammation and asthma heterogeneity.

Keywords: INTRODUCTION; SPLUNC1; aging; airway inflammation; dendritic cells; steroid-resistant asthma.


Conflict of interest statement

No conflicts of interest, financial or otherwise, are declared by the authors.

Figures

Figure 1.
Figure 1.
Aging promotes Dex-resistant mixed granulomatous airway inflammation. A: adult (20–22 wk old) and aged (80-82 wk old) B6 mice were intranasally sensitized and challenged with HDM (50 μg) and PBS. Mice received Dex (4 mg/kg body wt, ip) or sterile saline every 72 h during the HDM-challenged period as indicated. Endpoint analysis was performed 24 h after the last administration of HDM. B: numbers of BAL inflammatory cell types (Eos; eosinophils), (Neu; neutrophils), (AM; alveolar macrophages), and (Lym; lymphocytes) from PBS, HDM, and HDM+ Dex-challenged were compared; (n = 8–10 mice, significance denoted by *P< 0.01, HDM vs. HDM+ Dex, one-way ANOVA with Sidak’s multiple comparison test). Bar graph shows (C) BAL levels of CCL24 and CXCL1 chemokines; (D) frequency of CD4+ cytokines+ T cells in lung; and (E) serum levels of HDM specific IgG1 and HDM-specific IgE (n = 8–10 mice, significance denoted by *P < 0.05, HDM vs. HDM+ Dex, one-way ANOVA with Sidak’s multiple comparison test). F: graph plot show AHR (left, airway resistance and right, lung dynamic compliance to increasing dose of inhaled methacholine in HDM-treated mice) (n = 8–10 mice, significance denoted by *P < 0.05, 20–22 wk old vs. 80–82 wk old, one-way ANOVA with Sidak’s multiple-comparison test), and G: representative lung histology sections stained with H&E and PAS. Scale bars = 100 μm for the ×100 images. Data are shown as means ± SE of 5–10 mice per group and representative from three independent experiments. AHR, airway hyperresponsiveness; BAL, bronchoalveolar lavage; HDM, house-dust mite.
Figure 2.
Figure 2.
Defective DC migration in aging. Adult (20–22 wk old) and aged (80–82 wk old) wild-type mice were sensitized and challenged by administration of PBS, HDM (50 μg), and or treated with Dex (4 mg/kg, ip). A: flowcytometry assessed the frequency of CD11c+ MHC-IIhi CD11b+ DC in DLn (n = 4–6 mice per group, significance denoted by *P< 0.01, HDM vs. HDM+ Dex, adult vs. aged, one-way ANOVA with Sidak’s multiple comparison test). B: the panel of surface markers used to identify lung DC subsets and (C) frequency in adult and aged mice after HDM challenge and Dex treatment (each circle indicates individual mice, *P< 0.01, HDM vs. HDM+ Dex, adult vs. aged, one-way ANOVA with Sidak’s multiple comparison test). Activated DC migration to DLn during the sensitization phase of allergic airway inflammation: Naïve B6 mice intranasally inoculated with AF647-labeled HDM (100 µg/mouse in 50 µL of PBS) and enumerated at 72 h in DLn and analyzed for CD11c+/MHC-IIhi/CD11b+/HDM+ DC by flow cytometry. D: representative dot plot and (E) enumeration of migrated AF647+HDM+ DC per DLn. Data are represented as means ± SE of six mice per group and representative of two independent experiments (*P< 0.05, adult vs. aged, unpaired t test). DC, dendritic cell; DLn, draining lymph node; HDM, house-dust mite.
Figure 3.
Figure 3.
Impact of lung senescence in airway epithelial cells (AECs) and DC. A: frequency of C12FDG+ lung endothelial cells (Endo), AECs, and DC from adult and aged mice as measured by SA-β-gal activity-based flow cytometric staining (n = 4 or 5 mice per group, *P< 0.01, adult vs. aged, unpaired t test), B: bar chart shows the ratio of GRα/GRβ expression in isolated lung DCs and AECs from HDM or PBS-challenged aged mice treated with Dex (n = 4 or 5 mice per group, *P< 0.01, saline vs. HDM, saline vs. HDM + Dex, one-way ANOVA with Sidak’s multiple comparison test). Bar chart showing relative expression of senescence-associated secretory phenotype (SASP) in isolated (C) AECs and (D) lung DCs. Data are represented as means ± SE from two independent experiments (n = 4 or 5 mice per group, *P< 0.01, adult vs. aged, unpaired t test). DC, dendritic cell; DLn, draining lymph node; HDM, house-dust mite; SA-β-gal, SA-β-galactosidase.
Figure 4.
Figure 4.
RNA-Seq of HDM-challenged aged mice treated with or without Dex. RNA sequencing data were preprocessed and analyzed using the Picard-STAR-limma pipeline. A: Venn diagram shows the top 50 genes that were significantly differentially expressed between no treatment vs. Dex treatment. B: using unsupervised hierarchical clustering (HC) analysis based on the differentially expressed genes (DEGs), heatmaps for the top genes among the three groups were generated. Bar graph shows (C) three-group comparison of SPLUNC1/BPIFA1 gene expression using counts per million (CPM) data and (D) qRT-PCR of lung SPLUNC1 expression. Data are represented as means ± SE (n = 4 or 5 mice per group, *P< 0.01, HDM vs. HDM +Dex, unpaired t test). HDM, house-dust mite; SPLUNC1, short palate, lung, and nasal epithelial clone 1.
Figure 5.
Figure 5.
Age-dependent progressive decline of epithelium-derived SPLUNC1 levels. A: the bar chart shows counts per million (CPM)-normalized to SPLUNC1 gene expression extracted from naïve adult (20–22 wk old) and aged (80–82 wk old) mice lung RNA-Seq data. B: immunoblot showing SPLUNC1 level in BAL from the young, adult, and aged naïve mice; [upper lane, SPLUNC1 protein in BAL samples (50 µL/lane), and tracheal lysate; lower lane, corresponding Ponceau S staining of the nitrocellulose membrane developed from the same blot]. SPLUNC1 level compared with corresponding total cell counts in BAL from (C) naïve and (D) HDM-challenged allergic mice as measured by ELISA. E: correlations between BAL levels of SPLUNC1 with absolute numbers of total and inflammatory cell types from HDM-inflamed aged lung. Pearson correlation coefficients and associated P values are shown for significant relationships only. Results are represented as means ± SE of two independent experiments, *P< 0.05, **P< 0.01. BAL, bronchoalveolar lavage; HDM, house-dust mite; SPLUNC1, short palate, lung, and nasal epithelial clone 1.
Figure 6.
Figure 6.
SPLUNC1 induces DC glycolytic metabolism. HDM-pulsed BMDCs (6- to 8-wk-old mice) were stimulated with and without recombinant (r) SPLUNC1 (rSPLUNC1; 5 µg/mL) for 16 h before metabolic measurements. A: kinetic extracellular acidification rate (ECAR) in response to glucose (10 mM), oligomycin (2 µM), and 2-DG (100 mM) measuring glycolytic flux/capacity were graphed over time (arrowhead indicates sequential drug injection). Bar graph (right) represents glycolysis (Gly) and glycolytic capacity (Gly-Cap) of HDM-pulsed BMDCs in response to rSPLUNC1. Data are represented as means ± SE of two independent experiments. B: overlay flow histogram (left) and bar graph (right) showing mean fluorescence intensity of Glut1+ CD11c+MHCII+CD11b+ HDM-pulsed BMDCs treated with rSPLUNC1 and/or vehicle control. C and D: qRT-PCR of glycolytic genes, DC activation markers, and DC-specific transcription factors. Data are represented as means ± SE (n = 4–6, *P < 0.05, unpaired t test) of at least two independent experiment. BMDCs, bone marrow-derived dendritic cells; DC, dendritic cell; HDM, house-dust mite; SPLUNC1, short palate, lung, and nasal epithelial clone 1.
Figure 7.
Figure 7.
SPLUNC1 modulates the antigen presentation capacity of DC. A: mean fluorescence intensity (MFI) of activation markers in CD11c+ MHCII+CD11b+ OVA323–339 peptide-pulsed BMDCs stimulated with or without rSPLUNC1 (5 µg/mL). OVA323–339 peptide-pulsed BMDCs were incubated (1: 5 ratio) with CFSE-labeled splenic OT-II cells for 4 days, and the effect of rSPLUNC1 on Th2 proliferation and differentiation were enumerated. B: pseudocolor plots show illustrative flow cytometry data and (C) frequencies of CD4+GATA3+ OT-II cells in coculture. D: OVA323–339 peptide-specific proliferation was represented as percentage divided OT-II cells and E and F: Th2 cytokines in coculture supernatant after 4 days were measured by ELISA (n = 4–9 per group; *P < 0.01, unpaired t test). Data are represented as means ± SE of at least two independent experiments. BMDCs, bone marrow-derived dendritic cells; DC, dendritic cell; SPLUNC1, short palate, lung, and nasal epithelial clone 1.
Figure 8.
Figure 8.
Schematic representation and proposed mechanism of SPLUNC1 and asthma heterogeneity in aging. Increasing age progressively decreases epithelium-derived SPLUNC1 levels, modulating DC effector function and developing dysregulated T cell-mediated immune response to the inhaled allergen, which results in severe airway inflammation and asthma heterogeneity in aging. DC, dendritic cell; iDC, immature DC; mDC, mature DC; SPLUNC1, short palate, lung, and nasal epithelial clone 1.

Similar articles

Cited by

References

    1. Enright PL, McClelland RL, Newman AB, Gottlieb DJ, Lebowitz MD. Underdiagnosis and undertreatment of asthma in the elderly. Cardiovascular Health Study Research Group. Chest 116: 603–613, 1999. doi:10.1378/chest.116.3.603. - DOI - PubMed
    1. Moorman JE, Mannino DM. Increasing U.S. asthma mortality rates: who is really dying? J Asthma 38: 65–71, 2001. doi:10.1081/jas-100000023. - DOI - PubMed
    1. Baptist AP, Busse PJ. Asthma over the age of 65: all's well that ends well. J Allergy Clin Immunol Pract 6: 764–773, 2018. doi:10.1016/j.jaip.2018.02.007. - DOI - PMC - PubMed
    1. Carr TF, Bleecker E. Asthma heterogeneity and severity. World Allergy Organ J 9: 41, 2016. doi:10.1186/s40413-016-0131-2. - DOI - PMC - PubMed
    1. Moore WC, Bleecker ER. Asthma heterogeneity and severity-why is comprehensive phenotyping important? Lancet Respir Med 2: 10–11, 2014. doi:10.1016/S2213-2600(13)70288-1. - DOI - PMC - PubMed

Publication types

MeSH terms