

Hemodynamic and metabolic changes during hypercapnia with normoxia and hyperoxia using pCASL and TRUST MRI in healthy adults
- PMID: 34851757
- PMCID: PMC9014679
- DOI: 10.1177/0271678X211064572
Hemodynamic and metabolic changes during hypercapnia with normoxia and hyperoxia using pCASL and TRUST MRI in healthy adults
Abstract
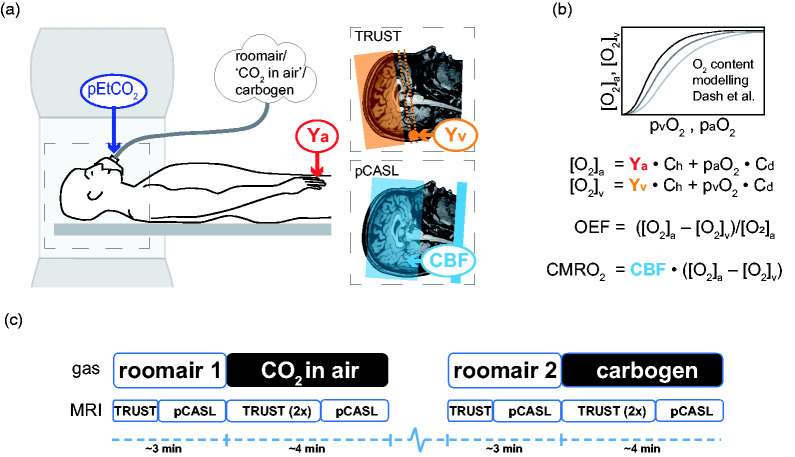
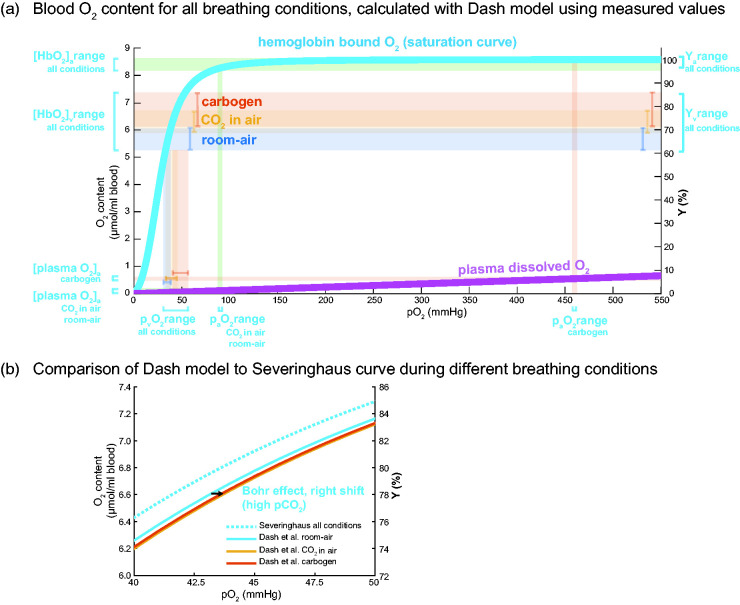
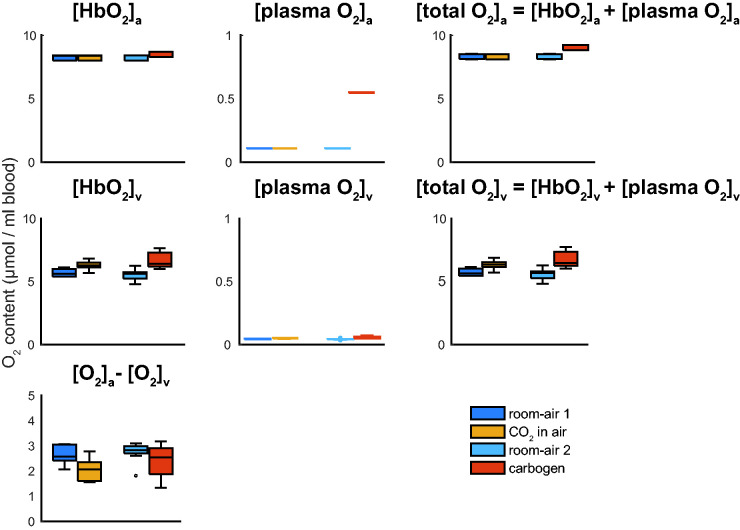
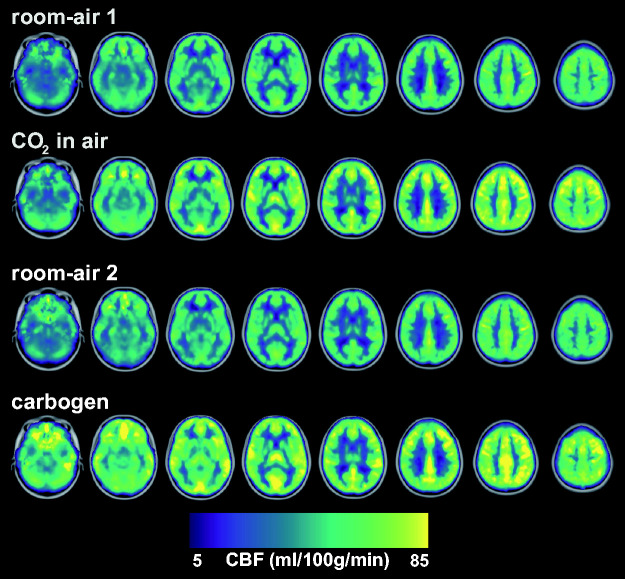
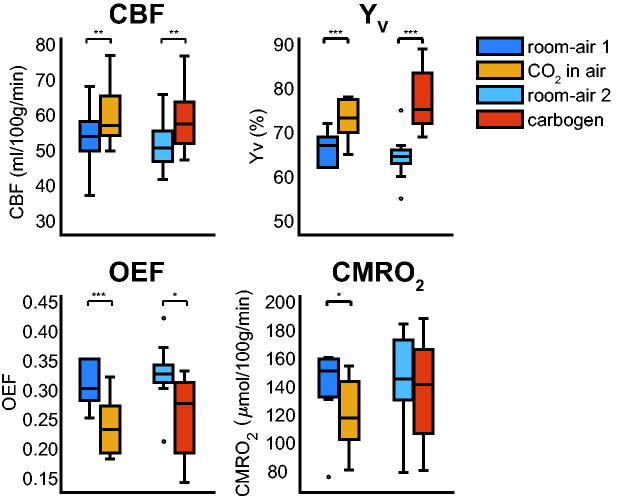
Blood oxygenation level-dependent (BOLD) or arterial spin labeling (ASL) MRI with hypercapnic stimuli allow for measuring cerebrovascular reactivity (CVR). Hypercapnic stimuli are also employed in calibrated BOLD functional MRI for quantifying neuronally-evoked changes in cerebral oxygen metabolism (CMRO2). It is often assumed that hypercapnic stimuli (with or without hyperoxia) are iso-metabolic; increasing arterial CO2 or O2 does not affect CMRO2. We evaluated the null hypothesis that two common hypercapnic stimuli, 'CO2 in air' and carbogen, are iso-metabolic. TRUST and ASL MRI were used to measure the cerebral venous oxygenation and cerebral blood flow (CBF), from which the oxygen extraction fraction (OEF) and CMRO2 were calculated for room-air, 'CO2 in air' and carbogen. As expected, CBF significantly increased (9.9% ± 9.3% and 12.1% ± 8.8% for 'CO2 in air' and carbogen, respectively). CMRO2 decreased for 'CO2 in air' (-13.4% ± 13.0%, p < 0.01) compared to room-air, while the CMRO2 during carbogen did not significantly change. Our findings indicate that 'CO2 in air' is not iso-metabolic, while carbogen appears to elicit a mixed effect; the CMRO2 reduction during hypercapnia is mitigated when including hyperoxia. These findings can be important for interpreting measurements using hypercapnic or hypercapnic-hyperoxic (carbogen) stimuli.
Keywords: Carbogen; cerebral metabolic rate of oxygen; cerebral venous oxygenation; hypercapnia; hyperoxia.
Conflict of interest statement
Figures
Similar articles
-
Measurement of OEF and absolute CMRO2: MRI-based methods using interleaved and combined hypercapnia and hyperoxia.Neuroimage. 2013 Dec;83:135-47. doi: 10.1016/j.neuroimage.2013.06.008. Epub 2013 Jun 13. Neuroimage. 2013. PMID: 23769703 Free PMC article. Clinical Trial.
-
Calibrated fMRI for dynamic mapping of CMRO2 responses using MR-based measurements of whole-brain venous oxygen saturation.J Cereb Blood Flow Metab. 2020 Jul;40(7):1501-1516. doi: 10.1177/0271678X19867276. Epub 2019 Aug 8. J Cereb Blood Flow Metab. 2020. PMID: 31394960 Free PMC article.
-
Age-related changes in brain hemodynamics; A calibrated MRI study.Hum Brain Mapp. 2015 Oct;36(10):3973-87. doi: 10.1002/hbm.22891. Epub 2015 Jul 14. Hum Brain Mapp. 2015. PMID: 26177724 Free PMC article.
-
Multi-parametric analysis reveals metabolic and vascular effects driving differences in BOLD-based cerebrovascular reactivity associated with a history of sport concussion.Brain Inj. 2019;33(11):1479-1489. doi: 10.1080/02699052.2019.1644375. Epub 2019 Jul 27. Brain Inj. 2019. PMID: 31354054 Free PMC article.
-
Respiratory challenge MRI: Practical aspects.Neuroimage Clin. 2016 May 6;11:667-677. doi: 10.1016/j.nicl.2016.05.003. eCollection 2016. Neuroimage Clin. 2016. PMID: 27330967 Free PMC article. Review.
Cited by
-
Progress on the Effects of Permissive Hypercapnia on the CNS During the Intraoperative Period: A Narrative Review.Cureus. 2024 Aug 29;16(8):e68087. doi: 10.7759/cureus.68087. eCollection 2024 Aug. Cureus. 2024. PMID: 39347154 Free PMC article. Review.
-
Hypoxia's Impact on Hippocampal Functional Connectivity: Insights from Resting-State fMRI Studies.Brain Sci. 2025 Jun 14;15(6):643. doi: 10.3390/brainsci15060643. Brain Sci. 2025. PMID: 40563813 Free PMC article. Review.
-
The contribution of the vascular architecture and cerebrovascular reactivity to the BOLD signal formation across cortical depth.Imaging Neurosci (Camb). 2024 Jun 28;2:1-19. doi: 10.1162/imag_a_00203. eCollection 2024 Jun 1. Imaging Neurosci (Camb). 2024. PMID: 39411228 Free PMC article.
-
Correspondence between BOLD fMRI task response and cerebrovascular reactivity across the cerebral cortex.Front Physiol. 2023 May 9;14:1167148. doi: 10.3389/fphys.2023.1167148. eCollection 2023. Front Physiol. 2023. PMID: 37228813 Free PMC article.
-
Validation of a new 3D quantitative BOLD based cerebral oxygen extraction mapping.J Cereb Blood Flow Metab. 2024 Jul;44(7):1184-1198. doi: 10.1177/0271678X231220332. Epub 2024 Jan 30. J Cereb Blood Flow Metab. 2024. PMID: 38289876 Free PMC article.
References
-
- Hoge RD. Calibrated FMRI. Neuroimage 2012; 62: 930–937. - PubMed
Publication types
MeSH terms
Substances
Grants and funding
LinkOut - more resources
Full Text Sources
Research Materials
