

Most consumed foods in Brazil: evolution between 2008-2009 and 2017-2018
- PMID: 34852162
- PMCID: PMC8659613
- DOI: 10.11606/s1518-8787.2021055003406
Most consumed foods in Brazil: evolution between 2008-2009 and 2017-2018
Abstract
Objective: To describe the evolution of food consumption by the Brazilian population in 2008-2009 to 2017-2018.
Methods: Data from the National Dietary Surveys of 2008-2009 and 2017-2018 were used. Both surveys estimated food consumption of two non-consecutive days of individuals aged 10 years or older. The first survey collected consumption data from 34,003 individuals through food records; the second, obtained data from 46,164 individuals, through 24-hour recalls. The twenty most frequently reported food groups in the two surveys were identified. The probability of consumption of each food group in the two surveys was estimated according to sex, age and income. This study presents the foods that had a change in the frequency of consumption of 5% or higher between the two surveys. The probability of consumption was corrected for intra-individual variability using the method developed by the National Cancer Institute.
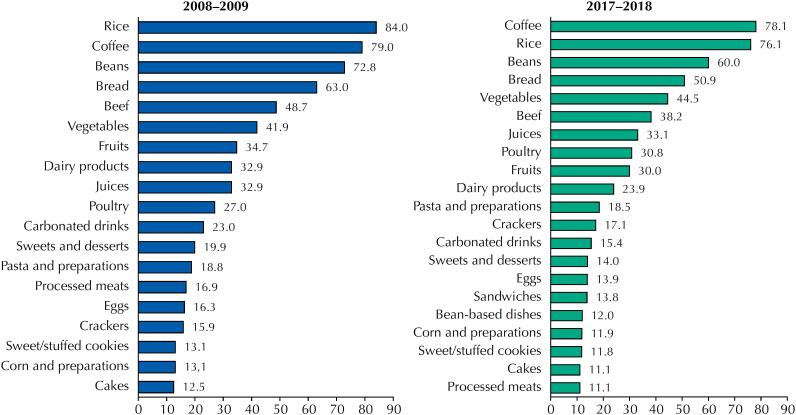
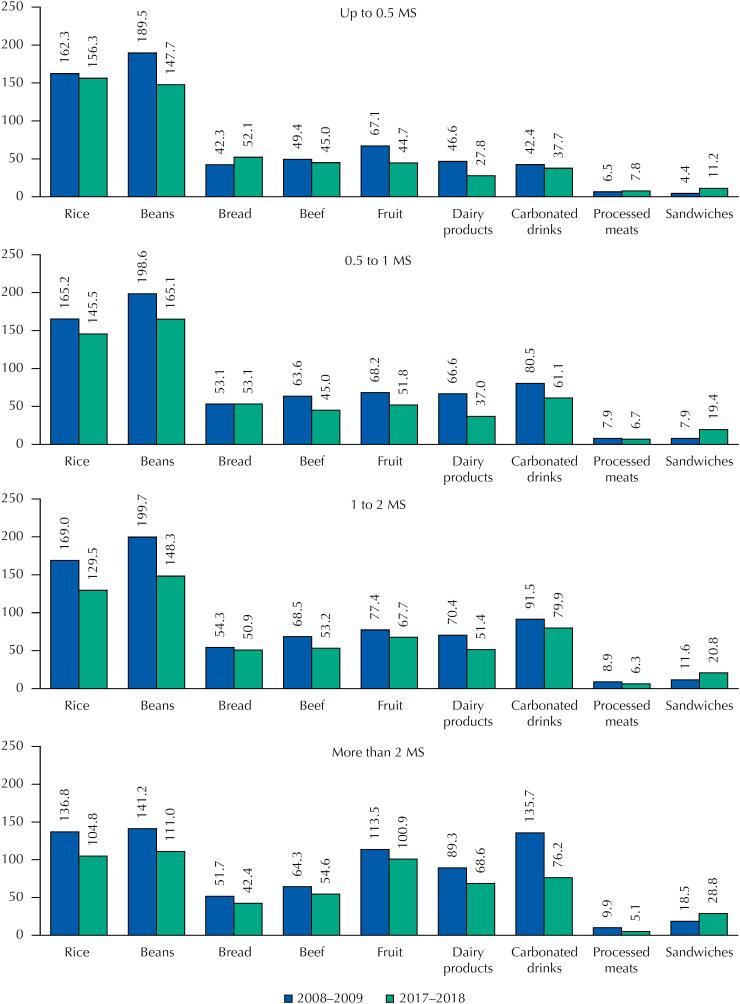
Results: Rice, beans, coffee, bread, vegetables and beef remained the staple Brazilian diet, ranking as the six most consumed items in both surveys. Ultra-processed foods such as sweet/stuffed cookies, savory cookies, processed meats and carbonated drinks also remained among the 20 most consumed foods. Trend analyses showed, regardless of gender, age and income range, a decrease in the consumption of rice, beans, beef, bread, fruit, milk and dairy, processed meats and carbonated drinks, and an increase in the consumption of sandwiches.
Conclusion: The Brazilian diet is still characterized by consumption of traditional foods, such as rice and beans, and by high frequency of consumption of ultra-processed foods, such as cookies and carbonated drinks. However, between the years of 2008-2009 and 20172018, there was a decrease in the consumption of rice, beans, beef, bread, fruit, milk and dairy, processed meats and carbonated drinks, but an increase in the consumption of sandwiches. The results show a decrease in quality in the Brazilian diet.
OBJETIVO:: Descrever a evolução do consumo alimentar da população brasileira de 2008–2009 a 2017–2018.
MÉTODOS:: Foram utilizados dados dos Inquéritos Nacionais de Alimentação de 2008–2009 e 2017–2018, que estimaram o consumo alimentar de dois dias não consecutivos de indivíduos com 10 anos ou mais de idade. O primeiro inquérito colheu dados de consumo de 34.003 indivíduos por meio de registro alimentar; o segundo, de 46.164 indivíduos, por meio de recordatório de 24 horas. Identificaram-se os 20 grupos de alimentos mais frequentemente referidos nos dois inquéritos. A probabilidade de consumo de cada um dos grupos de alimentos nos dois inquéritos foi estimada segundo sexo, idade e renda. No presente estudo, são apresentados os alimentos que tiveram mudança igual ou superior a 5% na frequência de consumo entre os dois inquéritos. A probabilidade de consumo foi corrigida para a variabilidade intraindividual, utilizando método desenvolvido pelo National Cancer Institute.
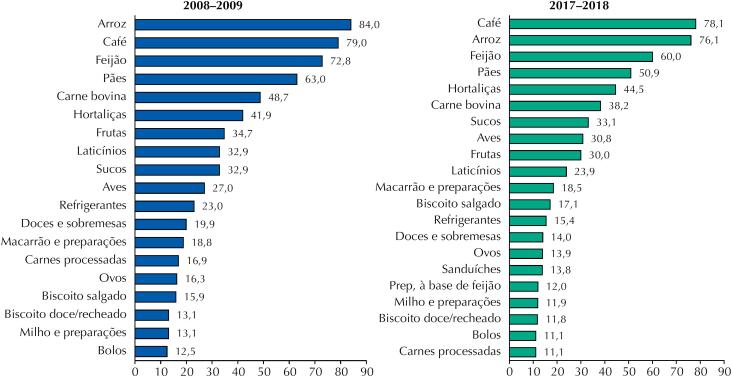
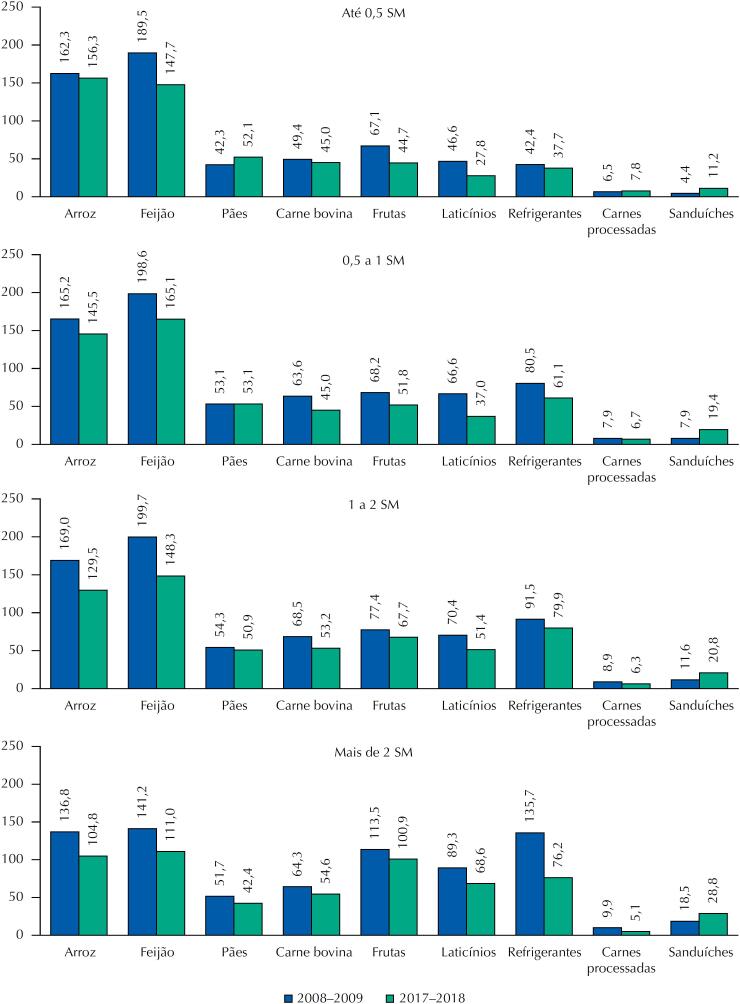
RESULTADOS:: Arroz, feijão, café, pães, hortaliças e carne bovina permaneceram como base da alimentação dos brasileiros, sendo os seis itens mais consumidos em ambos os inquéritos. Alimentos ultraprocessados, como biscoitos doces/recheados, biscoitos salgados, carnes processadas e refrigerantes, também se mantiveram entre os 20 alimentos mais consumidos. As análises de tendência evidenciaram, independentemente de sexo, idade e faixa de renda, a diminuição do consumo de arroz, feijão, carne bovina, pães, frutas, laticínios, carnes processadas e refrigerantes, e o aumento da ingestão de sanduíches.
CONCLUSÃO:: A dieta do brasileiro permanece caracterizada pelo consumo de alimentos tradicionais, como arroz e feijão, e pela frequência elevada de ingestão de alimentos ultraprocessados, como biscoitos e refrigerantes. No entanto, entre os anos de 2008–2009 e 2017–2018, observou-se redução no consumo de arroz, feijão, carne bovina, pães, frutas, laticínios, carnes processadas e refrigerantes, mas aumento no consumo de sanduíches. Os resultados sinalizam piora na qualidade da alimentação do brasileiro.
Conflict of interest statement
Figures
References
-
- Shan Z, Rehm CD, Rogers G, Ruan M, Wang DD, Hu FB, et al. Trends in dietary carbohydrate, protein, and fat intake and diet quality among US adults, 1999-2016. JAMA. 2019;322(12):1178-87. https://doi.org/10.1001/jama.2019.13771 - DOI - PMC - PubMed
-
- Instituto Brasileiro de Geografia e Estatística, Diretoria de Pesquisas, Coordenação de Trabalho e Rendimento. Pesquisa de Orçamentos Familiares 2017-2018: avaliação nutricional da disponibilidade domiciliar de alimentos no Brasil. Rio de Janeiro: IBGE, 2020.
-
- Canhada SL, Luft VC, Giatti L, Duncan BB, Chor D, Fonseca MJM, et al. Ultra-processed foods, incident overweight and obesity, and longitudinal changes in weight and waist circumference: The Brazilian Longitudinal Study of Adult Health (ELSA-Brasil). Public Health Nutr. 2020;23(6):1076-86. https://doi.org/10.1017/S1368980019002854 - DOI - PMC - PubMed
-
- Srour B, Fezeu LK, Kesse-Guyot E, Allès B, Debras C, Druesne-Pecollo N, et al. Ultraprocessed food consumption and risk of type 2 diabetes among participants of the NutriNet-Santé Prospective Cohort. JAMA Intern Med. 2020;180(2):283-91. https://doi.org/10.1001/jamainternmed.2019.5942 - DOI - PMC - PubMed
-
- Instituto Brasileiro de Geografia e Estatística, Diretoria de Pesquisas, Coordenação de Trabalho e Rendimento. Pesquisa de Orçamentos Familiares 2017-2018: análise da segurança alimentar no Brasil. Rio de Janeiro: IBGE, 2020.
MeSH terms
LinkOut - more resources
Full Text Sources
