. 2022 Jan 8;6(3):866-881.
doi: 10.1182/bloodadvances.2021005246.

C5a and C5aR1 are key drivers of microvascular platelet aggregation in clinical entities spanning from aHUS to COVID-19

Affiliations

C5a and C5aR1 are key drivers of microvascular platelet aggregation in clinical entities spanning from aHUS to COVID-19

Sistiana Aiello et al. Blood Adv. .

Erratum in

Abstract

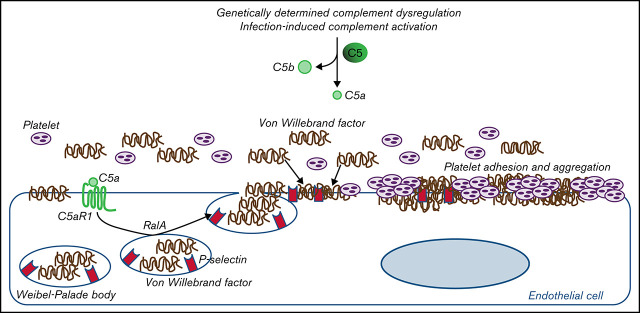
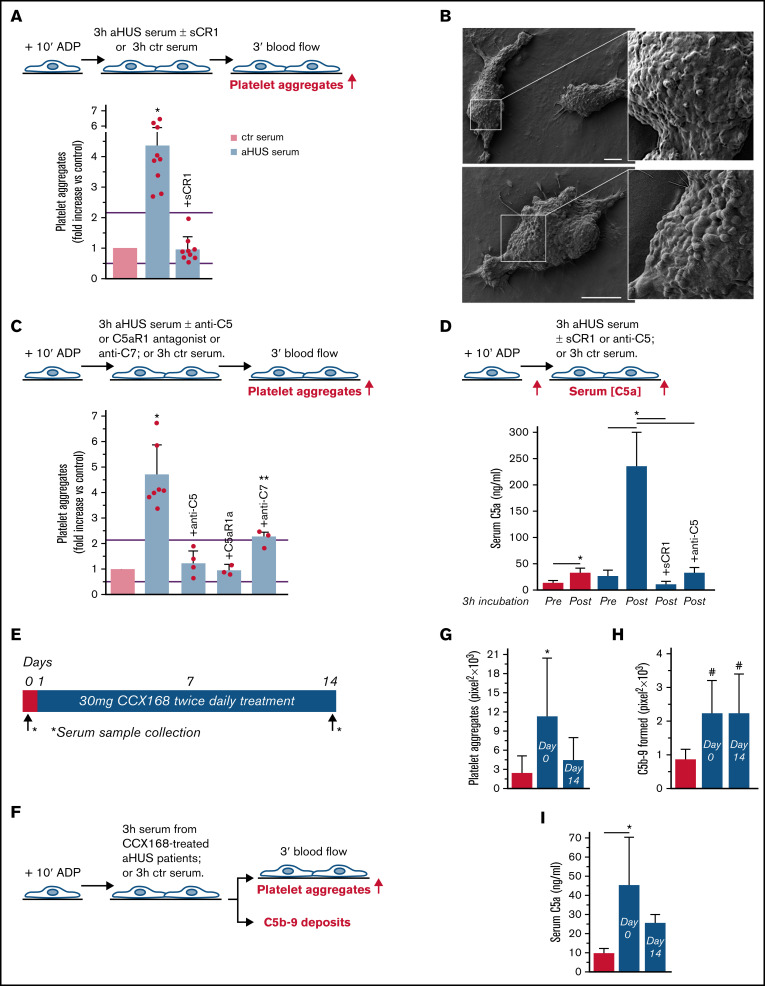
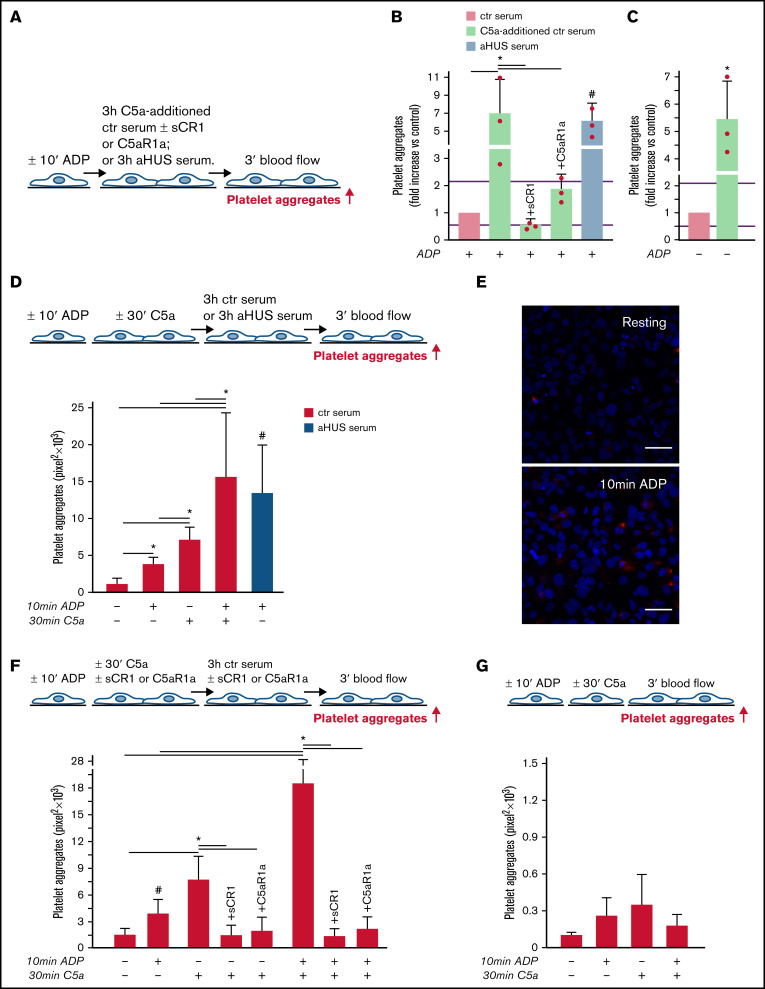
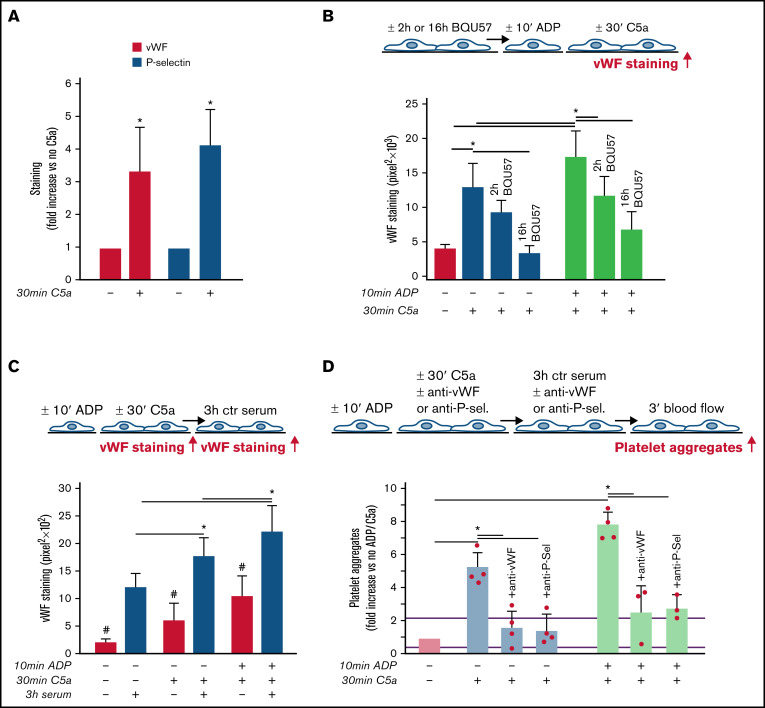
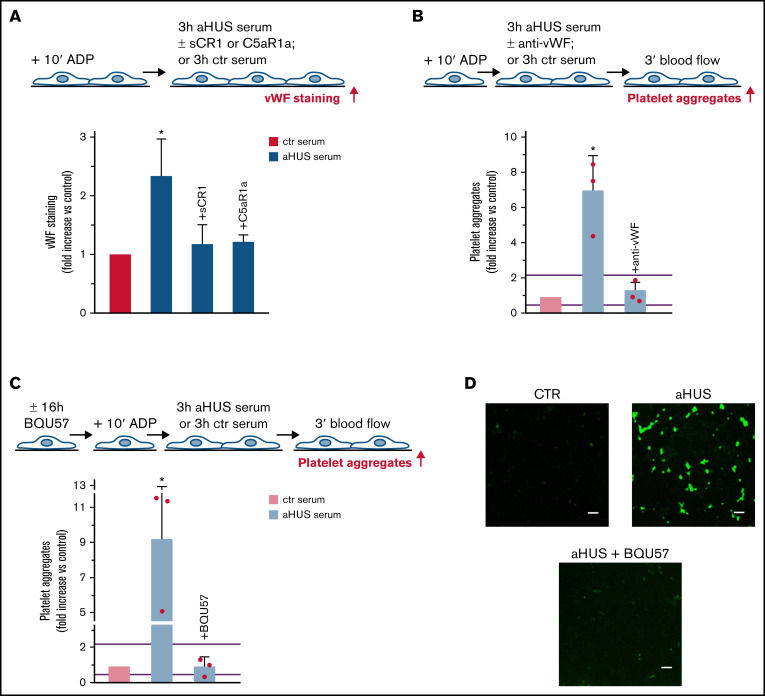
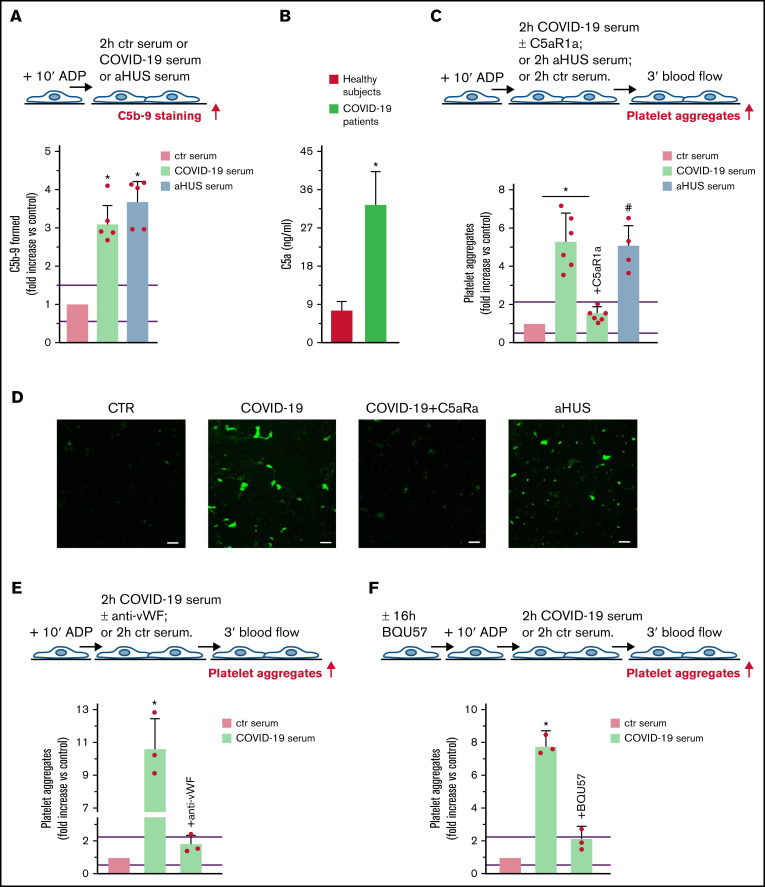
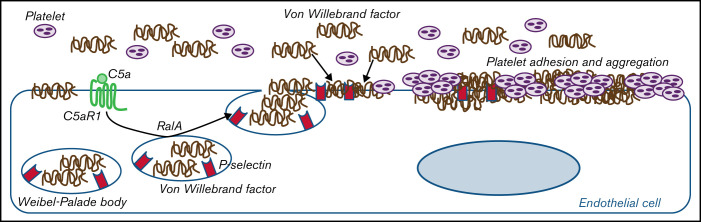
Unrestrained activation of the complement system till the terminal products, C5a and C5b-9, plays a pathogenetic role in acute and chronic inflammatory diseases. In endothelial cells, complement hyperactivation may translate into cell dysfunction, favoring thrombus formation. The aim of this study was to investigate the role of the C5a/C5aR1 axis as opposed to C5b-9 in inducing endothelial dysfunction and loss of antithrombogenic properties. In vitro and ex vivo assays with serum from patients with atypical hemolytic uremic syndrome (aHUS), a prototype rare disease of complement-mediated microvascular thrombosis due to genetically determined alternative pathway dysregulation, and cultured microvascular endothelial cells, demonstrated that the C5a/C5aR1 axis is a key player in endothelial thromboresistance loss. C5a added to normal human serum fully recapitulated the prothrombotic effects of aHUS serum. Mechanistic studies showed that C5a caused RalA-mediated exocytosis of von Willebrand factor (vWF) and P-selectin from Weibel-Palade bodies, which favored further vWF binding on the endothelium and platelet adhesion and aggregation. In patients with severe COVID-19 who suffered from acute activation of complement triggered by severe acute respiratory syndrome coronavirus 2 infection, we found the same C5a-dependent pathogenic mechanisms. These results highlight C5a/C5aR1 as a common prothrombogenic effector spanning from genetic rare diseases to viral infections, and it may have clinical implications. Selective C5a/C5aR1 blockade could have advantages over C5 inhibition because the former preserves the formation of C5b-9, which is critical for controlling bacterial infections that often develop as comorbidities in severely ill patients. The ACCESS trial registered at www.clinicaltrials.gov as #NCT02464891 accounts for the results related to aHUS patients treated with CCX168.


Figures

None
Graphical abstract
Figure 1.
Figure 1.
Serum from patients with aHUS induces platelet adhesion and aggregation on microvascular endothelial cells through C5a/C5aR1 signaling. (A, upper panel) Experimental design. HMEC-1 were activated with ADP, exposed for 3 hours to ctr serum or serum from patients with aHUS in remission, and then perfused for 3 minutes with heparinized whole blood, added with mepacrine, from healthy subjects. aHUS serum was added or not with the pan complement inhibitor sCR1 (150 μg/mL). Formation of platelet aggregates was evaluated at the end of blood perfusion (through confocal microscopy). (A, lower panel) Endothelial surface area with positive staining for platelet aggregates. Results are shown as fold increase of stained surface area after incubation with ctr serum run in parallel. Data are mean ± SD; n = 9 independent experiments. Red points represent fold increase values of single experiments. Purple lines are the upper and lower limits of normal range. (B) Representative images of the ultrastructure of aggregates of platelets adhered on HMEC-1 preexposed to aHUS serum, evaluated with scanning electron microscopy at low magnification (left panels), with the corresponding high magnification insets (right panels). Insets show high-power view of same platelet aggregate. Scale bars represent 10 µm (n = 2 experiments). (C, upper panel) Experimental design. HMEC-1 were activated with ADP, exposed for 3 hours to ctr or aHUS serum, and then perfused for 3 minutes with heparinized whole blood, added with mepacrine, from healthy subjects. aHUS serum was added or not, with an anti-C5 antibody (135 μg/mL), or the C5aR1 antagonist CCX168 (200 ng/mL), or an anti-C7 antibody (350 μg/mL). Formation of platelet aggregates was evaluated at the end of the blood perfusion. (C, lower panel) Endothelial surface area covered by platelet aggregates. Results are shown as fold increase of stained surface area after incubation with ctr serum run in parallel. Data are mean ± SD; n = 4 independent experiments for +anti-C5; n = 3 independent experiments for +C5aR1a and +anti-C7. Red points represent fold increase values of single experiments. Purple lines are the upper and lower limits of normal range. (D, upper panel) Experimental design. HMEC-1 were activated with ADP and then exposed for 3 hours to ctr or aHUS serum. aHUS serum was added or not with sCR1 (150 μg/mL) or the anti-C5 antibody (135 μg/mL). Serum C5a levels were measured before and after incubation. (D, lower panel) C5a concentration in ctr or aHUS serum before and after incubation with ADP-activated HMEC-1. Data are mean ± SD; n = 3 independent experiments. (E) Scheme of treatment with the C5a receptor antagonist CCX168 and serum sample collection in patients with aHUS enrolled in the ACCESS study. (F) Experimental design. HMEC-1 were activated with ADP, exposed for 3 hours to ctr serum or serum from patients with aHUS (taken before treatment with CCX168, day 0, and after 14 days of treatment), and then analyzed for C5b-9 deposits or perfused for 3 minutes with heparinized whole blood, added with mepacrine, from healthy subjects. Formation of platelet aggregates was evaluated at the end of blood perfusion. (G-H) Endothelial surface area with positive staining for platelet aggregates (G) or C5b-9 (H) after incubation of ADP-activated HMEC-1 with ctr serum or serum from patients with aHUS treated with CCX168 collected at days 0 and 14 of the study. Data are mean ± SD of cumulative data from 5 patients. (I) C5a levels in ctr serum or in serum from patients with aHUS taken before treatment with CCX168, day 0, and after 14 days of treatment (n = 5). *P < .05 vs the groups indicated by horizontal bar or, if not indicated, vs all groups. **P < .05 vs +C5aR1a. #P < .05 vs ctr serum.
Figure 2.
Figure 2.
C5a and normal human serum (ctr) induces platelet adhesion and aggregation on HMEC-1. (A) Experimental design. HMEC-1, ADP-activated or resting, were exposed for 3 hours to ctr serum with or without the addition of C5a (200 ng/mL) or to aHUS serum, and then perfused for 3 minutes with heparinized whole blood, added with mepacrine, from healthy subjects. C5a-additioned serum was tested in the presence or absence of sCR1 (150 μg/mL) or the C5aR1 antagonist CCX168 (200 ng/mL). Formation of platelet aggregates was evaluated at the end of the blood perfusion. (B-C) Effect of C5a-additioned ctr serum on formation of platelet aggregates on HMEC-1 (B, ADP-activated; C, resting). Results are shown as fold increase of stained surface area after incubation with ctr serum alone run in parallel. Data are mean ± SD; n = 3 independent experiments. Red points represent fold increase values of single experiments. Purple lines are the upper and lower limits of normal range. *P < .05 vs the groups indicated by horizontal bar. #P < .05 vs ctr serum. (D, upper panel) Experimental design. HMEC-1 were activated or not with ADP for 10 minutes and then stimulated or not with C5a for 30 minutes, exposed for 3 hours to ctr serum, and perfused for 3 minutes with heparinized whole blood, added with mepacrine, from healthy subjects. On selected slides, ADP-activated cells were exposed to aHUS serum, taken as the positive control. Formation of platelet aggregates was evaluated at the end of the blood perfusion. (D, lower panel) Endothelial surface area covered by platelet aggregates after incubation with ctr serum of resting (no ADP, no C5a), ADP-activated, C5a-stimulated or ADP-activated/C5a-stimulated HMEC-1; or after incubation with aHUS serum. Data are mean ± SD; n = 4 independent experiments. *P < .05 vs the groups indicated by horizontal bar. #P < .05 vs resting and ADP-activated HMEC-1 + ctr serum. (E) Representative images of immunostaining for C5aR1 (red staining) on resting or ADP-activated HMEC-1. Blue: DAPI staining. Original magnification: ×400. Scale bar represents 50 μm. (F, upper panel) Experimental design. HMEC-1 were activated or not with ADP for 10 minutes and then stimulated or not with C5a for 30 minutes, exposed for 3 hours to ctr serum, and perfused for 3 minutes with heparinized whole blood, added with mepacrine, from healthy subjects. In 3 of 4 experiments, additional samples were run in which either sCR1 (150 μg/mL) or the C5aR1 antagonist CCX168 (200 ng/mL) were added during the C5a stimulation and the exposure to serum. Formation of platelet aggregates was evaluated at the end of blood perfusion. (F, lower panel) Endothelial surface area covered by platelet aggregates after incubation with ctr serum of resting, ADP-activated, C5a-stimulated or ADP-activated/C5a-stimulated HMEC-1. Data are mean ± SD; n = 3 to 4 independent experiments. *P < .05 vs the groups indicated by horizontal bar. #P < .05 vs resting. (G, upper panel) Experimental design. HMEC-1 were activated or not with ADP for 10 minutes and then stimulated or not with C5a for 30 minutes and perfused for 3 minutes with heparinized whole blood, added with mepacrine, from healthy subjects. Formation of platelet aggregates was evaluated at the end of blood perfusion. (G, lower panel) Endothelial surface area covered by platelet aggregates on resting, ADP-activated, C5a-stimulated or ADP-activated/C5a-stimulated HMEC-1. Data are mean ± SD; n = 3 independent experiments.
Figure 3.
Figure 3.
Role of vWF and P-selectin in C5a-induced platelet adhesion and aggregation on HMEC-1. (A) Endothelial surface area stained for vWF or P-selectin on resting or C5a-stimulated HMEC-1. Results are shown as fold increase of stained area on resting HMEC-1. Data are mean ± SD; n = 4 (vWF) or 3 (P-selectin) independent experiments. *P < .05 vs no stimulation. (B, upper panel) Experimental design. Before the experiment, HMEC-1 were left for 2 hours or 16 hours with medium added or not with the RalA inhibitor BQU57 (10 µM). Thereafter, HMEC-1 were activated or not for 10 minutes with ADP and then stimulated or not for 30 minutes with C5a (200 ng/mL). vWF staining was performed at the end of C5a stimulation. (B, lower panel) Endothelial surface area stained for vWF. Data are mean ± SD of 13 fields; n = 1 to 2 experiments. *P < .05 vs the groups indicated by horizontal bar. (C, upper panel) Experimental design. HMEC-1 were activated or not with ADP and then stimulated or not with C5a and exposed or not for 3 hours to ctr serum. vWF staining was performed at the end of C5a stimulation or exposure to serum. (C, lower panel) Endothelial surface area stained for vWF. Mean ± SD of 13 fields. *P < .05. #P < .05 vs the corresponding condition with serum. (D, upper panel) Experimental design. HMEC-1 were activated or not with ADP and then stimulated or not with C5a, exposed for 3 hours to ctr serum and then perfused for 3 minutes with heparinized whole blood, added with mepacrine, from healthy subjects. In 3 of 4 experiments, either an anti-vWF (10 μg/mL) or an anti-P-selectin (20 μg/mL) antibody was added during the C5a stimulation and the exposure to serum. Formation of platelet aggregates was evaluated at the end of blood perfusion. (D, lower panel) Endothelial surface area covered by platelet aggregates on resting (no ADP, no C5a), C5a-stimulated, or ADP-activated/C5a-stimulated HMEC-1 incubated with ctr serum. Results are shown as fold increase of stained surface area on resting HMEC-1 incubated with ctr serum alone run in parallel. Data are mean ± SD; n = 3 to 4 independent experiments. Red points represent fold increase values of single experiments. Purple lines are the upper and lower limits of normal range. *P < .05 vs the groups indicated by horizontal bar.
Figure 4.
Figure 4.
Role of vWF and exocytosis of WPBs in aHUS serum-induced platelet adhesion and aggregation on HMEC-1. (A, upper panel) Experimental design. HMEC-1 were activated with ADP and then exposed for 3 hours to ctr or aHUS serum. aHUS serum was added or not with sCR1 (150 μg/mL) or the C5aR1 antagonist CCX168 (200 ng/mL). vWF staining was performed at the end of exposure to serum. (A, lower panel) Endothelial surface area stained for vWF. Results are shown as fold increase of stained area after incubation, with aHUS serum (n = 4) vs ctr serum run in parallel. Data are mean ± SD. *P < .05 vs all groups. (B, upper panel) Experimental design. ADP-activated HMEC-1 were exposed for 3 hours to ctr or aHUS serum and then perfused for 3 minutes with heparinized whole blood, added with mepacrine, from healthy subjects. aHUS serum was added or not with an anti-vWF antibody (10 μg/mL). Formation of platelet aggregates was evaluated at the end of blood perfusion. (B, lower panel) Endothelial surface area covered by platelet aggregates. Results are shown as fold increase of surface area covered by platelet aggregates after incubation with aHUS serum (n = 3) vs ctr serum run in parallel. Data are mean ± SD. Red points represent fold increase values of single patients. Purple lines are the upper and lower limits of normal range. *P < .05 vs all groups. (C, upper panel) Experimental design. Before the experiment, HMEC-1 were left for 16 hours in medium with or without the RalA inhibitor BQU57 (10 µM). Thereafter, HMEC-1 were activated for 10 minutes with ADP, exposed for 3 hours to ctr or aHUS serum, and then perfused for 3 minutes with heparinized whole blood, added with mepacrine, from healthy subjects. Formation of platelet aggregates was evaluated at the end of blood perfusion. (C, lower panel) Endothelial surface area covered by platelet aggregates. Results are shown as fold increase of stained surface area after incubation with aHUS serum (n = 3) vs ctr serum run in parallel. Data are mean ± SD. Red points represent fold increase values of single patients. Purple lines are the upper and lower limits of normal range. *P < .05 vs all groups. (D) Representative images of experiments (green staining) relative to Figure 4C. Original magnification ×200. Scale bar represents 50 μm.
Figure 5.
Figure 5.
Terminal complement activation, and role of C5a/C5aR1 signaling in COVID-19 serum-induced platelet adhesion and aggregation on HMEC-1. (A) Endothelial surface area covered by staining for C5b-9 after incubation of ADP-activated HMEC-1 for 2 hours with ctr serum, or serum from patients with COVID-19 or aHUS, taken as positive controls. Results are shown as fold increase of stained surface area after incubation with ctr serum run in parallel. Data are mean ± SD n = 5 independent experiments. Red points represent fold increase values of single experiments. Purple lines are the upper and lower limits of normal range (calculated as shown in supplemental Figure 2). *P < .05 vs control. (B) C5a levels in plasma from healthy subjects (n = 10) or patients with COVID-19 (n = 4). Data are mean ± SD. *P < .05 vs healthy subjects. (C, upper panel) Experimental design. ADP-activated HMEC-1 were exposed for 2 hours to ctr serum or serum from patients with COVID-19 or aHUS taken as positive control, and then perfused for 3 minutes with heparinized whole blood, added with mepacrine, from healthy subjects. COVID-19 serum was added or not with the C5aR1 antagonist CCX168 (200 ng/mL). Formation of platelet aggregates was evaluated at the end of blood perfusion. (C, lower panel) Endothelial surface area covered by platelet aggregates. Results are shown as fold increase of stained surface area after incubation with COVID-19 serum (n = 6) or aHUS serum (n = 4) vs ctr serum run in parallel. Data are mean ± SD. Red points represent fold increase values of single patients. Purple lines are the upper and lower limits of normal range. *P < .05 vs the groups indicated by horizontal bar. #P < .05 vs ctr serum. (D) Representative images of experiments (green staining) relative to Figure 5C. Original magnification ×200. Scale bar represents 50 μm. (E, upper panel) Experimental design. ADP-activated HMEC-1 were exposed for 2 hours to ctr serum or serum from patients with COVID-19 and then perfused for 3 minutes with heparinized whole blood, added with mepacrine, from healthy subjects. COVID-19 serum was added or not with an anti-vWF antibody (10 μg/mL). Formation of platelet aggregates was evaluated at the end of blood perfusion. (E, lower panel) Endothelial surface area covered by platelet aggregates. Results are shown as fold increase of stained surface area after incubation with COVID-19 serum (n = 3) vs ctr serum run in parallel. Data are mean ± SD. Red points represent fold increase values of single patients. Purple lines are the upper and lower limits of normal range. *P < .05 vs all groups. (F, upper panel) Experimental design. Before the experiment, HMEC-1 were left for 16 hours in medium with or without the RalA inhibitor BQU57 (10 µM). Thereafter, HMEC-1 were activated for 10 minutes with ADP, exposed for 2 hours to ctr serum or COVID-19 serum, and then perfused for 3 minutes with heparinized whole blood, added with mepacrine, from healthy subjects. Formation of platelet aggregates was evaluated at the end of blood perfusion. (F, lower panel) Endothelial surface area covered by platelet aggregates. Results are shown as fold increase of stained surface area after incubation with COVID-19 serum (n = 3) vs ctr serum run in parallel. Data are mean ± SD. Red points represent fold increase values of single patients. Purple lines are the upper and lower limits of normal range. *P < .05 vs all groups.
Figure 6.
Figure 6.
Proposed mechanism underlying the pro-thrombotic action of C5a/C5aR1 signaling. Upon engagement with its receptor C5aR1, C5a induces the activation of RalA, which leads to the exocytosis of Weibel-Palade bodies (WPB). Then, vWF and P-selectin are exocytosed from WPBs, providing an adhesive scaffold on which circulating vWF is in turn recruited. As a consequence for the above events, massive platelet adhesion and aggregation occur on the endothelial cell surface.

Similar articles

Cited by

References

    1. Roumenina LT, Rayes J, Frimat M, Fremeaux-Bacchi V. Endothelial cells: source, barrier, and target of defensive mediators. Immunol Rev. 2016;274(1):307-329. - PubMed
    1. Lindemann S, Krämer B, Seizer P, Gawaz M. Platelets, inflammation and atherosclerosis. J Thromb Haemost. 2007;5(suppl 1):203-211. - PubMed
    1. Noris M, Remuzzi G. Overview of complement activation and regulation. Semin Nephrol. 2013;33(6):479-492. - PMC - PubMed
    1. Walport MJ. Complement. First of two parts. N Engl J Med. 2001;344(14):1058-1066. - PubMed
    1. Tegla CA, Cudrici C, Patel S, et al. . Membrane attack by complement: the assembly and biology of terminal complement complexes. Immunol Res. 2011;51(1):45-60. - PMC - PubMed

Publication types

Associated data