. 2022 Mar 3;139(9):1359-1373.
doi: 10.1182/blood.2021013826.

The RNA-binding protein SRSF3 has an essential role in megakaryocyte maturation and platelet production

Affiliations

The RNA-binding protein SRSF3 has an essential role in megakaryocyte maturation and platelet production

Shen Y Heazlewood et al. Blood. .

Abstract

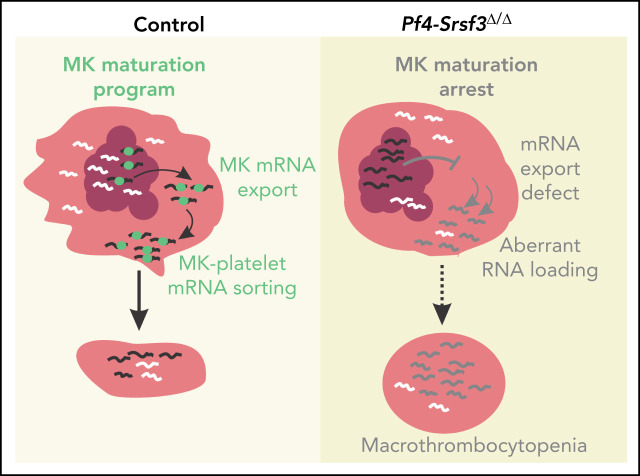
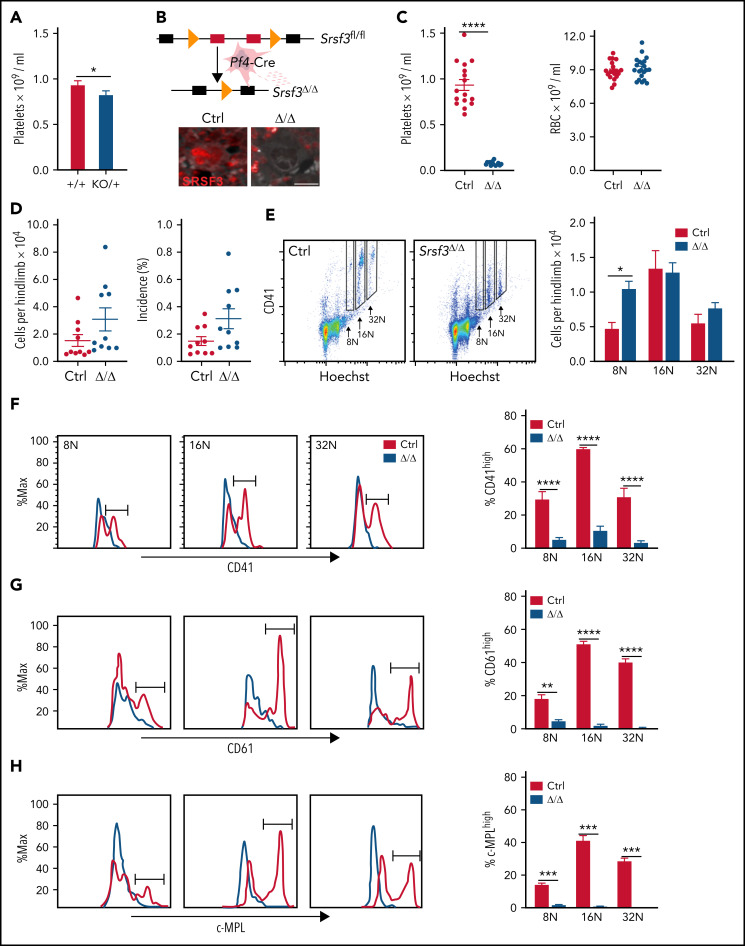
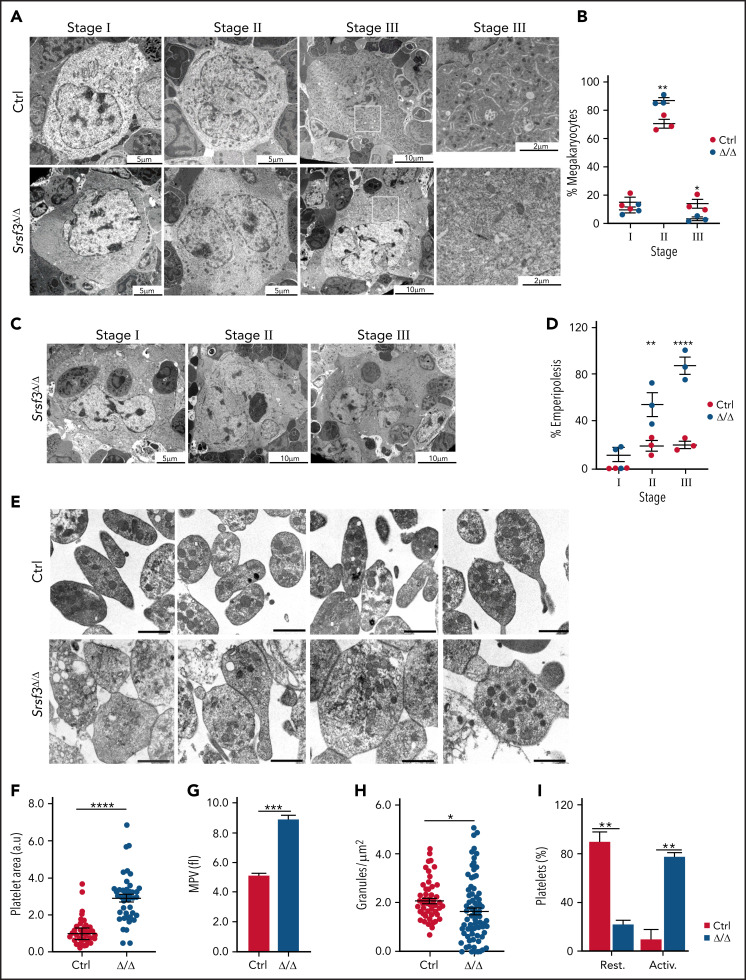
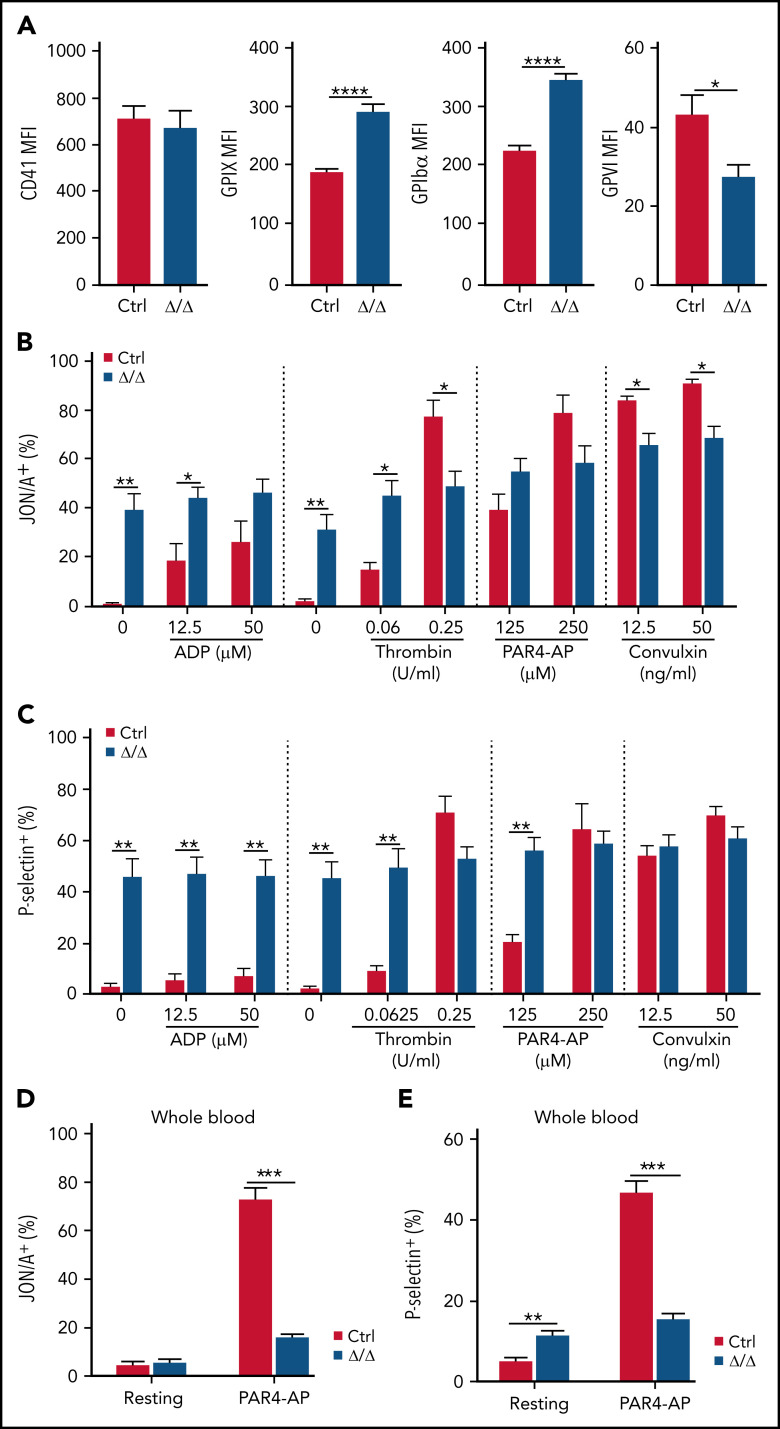
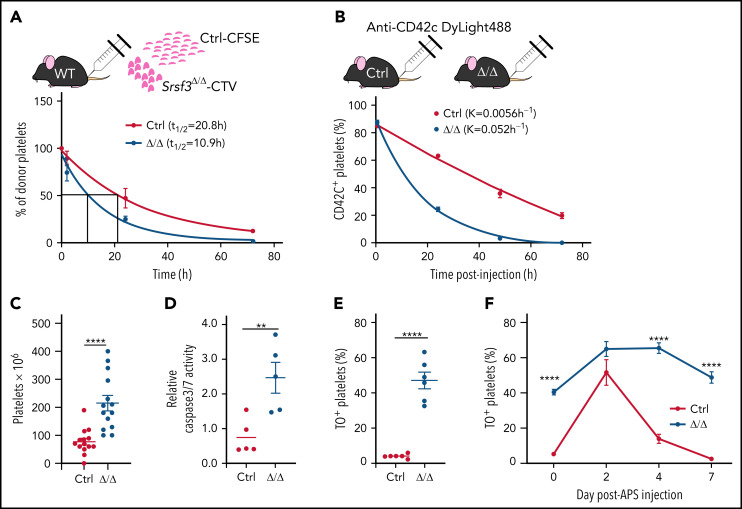
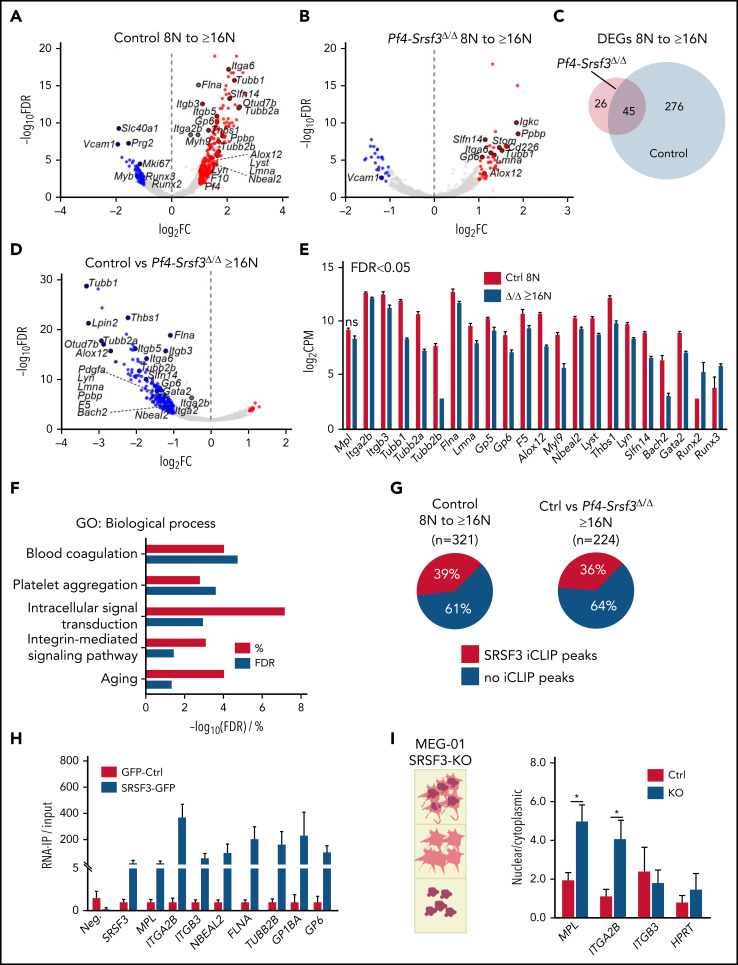
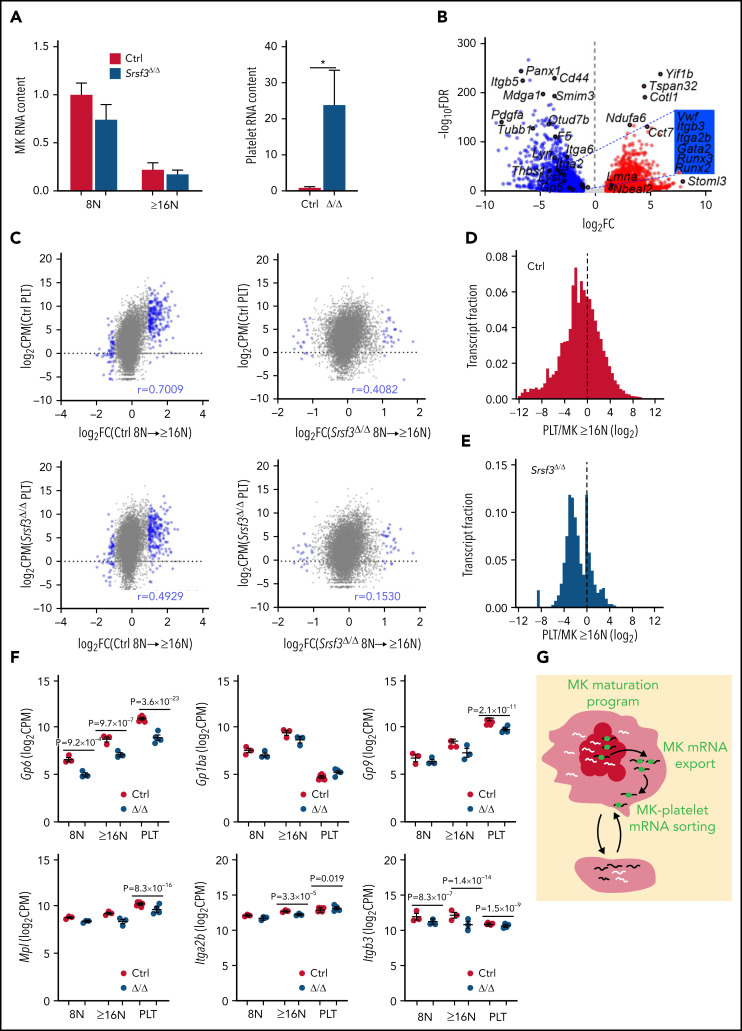
RNA processing is increasingly recognized as a critical control point in the regulation of different hematopoietic lineages including megakaryocytes responsible for the production of platelets. Platelets are anucleate cytoplasts that contain a rich repertoire of RNAs encoding proteins with essential platelet functions derived from the parent megakaryocyte. It is largely unknown how RNA binding proteins contribute to the development and functions of megakaryocytes and platelets. We show that serine-arginine-rich splicing factor 3 (SRSF3) is essential for megakaryocyte maturation and generation of functional platelets. Megakaryocyte-specific deletion of Srsf3 in mice led to macrothrombocytopenia characterized by megakaryocyte maturation arrest, dramatically reduced platelet counts, and abnormally large functionally compromised platelets. SRSF3 deficient megakaryocytes failed to reprogram their transcriptome during maturation and to load platelets with RNAs required for normal platelet function. SRSF3 depletion led to nuclear accumulation of megakaryocyte mRNAs, demonstrating that SRSF3 deploys similar RNA regulatory mechanisms in megakaryocytes as in other cell types. Our study further suggests that SRSF3 plays a role in sorting cytoplasmic megakaryocyte RNAs into platelets and demonstrates how SRSF3-mediated RNA processing forms a central part of megakaryocyte gene regulation. Understanding SRSF3 functions in megakaryocytes and platelets provides key insights into normal thrombopoiesis and platelet pathologies as SRSF3 RNA targets in megakaryocytes are associated with platelet diseases.


Figures

None
Graphical abstract
Figure 1.
Figure 1.
SRSF3 depletion in MKs leads to severe thrombocytopenia without a change in MK numbers. (A) Platelet counts of heterozygous mice (KO/+) with a systemic Srsf3 deletion compared with wild-type mice (+/+) (n = 6). (B) Top: Generation of a mouse model where Srsf3 is deleted in MKs (Pf4-Srsf3Δ/Δ). Bottom: Anti-SRSF3 immunohistochemistry in Pf4-Srsf3Δ/Δ and control bone marrow sections. (C) Platelet and red blood cell (RBC) counts of control and Pf4-Srsf3Δ/Δ mice. (D) The total number and incidence of bone marrow MKs in control and Pf4-Srsf3Δ/Δ mice. (E) The number of MKs of individual ploidy in control and Pf4-Srsf3Δ/Δ bone marrow. (F) CD41, (G) CD61, and (H) c-MPL cell surface receptor expression of control and Pf4-Srsf3Δ/Δ MKs. A histogram of a representative mouse is shown (n = 4). The proportion of events in the gate marked in the histogram (CD41/CD61/c-MPLhigh) is quantified on the right. The data are presented as mean plus or minus standard error of the mean (SEM). Two-tailed unpaired Student t test in panels A and C through D; 2-way analysis of variance (ANOVA) in panels E through H. ****P ≤ .0001; ***P ≤ .001; **P ≤ .01; *P ≤ .05. Δ/Δ, Pf4-Srsf3Δ/Δ mice; Ctrl, control.
Figure 2.
Figure 2.
SRSF3 depletion leads to MK maturation arrest and macrothrombocytopenia. (A) Representative TEM images depicting the ultrastructure of control and Pf4-Srsf3Δ/Δ MKs at stage I, II, and III of maturation. Scale bars represent 5, 10, and 10 µm, respectively. On the right, a higher magnification of the boxed areas in stage III MKs. Scale bars represent µm. (B) Quantification of control and Pf4-Srsf3Δ/Δ MKs at each stage of maturation. (C) Representative TEM images of Pf4-Srsf3Δ/Δ MKs at stage I, II, and III of maturation displaying emperipolesis. Scale bars represent 5, 10, and 10 µm, respectively. (D) Quantification of the fraction of Pf4-Srsf3Δ/Δ MKs at each maturation stage displaying emperipolesis. (E) Representative TEM images of control and Pf4-Srsf3Δ/Δ platelets. Scale bars are 1 μm. (F) Quantification of control and Pf4-Srsf3Δ/Δ platelet area. (G) Mean platelet volume of control and Pf4-Srsf3Δ/Δ platelets. (H) Quantification of the number of granules in control and Pf4-Srsf3Δ/Δ platelets. (I) Quantification of the fraction of resting and activated control and Pf4-Srsf3Δ/Δ platelets. Platelets with filopodia, rounded shape, and/or centralised granules were classified as activated. The data are presented as mean plus or minus SEM. Two-way ANOVA in panels B and D and 2-tailed unpaired Student t test in panels F through I. ****P ≤ .0001; ***P ≤ .001; **P ≤ .01; *P ≤ .05. Activ, activated; rest, resting.
Figure 3.
Figure 3.
Srsf3-null platelets are preactivated. (A) The mean fluorescence intensity (MFI) of CD41, GPIX, GPIbα, and GPVI cell surface receptors in control and Pf4-Srsf3Δ/Δ platelets assessed in diluted whole blood. (B-C) The expression of activated Integrin-αIIb-β3 receptor (JON/A) and P-selectin on the surface of washed control and Pf4-Srsf3Δ/Δ platelets following agonist stimulation. (D-E) The expression of activated Integrin-αIIb-β3 receptor (JON/A) and P-selectin on the surface of control and Pf4-Srsf3Δ/Δ platelets from diluted whole blood. The data are presented as mean plus or minus SEM. Two-tailed unpaired Student t test. ***P ≤ .001; **P ≤ .01; *P ≤ .05.
Figure 4.
Figure 4.
Srsf3-null platelets are rapidly cleared from circulation. (A) The half-life of control and Pf4-Srsf3Δ/Δ platelets as measured by the transplantation of CFSE- and CTV-labeled platelets, respectively, into wild-type mice. The data were fitted to a 1-phase exponential decay curve, and the half-life (t1/2) for control (R2 = 0.932) and Srsf3Δ/Δ (R2 = 0.937) platelets is depicted in the inset. (B) The clearance rate of control and Pf4-Srsf3Δ/Δ platelets as measured by in vivo labeling of platelets by anti-CD42c DyLight488 antibody in control and Pf4-Srsf3Δ/Δ mice. The data were fitted to a 1-phase exponential decay curve, and the rate constant K for control (R2 = 0.991) and Srsf3Δ/Δ (R2 = 0.996) platelets is depicted in the inset. (C) The number of platelets in the spleen of control and Pf4-Srsf3Δ/Δ mice. (D) Relative Caspase 3/7 activity in control and Pf4-Srsf3Δ/Δ platelets. (E) Fraction of reticulated TO+ platelets in control and Pf4-Srsf3Δ/Δ mice in the steady-state. (F) The fraction of TO+ platelets in control and Pf4-Srsf3Δ/Δ mice following antiplatelet serum (APS) administration. The data are presented as mean plus or minus SEM. Two-tailed unpaired Student t test in panels C through E; 2-way ANOVA in panel F. ****P ≤ .0001; **P ≤ .01. CFSE, carboxyfluorescein succinimidyl ester; CTV, CellTrace™ Violet.
Figure 5.
Figure 5.
The RNA repertoire of Srsf3-null MKs reflects the failure in activating the maturation program. (A) Volcano plots depicting differentially expressed genes (DEGs) between control 8N and ≥16N MKs. The data points marked with blue and red denote significantly down- and upregulated genes (FDR <0.05 and FC >2), respectively. (B) Volcano plots depicting DEGs between Pf4-Srsf3Δ/Δ 8N and ≥16N MKs as in panel A. (C) Venn diagram comparing DEGs in control and Pf4-Srsf3Δ/Δ MKs upon 8N to ≥16N transition. (D) Volcano plot depicting DEGs between control and Pf4-Srsf3Δ/Δ ≥16N MKs as in panel A. (E) Expression of genes encoding proteins central for MK structure and function in control and Pf4-Srsf3Δ/Δ ≥6N MKs. FDR <0.05 unless otherwise noted. (F) Significantly enriched GO terms (Biological Process) among DEGs between control and Pf4-Srsf3Δ/Δ ≥16N MKs (FDR <0.05, FC >2). The x-axis depicts percent genes and -log10 (FDR) of each category. (G) Percentage of RNAs with SRSF3 RNA binding sites (iCLIP peaks) as identified in mouse pluripotent stem cells within RNAs induced during MK maturation (left) or differentially expressed between control and Pf4-Srsf3Δ/Δ ≥16N MKs (right). (H) RNA immunoprecipitation (IP) using anti-GFP antibody in MEG-01 megakaryoblast cell lines expressing SRSF3-GFP or only GFP. The y-axis denotes the enrichment of SRSF3 RNA binding over input as measured by RT-qPCR (n = 3). Neg. is a nontarget and SRSF3 a known-target control to demonstrate the specificity of the RNA-IP. (I) Quantification of RNAs in the nuclear and cytoplasmic fractions of MEG-01 cells following SRSF3 deletion by CRISPR/Cas9 gene editing. The data are presented as a ratio of nuclear and cytoplasmic mRNA abundance (n = 3). *P ≤ .05. Ctrl, MEG-01 cells targeted with scrambled control guide RNA; FC, fold change; FDR, false discovery rate; KO, MEG-01 cells targeted with SRSF3 guide RNA; ns, not significant.
Figure 6.
Figure 6.
SRSF3 depletion in MKs results in aberrant loading of RNA into platelets. (A) Relative RNA content of control and Pf4-Srsf3Δ/Δ MKs and platelets (n = 3-6). (B) Volcano plot depicting differential RNA repertoire between control and Pf4-Srsf3Δ/Δ platelets. The data points marked with blue were significantly less abundant in Pf4-Srsf3Δ/Δ platelets, and the points marked in red were more abundant when compared with control (FDR <0.05, FC >2). (C) Pearson correlation between DEGs during MK maturation (FDR <0.05, FC = 2) and platelet RNA levels. (D-E) Frequency distribution histograms of platelet/MK RNA abundance ratio (platelet CPM/MK ≥16N CPM) in control and Pf4-Srsf3Δ/Δ. The dotted line marks 0. (F) Levels of RNAs encoding proteins central for platelet function in control and Pf4-Srsf3Δ/Δ 8N and ≥16N MKs and platelets. (G) A schematic depicting how SRSF3 governs a MK maturation program through RNA regulatory mechanisms such as mRNA export and guides the deposition of RNA into platelets. In the schematic, the black lines represent SRSF3 target RNAs in MKs, white lines, other MK RNAs and green balls are SRSF3. The data in panels A and F is presented as mean plus or minus SEM. Two-tailed unpaired Student t test; *P ≤ .05. CPM; counts per million; PLT, platelet.

Similar articles

Cited by

References

    1. Italiano JE Jr. Unraveling mechanisms that control platelet production. Semin Thromb Hemost. 2013;39(1):15-24. - PubMed
    1. Bluteau D, Lordier L, Di Stefano A, et al. . Regulation of megakaryocyte maturation and platelet formation. J Thromb Haemost. 2009;7(Suppl 1):227-234. - PubMed
    1. Machlus KR, Italiano JE Jr. The incredible journey: from megakaryocyte development to platelet formation. J Cell Biol. 2013;201(6):785-796. - PMC - PubMed
    1. Maclachlan A, Watson SP, Morgan NV. Inherited platelet disorders: insight from platelet genomics using next-generation sequencing. Platelets. 2017;28(1):14-19. - PMC - PubMed
    1. Nurden AT, Nurden P. Inherited disorders of platelet function: selected updates. J Thromb Haemost. 2015;13(Suppl 1):S2-S9. - PubMed

Publication types

MeSH terms