. 2021 Dec 20;56(24):3364-3379.e10.
doi: 10.1016/j.devcel.2021.11.009. Epub 2021 Nov 30.

Cell cycle regulation of ER membrane biogenesis protects against chromosome missegregation

Affiliations

Cell cycle regulation of ER membrane biogenesis protects against chromosome missegregation

Holly Merta et al. Dev Cell. .

Abstract

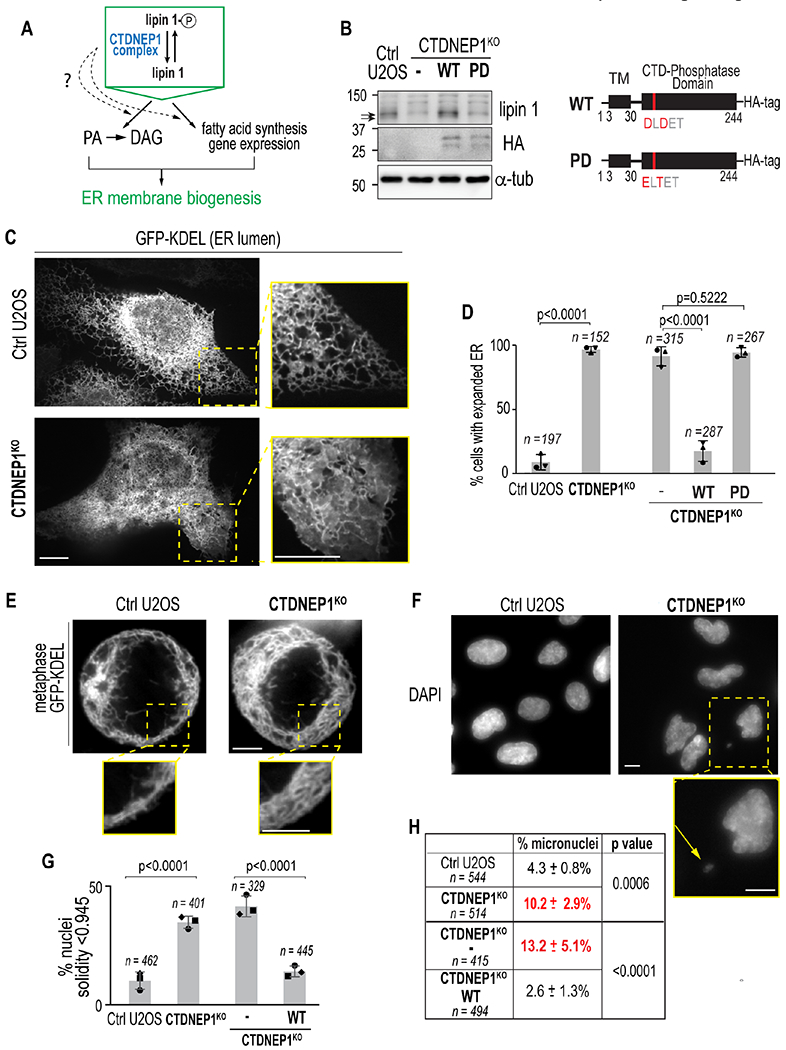
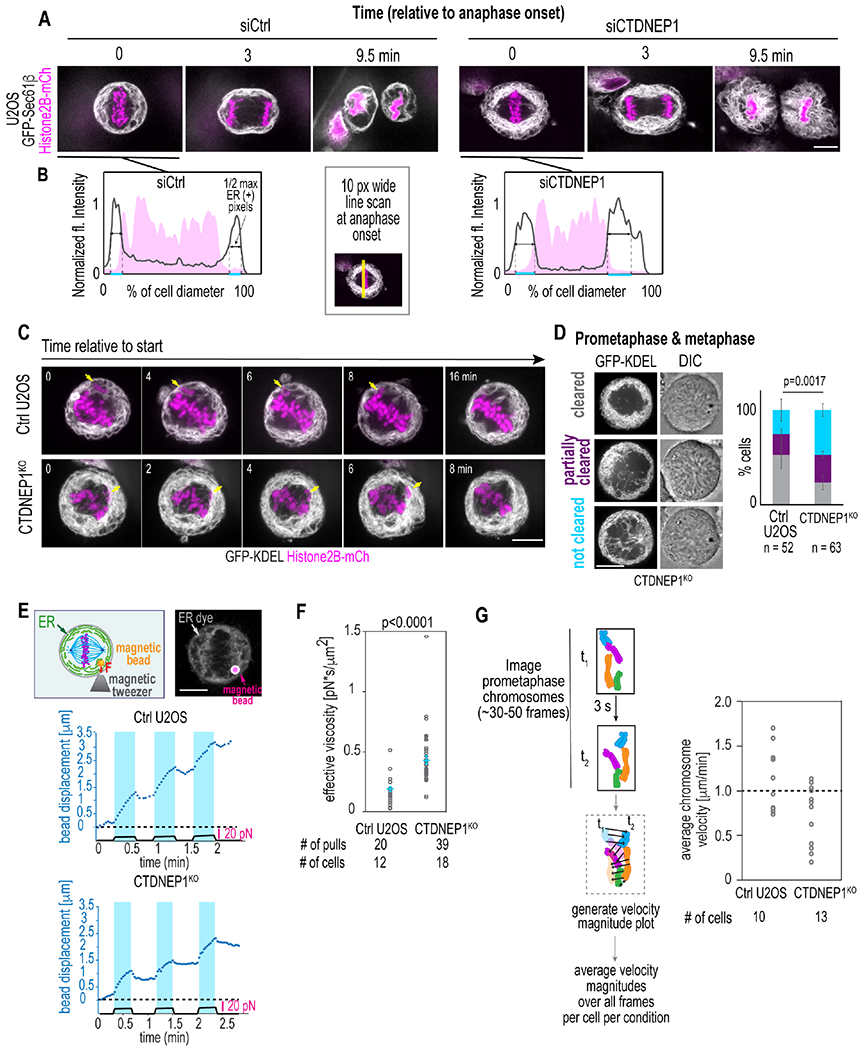
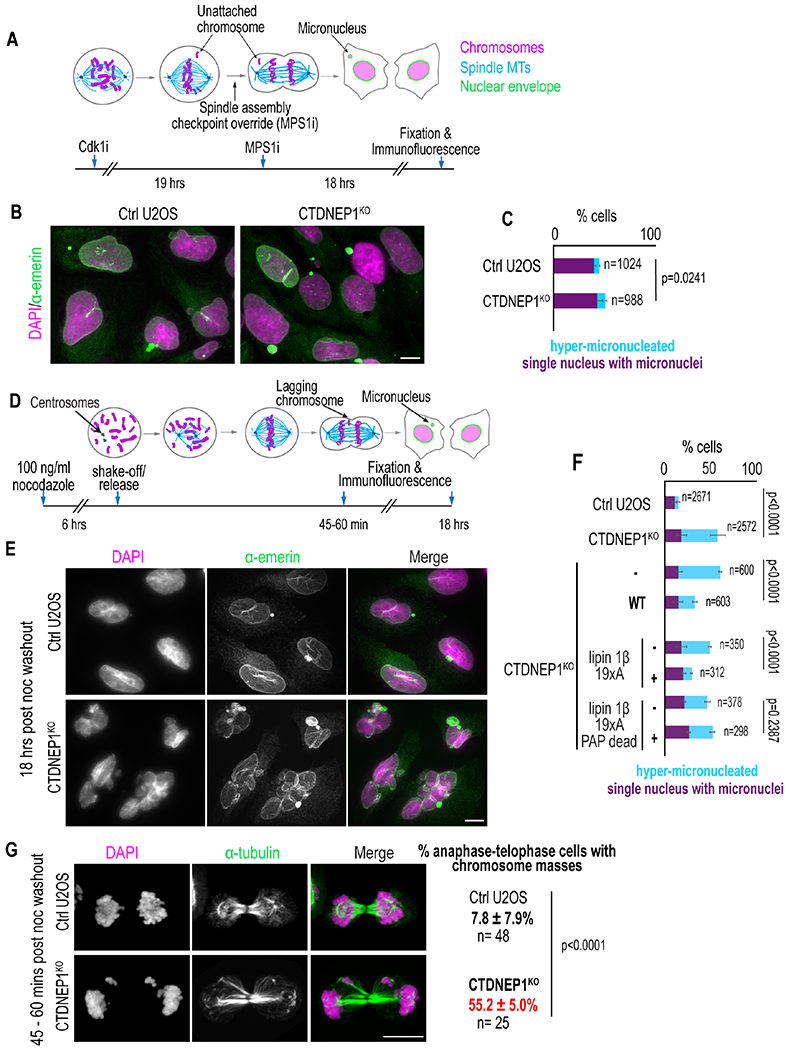
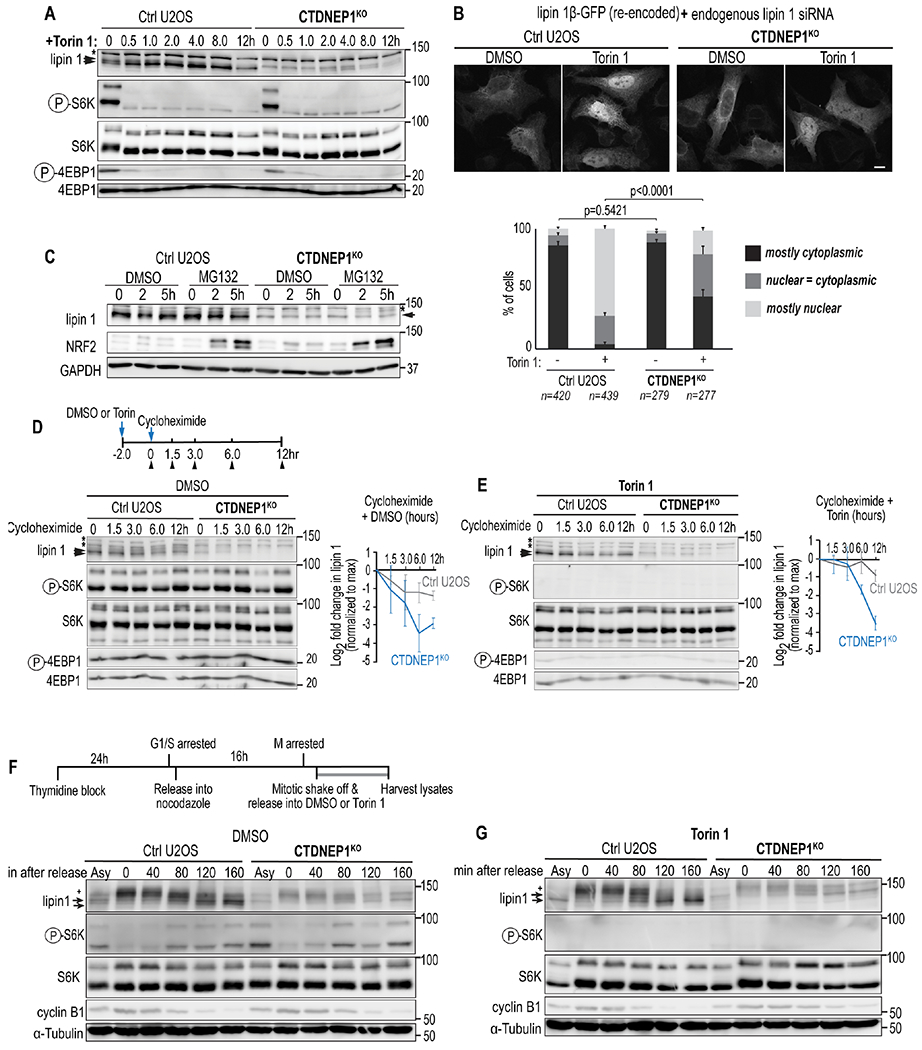
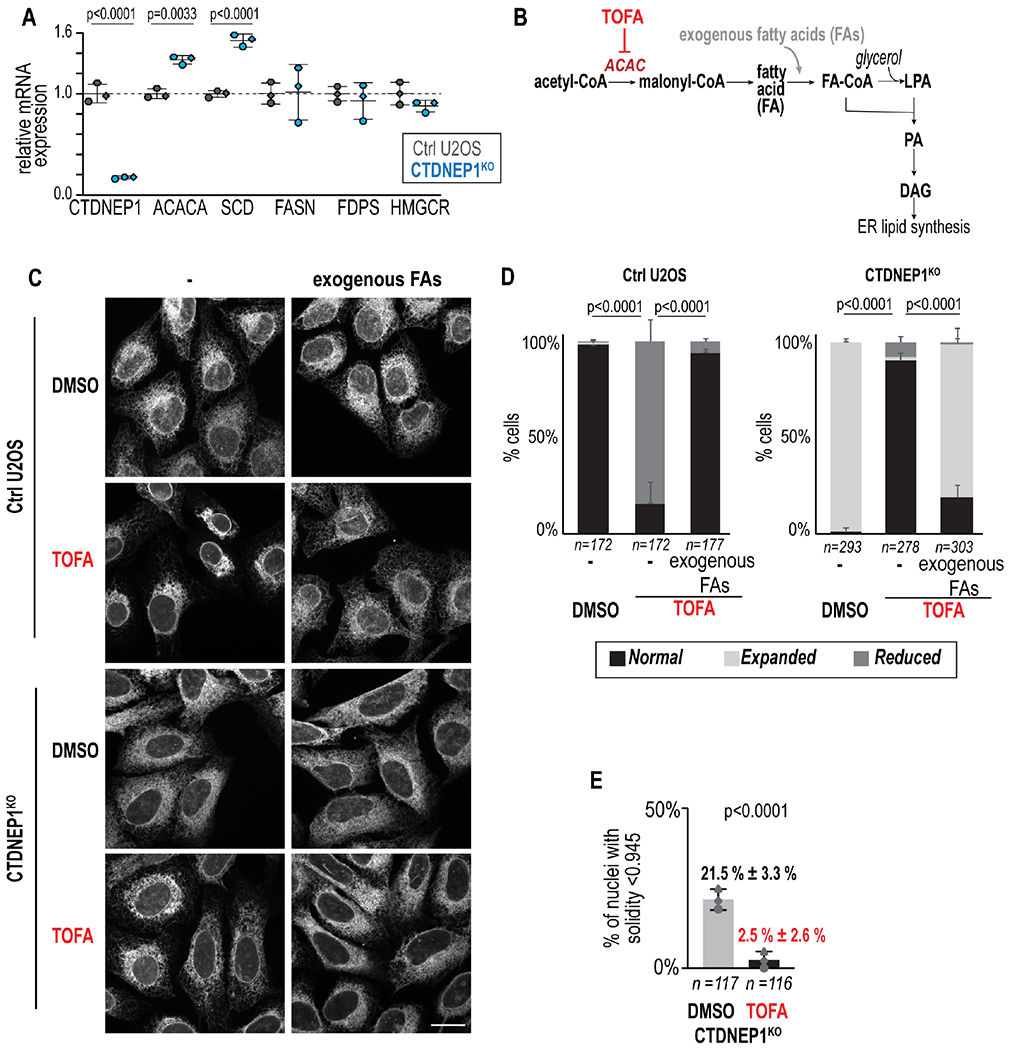
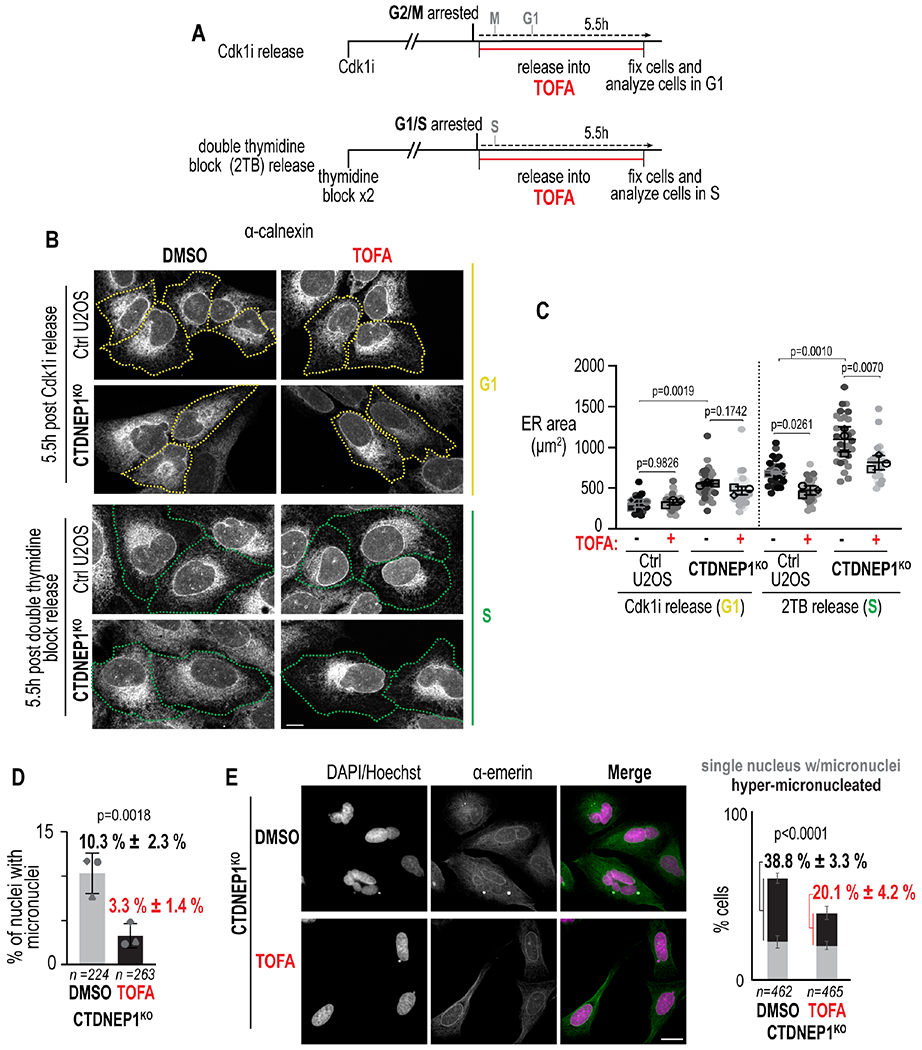
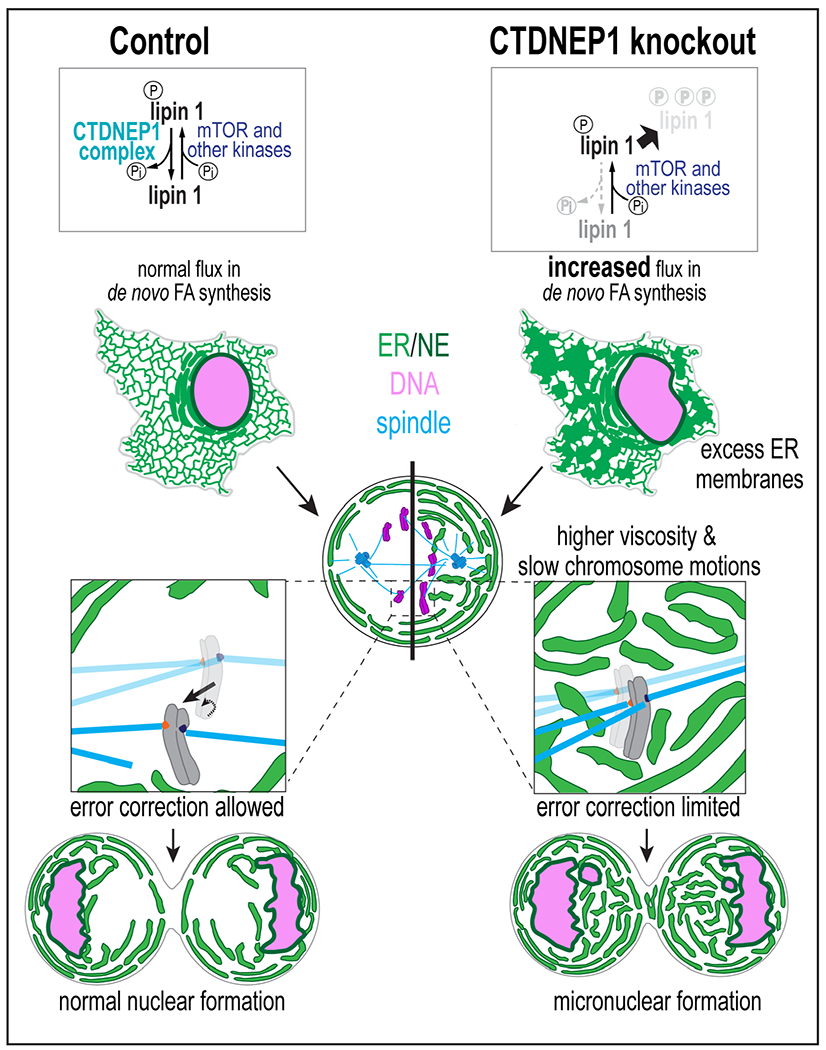
Failure to reorganize the endoplasmic reticulum (ER) in mitosis results in chromosome missegregation. Here, we show that accurate chromosome segregation in human cells requires cell cycle-regulated ER membrane production. Excess ER membranes increase the viscosity of the mitotic cytoplasm to physically restrict chromosome movements, which impedes the correction of mitotic errors leading to the formation of micronuclei. Mechanistically, we demonstrate that the protein phosphatase CTDNEP1 counteracts mTOR kinase to establish a dephosphorylated pool of the phosphatidic acid phosphatase lipin 1 in interphase. CTDNEP1 control of lipin 1 limits the synthesis of fatty acids for ER membrane biogenesis in interphase that then protects against chromosome missegregation in mitosis. Thus, regulation of ER size can dictate the biophysical properties of mitotic cells, providing an explanation for why ER reorganization is necessary for mitotic fidelity. Our data further suggest that dysregulated lipid metabolism is a potential source of aneuploidy in cancer cells.

Keywords: CTDNEP1; aneuploidy; lipid homeostasis; lipin; mTOR; medulloblastoma; micronuclei; mitosis; nuclear assembly.


Conflict of interest statement

Declaration of interests The authors declare no competing interests.

Figures

Figure 1.
Figure 1.. ER membrane expansion and formation of micronuclei in the absence of CTDNEP1.
(A) Schematic of CTDNEP1 regulation of lipin 1. (B) Immunoblot of whole cell lysate of indicated conditions. Arrows, lipin 1 phospho-species. Right: schematic of wild type (WT) and phosphatase dead (PD) human CTDNEP1. (C) Spinning disk confocal images in indicated cells. (D) Plot, % of cells with indicated phenotypes analyzed live with GFP-KDEL (left two) or in fixed cells with calnexin staining (right three). (E) Spinning disk confocal images in indicated metaphase cells. (F) Epifluorescence images of nuclei in indicated cells. Inset: micronucleus (arrow). (G) Plot, incidence of nuclei with solidity value < 1 SD from control mean solidity. Data in right two and left two bars are from separate experiments. (H) Incidence of micronuclei in indicated cells. For all: scale bars, 10 μm. Mean ± SDs shown (N = 3 experimental repeats). p values, Fisher’s exact tests. See also Figures S1–S2.
Figure 2.
Figure 2.. Expanded ER membranes, increased effective viscosity, and diminished chromosome dynamics of CTDNEP1 deleted mitotic cells.
(A) Selected spinning disk confocal time lapse images in cells treated as indicated. (B) Plots, line profiles of fluorescent intensities along region shown. (C) Selected spinning disk confocal time lapse images in indicated cells after recovery from Cdk1i. Arrows, unaligned chromosomes. (D) Center plane spinning disk confocal images of mitotic cells. Plot, incidence of phenotypes. Means ± SDs shown. N = 3 experimental repeats. p value, χ2test. (E) Top: Schematic of experiment setup and confocal image of ER (gray) and magnetic bead (magenta) in a mitotic U2OS cell. Plots, applied force (black solid line) and bead displacement (blue dotted line). (F) Plot of effective cytoplasmic viscosity in indicated cells. Means ± SEM shown. p value, unpaired t test with Welch’s correction. (G) Schematic (left) for quantifying average velocity magnitudes for chromosomes for indicated cells in plot (right). Scale bars, 10 μm. See also Figure S3.
Figure 3.
Figure 3.. Loss of CTDNEP1 exacerbates the frequency of micronucleation upon transient spindle disassembly.
(A) Experimental setup for SAC inhibition. (B) Max projection of confocal images in cells treated as in (A). (C) Incidence of indicated phenotypes in indicated cells. (D) Experimental setup for transient spindle disassembly. (E) Max projection of confocal images in indicated cells after treatment as in (D). (F) Plot of phenotypic incidences in cells treated as indicated. (G) Max projection of confocal images of cells treated as indicated and incidences of indicated phenotypes. For all: Scale bars, 10 μm. Means ± SDs shown and N = 3 experimental repeats; p values, χ2 (C, F) or Fisher’s exact (G) test. See also Figure S4.
Figure 4.
Figure 4.. CTDNEP1 counteracts mTOR phosphorylation of lipin 1 in interphase.
(A) Immunoblot of lipin 1 from whole cell lysates treated as indicated. (B) Top: Confocal images of fixed cells per indicated conditions. Scale bar, 10μm. Bottom: Plot of nuclear versus cytoplasmic localization of lipin 1 per indicated conditions. p values, χ2 test. (C-E) Immunoblot of whole cell lysates from cells treated as indicated. Plots: Normalized lipin 1 band intensities in indicated conditions. (F, G) Above: Schematic of mitotic synchronization protocol. Below: Immunoblots of whole cell lysates from synchronized cells treated as indicated. Plus signs, lipin 1 mitotic species. Arrowheads, lipin 1 interphase phospho-species; asterisks, non-specific bands. N = 3 experimental repeats. Means ± SDs shown.
Figure 5.
Figure 5.. CTDNEP1 controls de novo FA synthesis to limit ER membrane biogenesis.
(A) qRT-PCR of indicated cells for genes indicated, shown as fold change in expression relative to mean control values. (B) Schematic representing target for inhibition by TOFA bypassed by addition of exogenous FAs. (C) Max projections of confocal images in indicated cell lines under indicated conditions. Scale bar, 20 μm. (D) Plot of incidences of indicated phenotypes. (E) Incidence of nuclei with solidity < 1 SD from mean solidity of control U2OS cells per indicated condition. For all: p value, unpaired t (A), χ2 (D), or Fisher’s exact (E) tests. N = 3 experimental repeats and means ± SDs shown. See also Figures S5 and S6.
Figure 6:
Figure 6:. Inhibition of FA synthesis in interphase suppresses the expanded ER phenotype of CTDNEP1 knockout cells and the increased incidence of micronuclei.
(A) Schematic of experimental setup. (B) Max projections of confocal images of cells treated as indicated. Borders: cells in distinct cell cycle stages as determined by markers (see Figure S7A). Scale bar, 10 μm. (C) Plots of ER area in cells in specified stages treated as indicated. p values, one-way repeated measures ANOVA with Šidák’s test. (D) Plot of incidence of micronuclei in cells treated as indicated. p values, Fisher’s exact test. (E) Confocal images of indicated cell lines per condition following nocodazole washout. Scale bar, 20 μm. Plot: Incidence of specified phenotypes. p value, χ2 test. For all: N = 3 experimental repeats; means ± SDs shown. See also Figure S7.
Figure 7:
Figure 7:. Cell cycle-regulated ER membrane biogenesis by CTDNEP1 dephosphorylation of lipin 1 allows chromosome movements necessary for biorientation.
When CTDNEP1 is absent, phosphorylation of lipin 1 by mTOR and other kinases prevails and leads to decreased lipin 1 stability and an increased flux in de novo FA synthesis towards ER membrane biogenesis in interphase. Excess ER membranes inherited by mitotic cells contribute to higher cytoplasmic viscosity and dampened chromosome motions. The lack of chromosome motions limits mitotic error correction, leading to micronuclei formation.

Similar articles

Cited by

References

    1. Bahmanyar S, Biggs R, Schuh AL, Desai A, Muller-Reichert T, Audhya A, Dixon JE, and Oegema K (2014). Spatial control of phospholipid flux restricts endoplasmic reticulum sheet formation to allow nuclear envelope breakdown. Genes Dev 28, 121–126. - PMC - PubMed
    1. Bahmanyar S, and Schlieker C (2020). Lipid and protein dynamics that shape nuclear envelope identity. Mol Biol Cell 31, 1315–1323. - PMC - PubMed
    1. Barger SR, Penfield L, and Bahmanyar S (2021). Coupling lipid synthesis with nuclear envelope remodeling. Trends Biochem Sci. - PMC - PubMed
    1. Baumann O, and Walz B (2001). Endoplasmic reticulum of animal cells and its organization into structural and functional domains. Int Rev Cytol 205, 149–214. - PubMed
    1. Bertolio R, Napoletano F, Mano M, Maurer-Stroh S, Fantuz M, Zannini A, Bicciato S, Sorrentino G, and Del Sal G (2019). Sterol regulatory element binding protein 1 couples mechanical cues and lipid metabolism. Nat Commun 10, 1326. - PMC - PubMed

Publication types

LinkOut - more resources