. 2021 Nov 30;37(9):110060.
doi: 10.1016/j.celrep.2021.110060.

CHK1 protects oncogenic KRAS-expressing cells from DNA damage and is a target for pancreatic cancer treatment

Affiliations

CHK1 protects oncogenic KRAS-expressing cells from DNA damage and is a target for pancreatic cancer treatment

Jennifer E Klomp et al. Cell Rep. .

Abstract

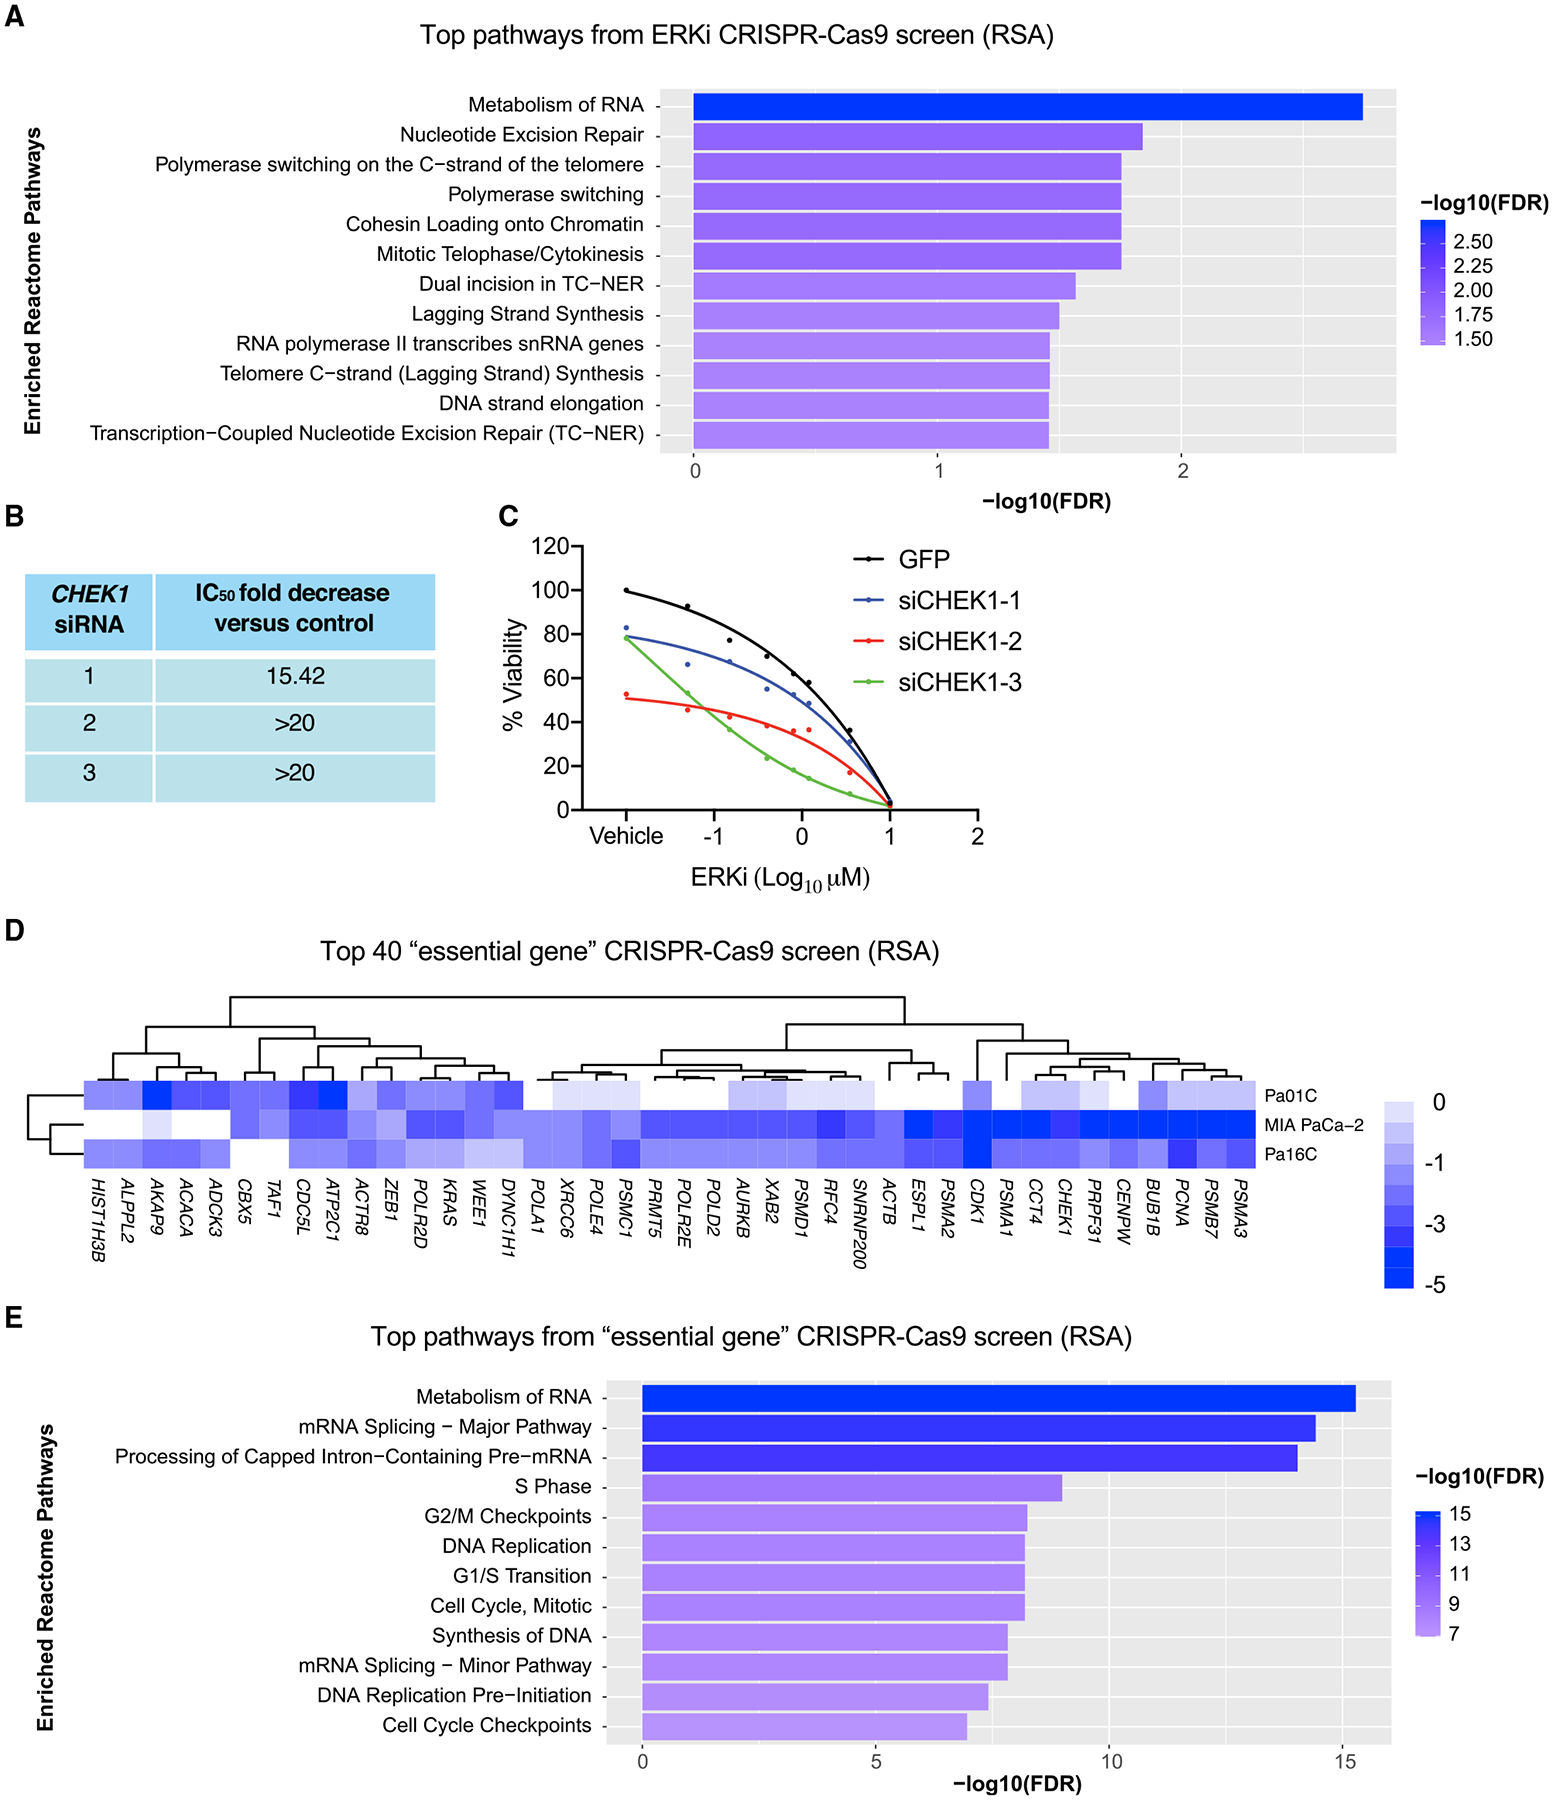
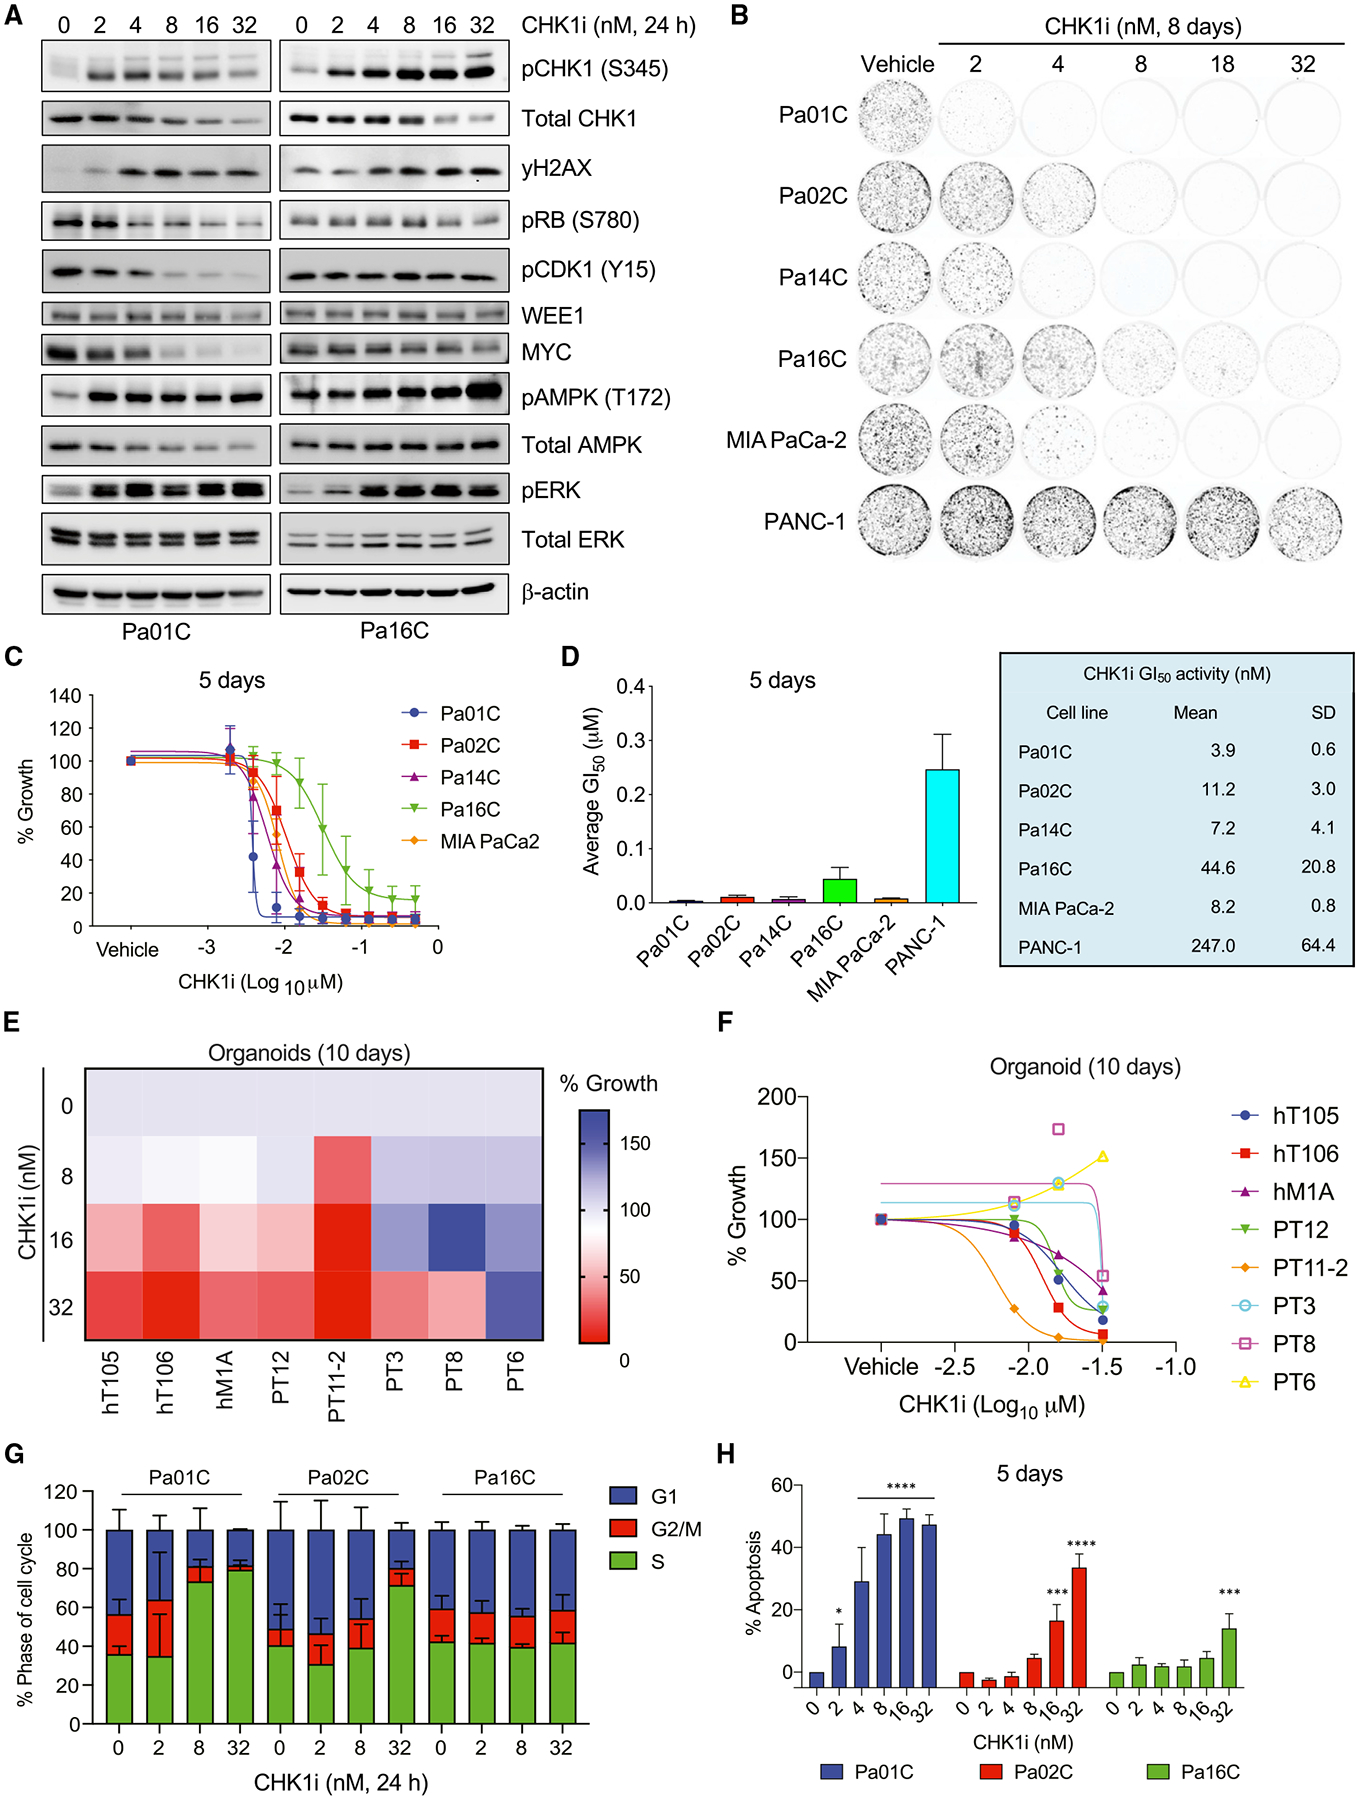
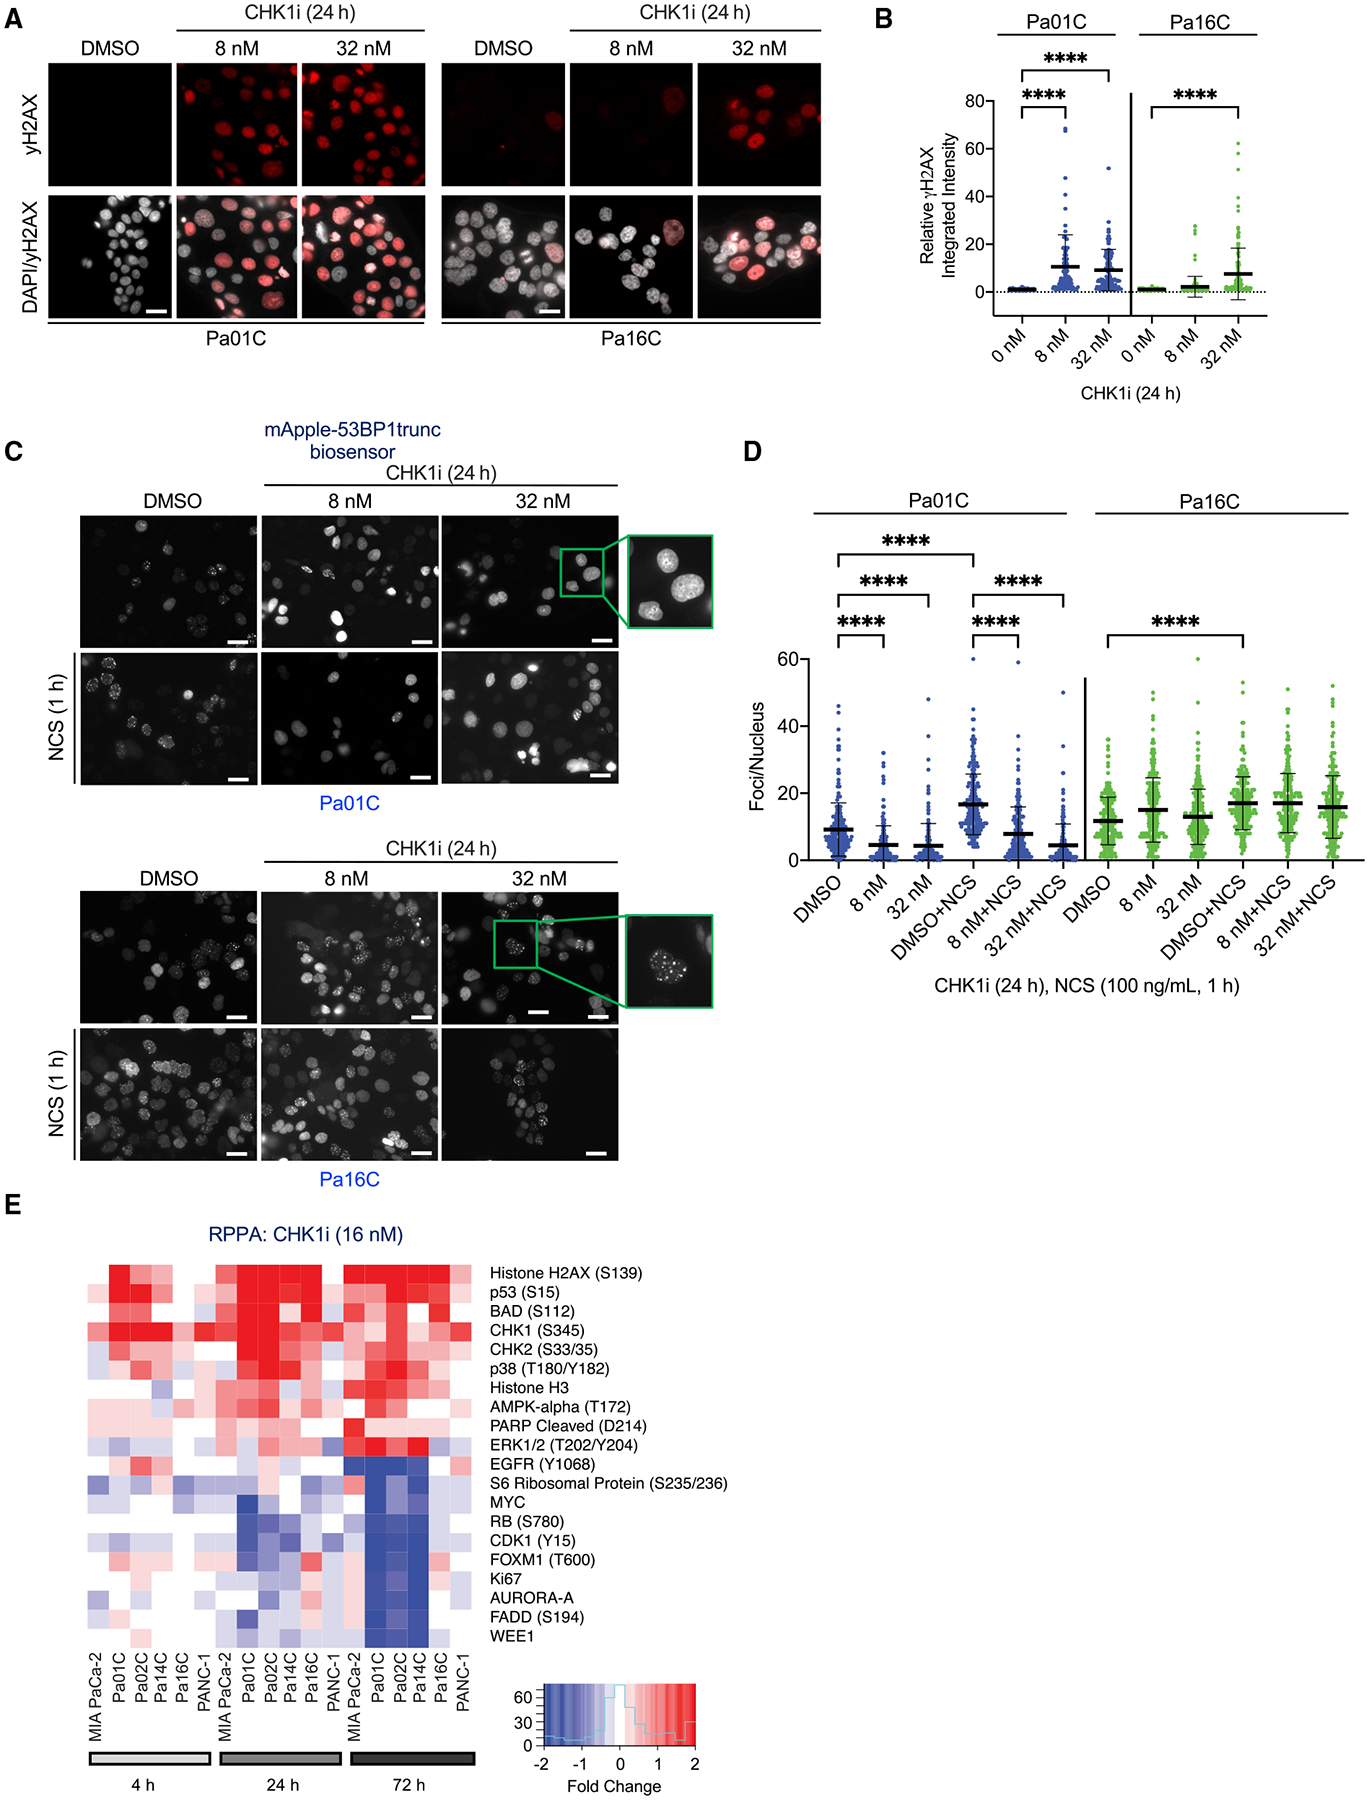
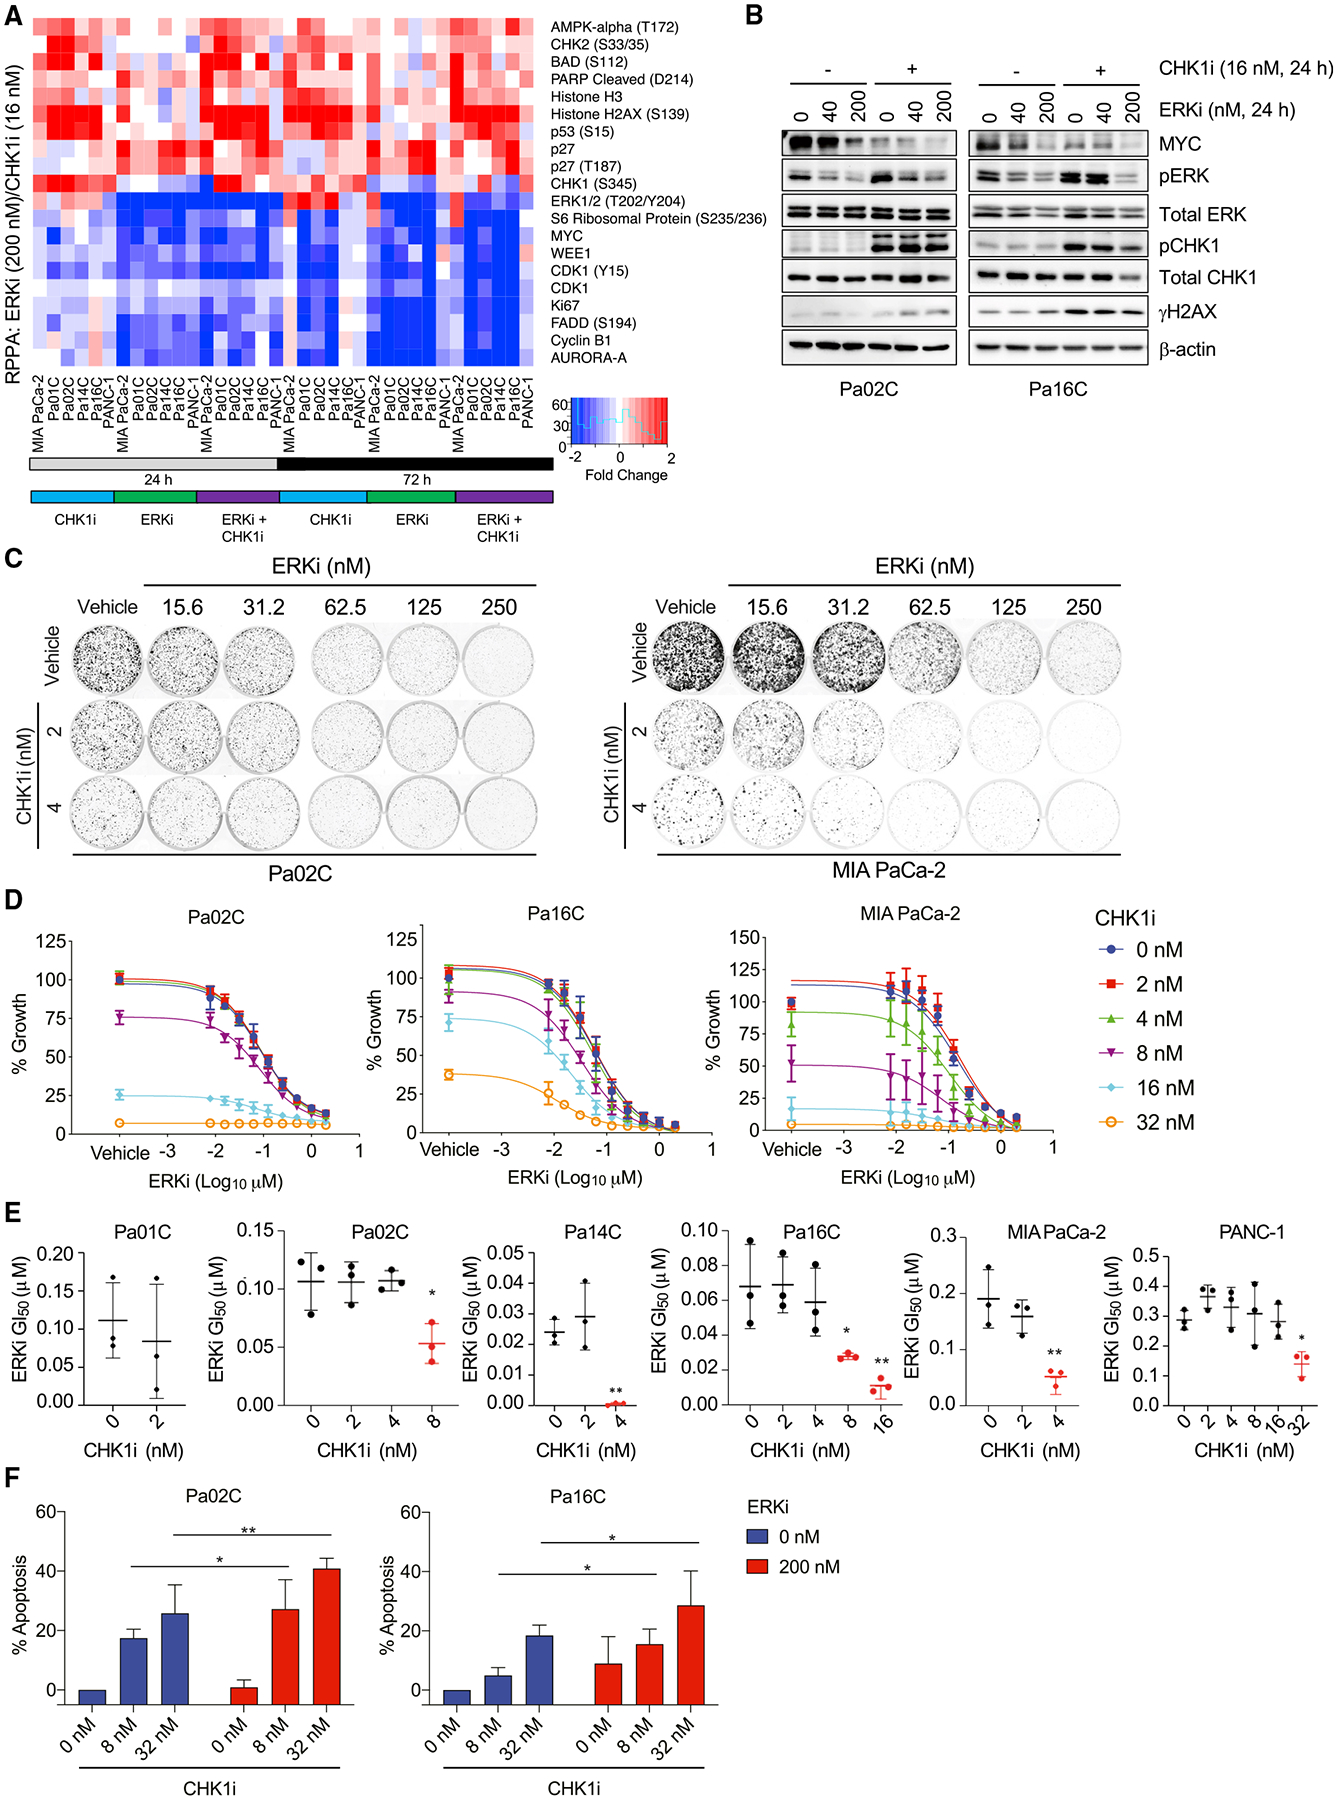
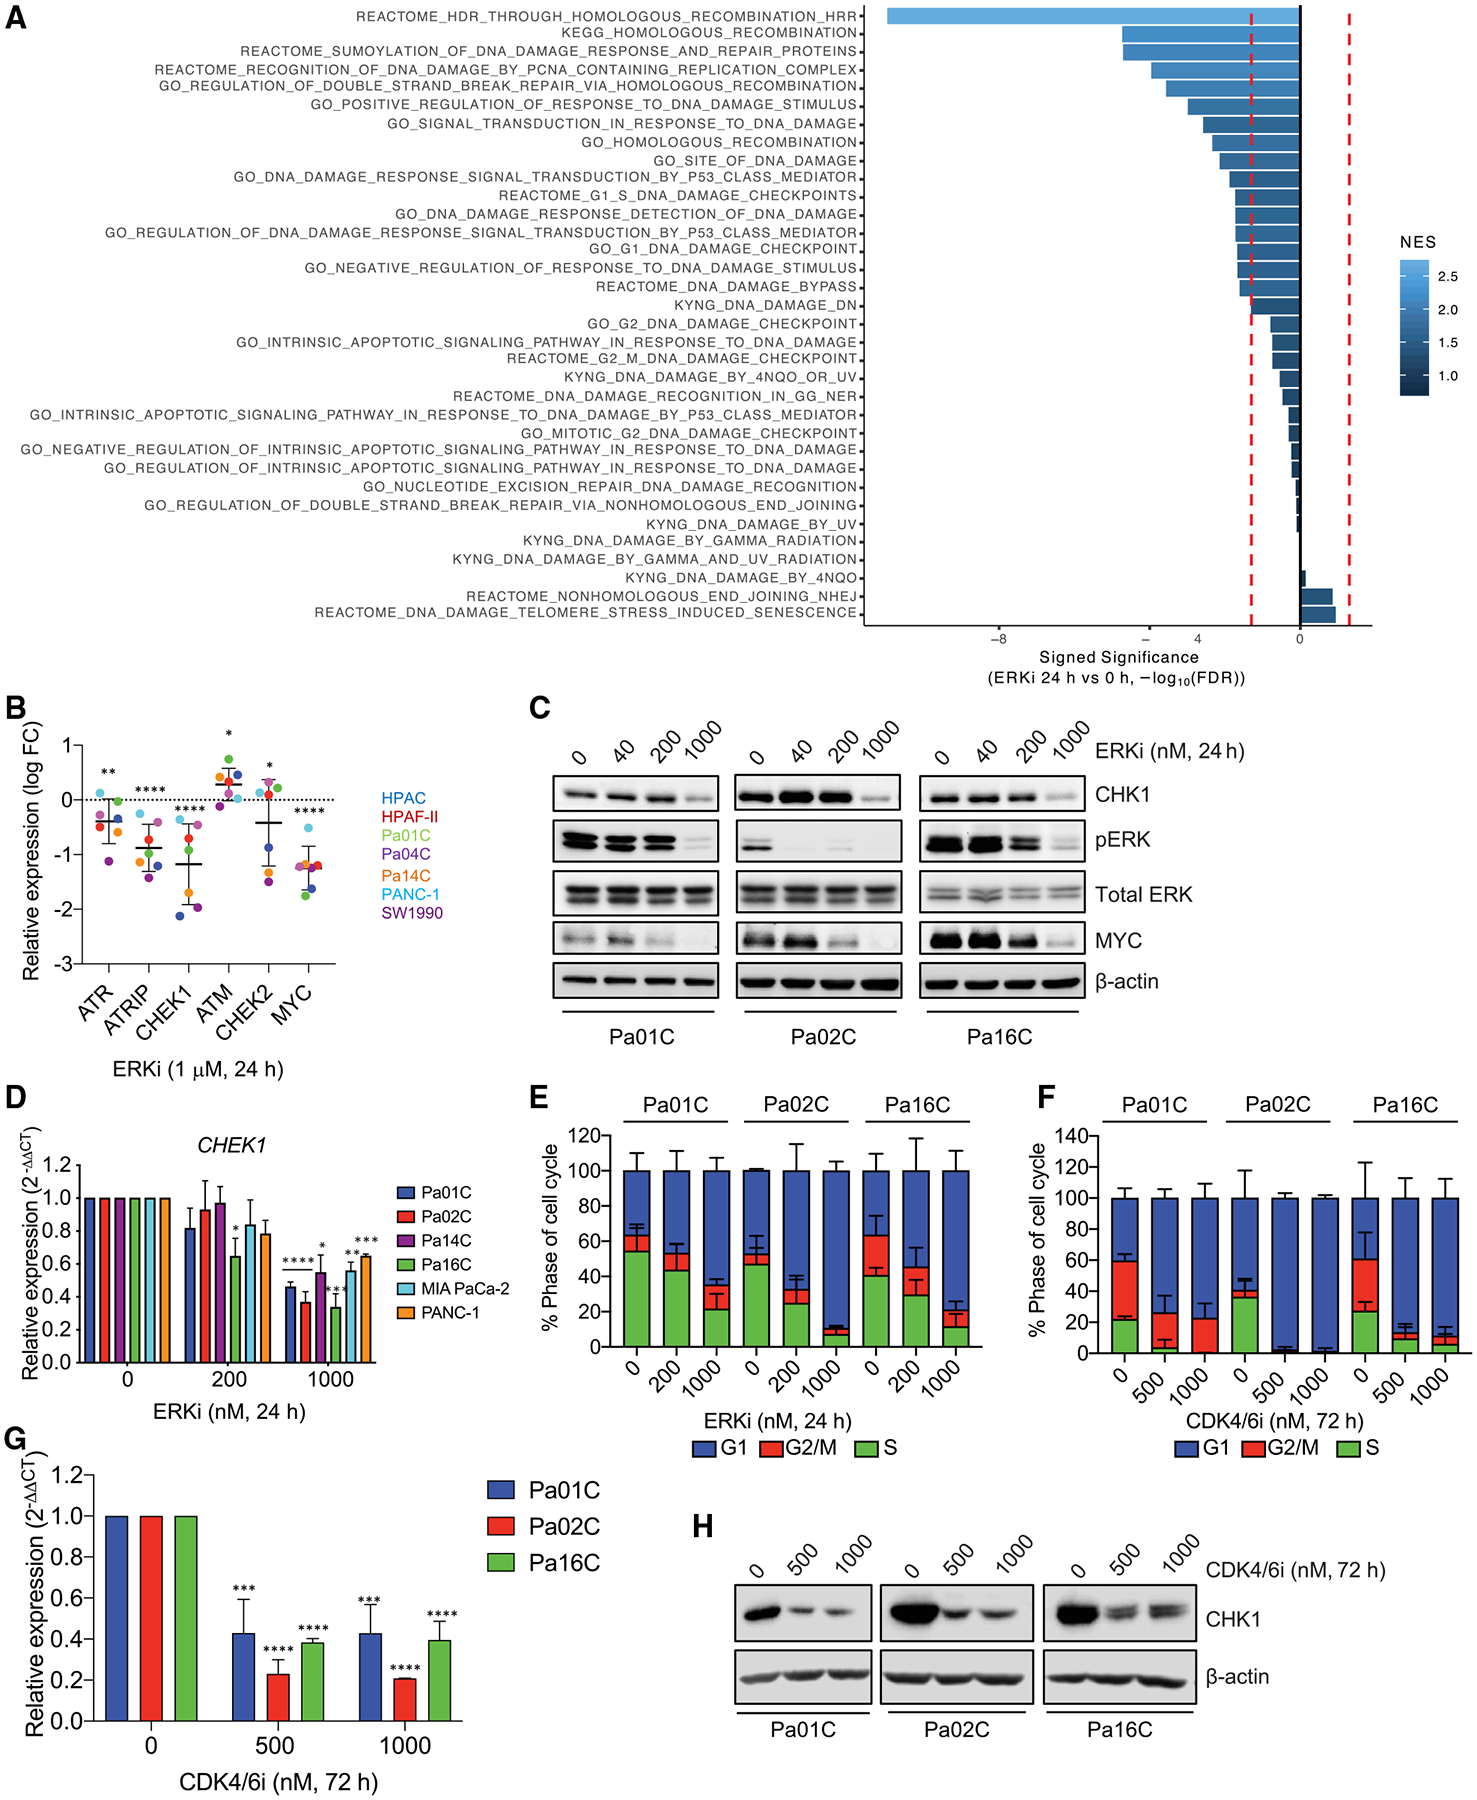
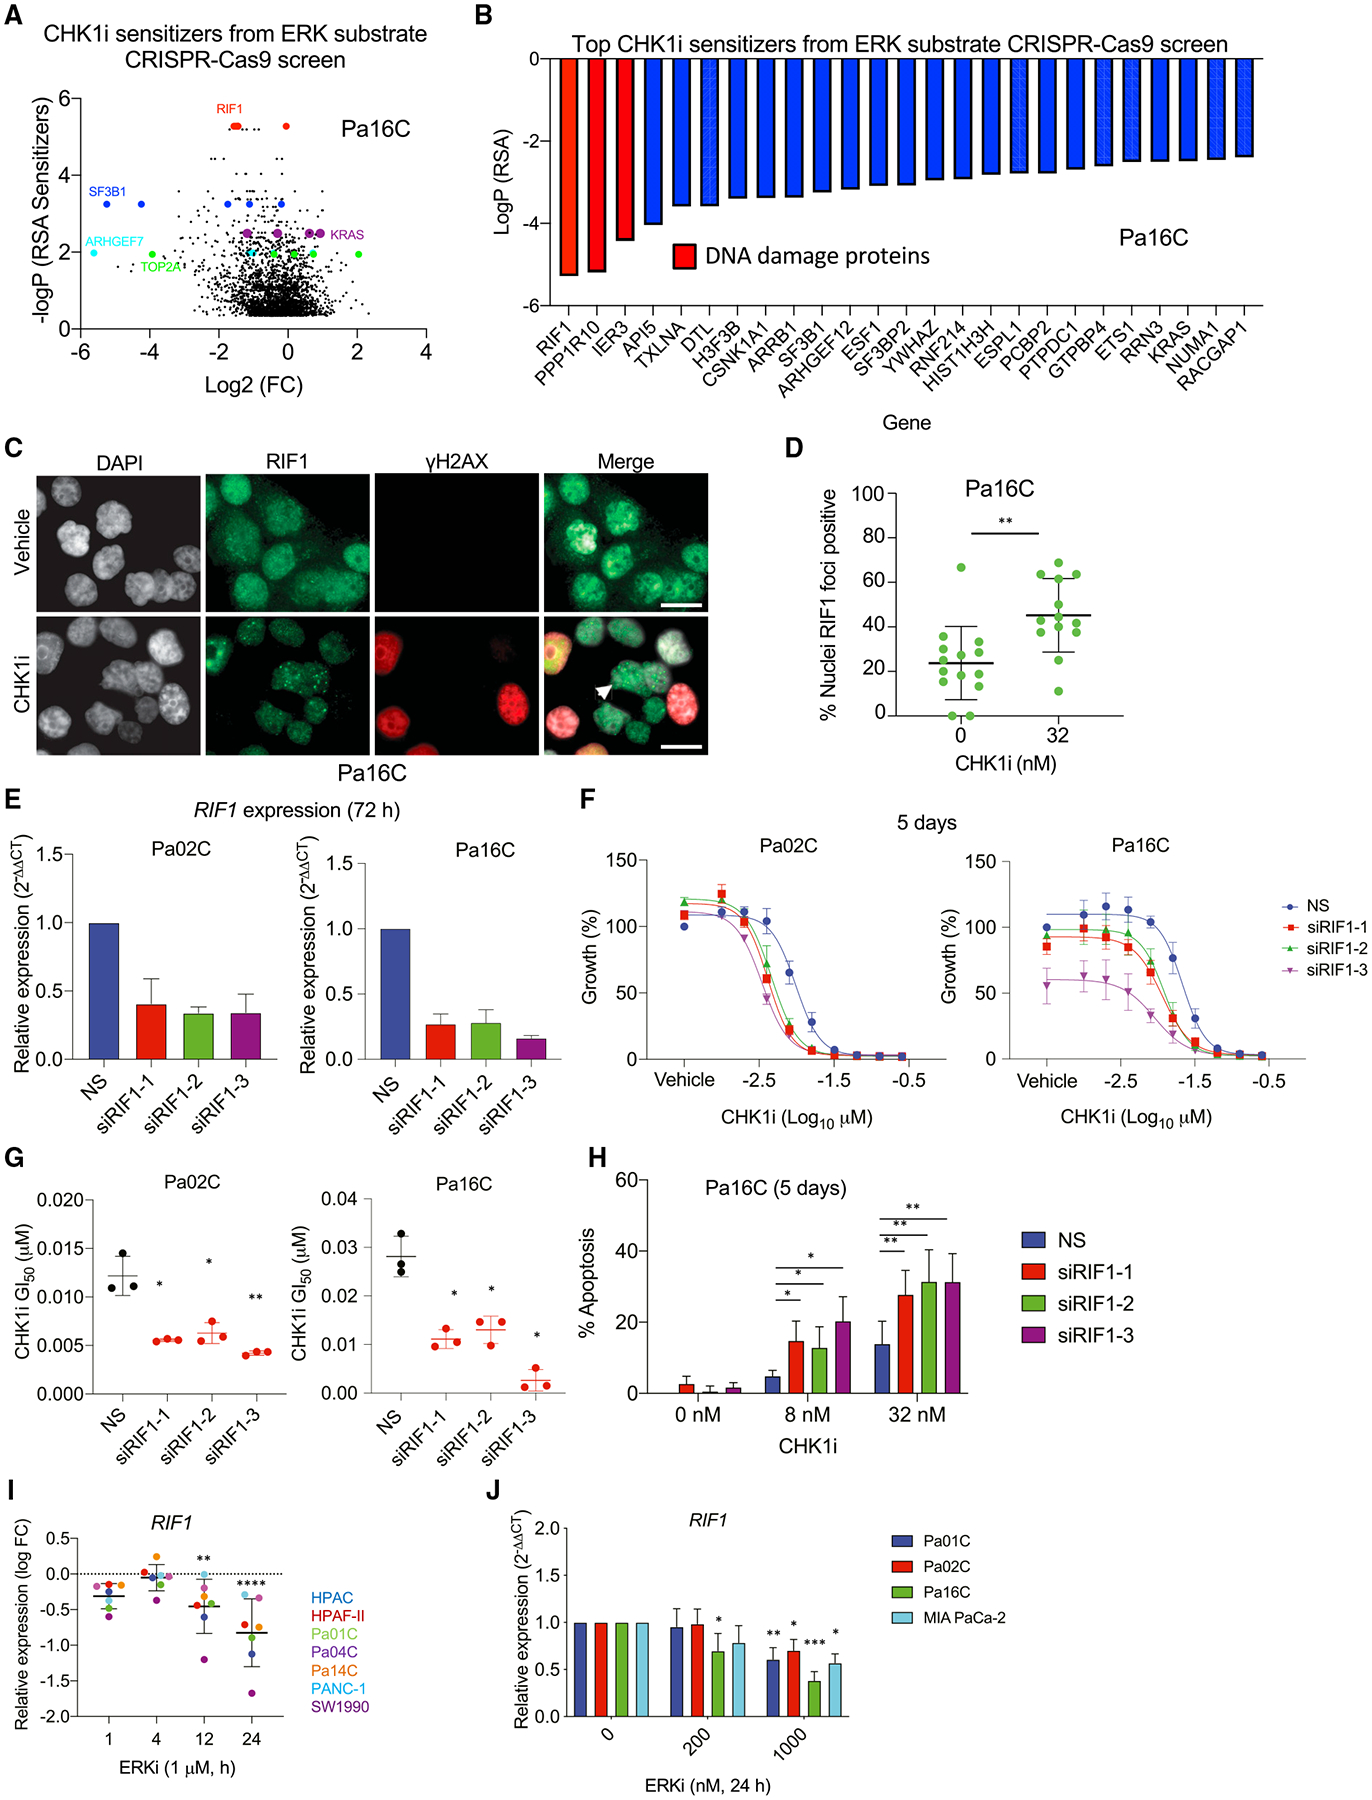
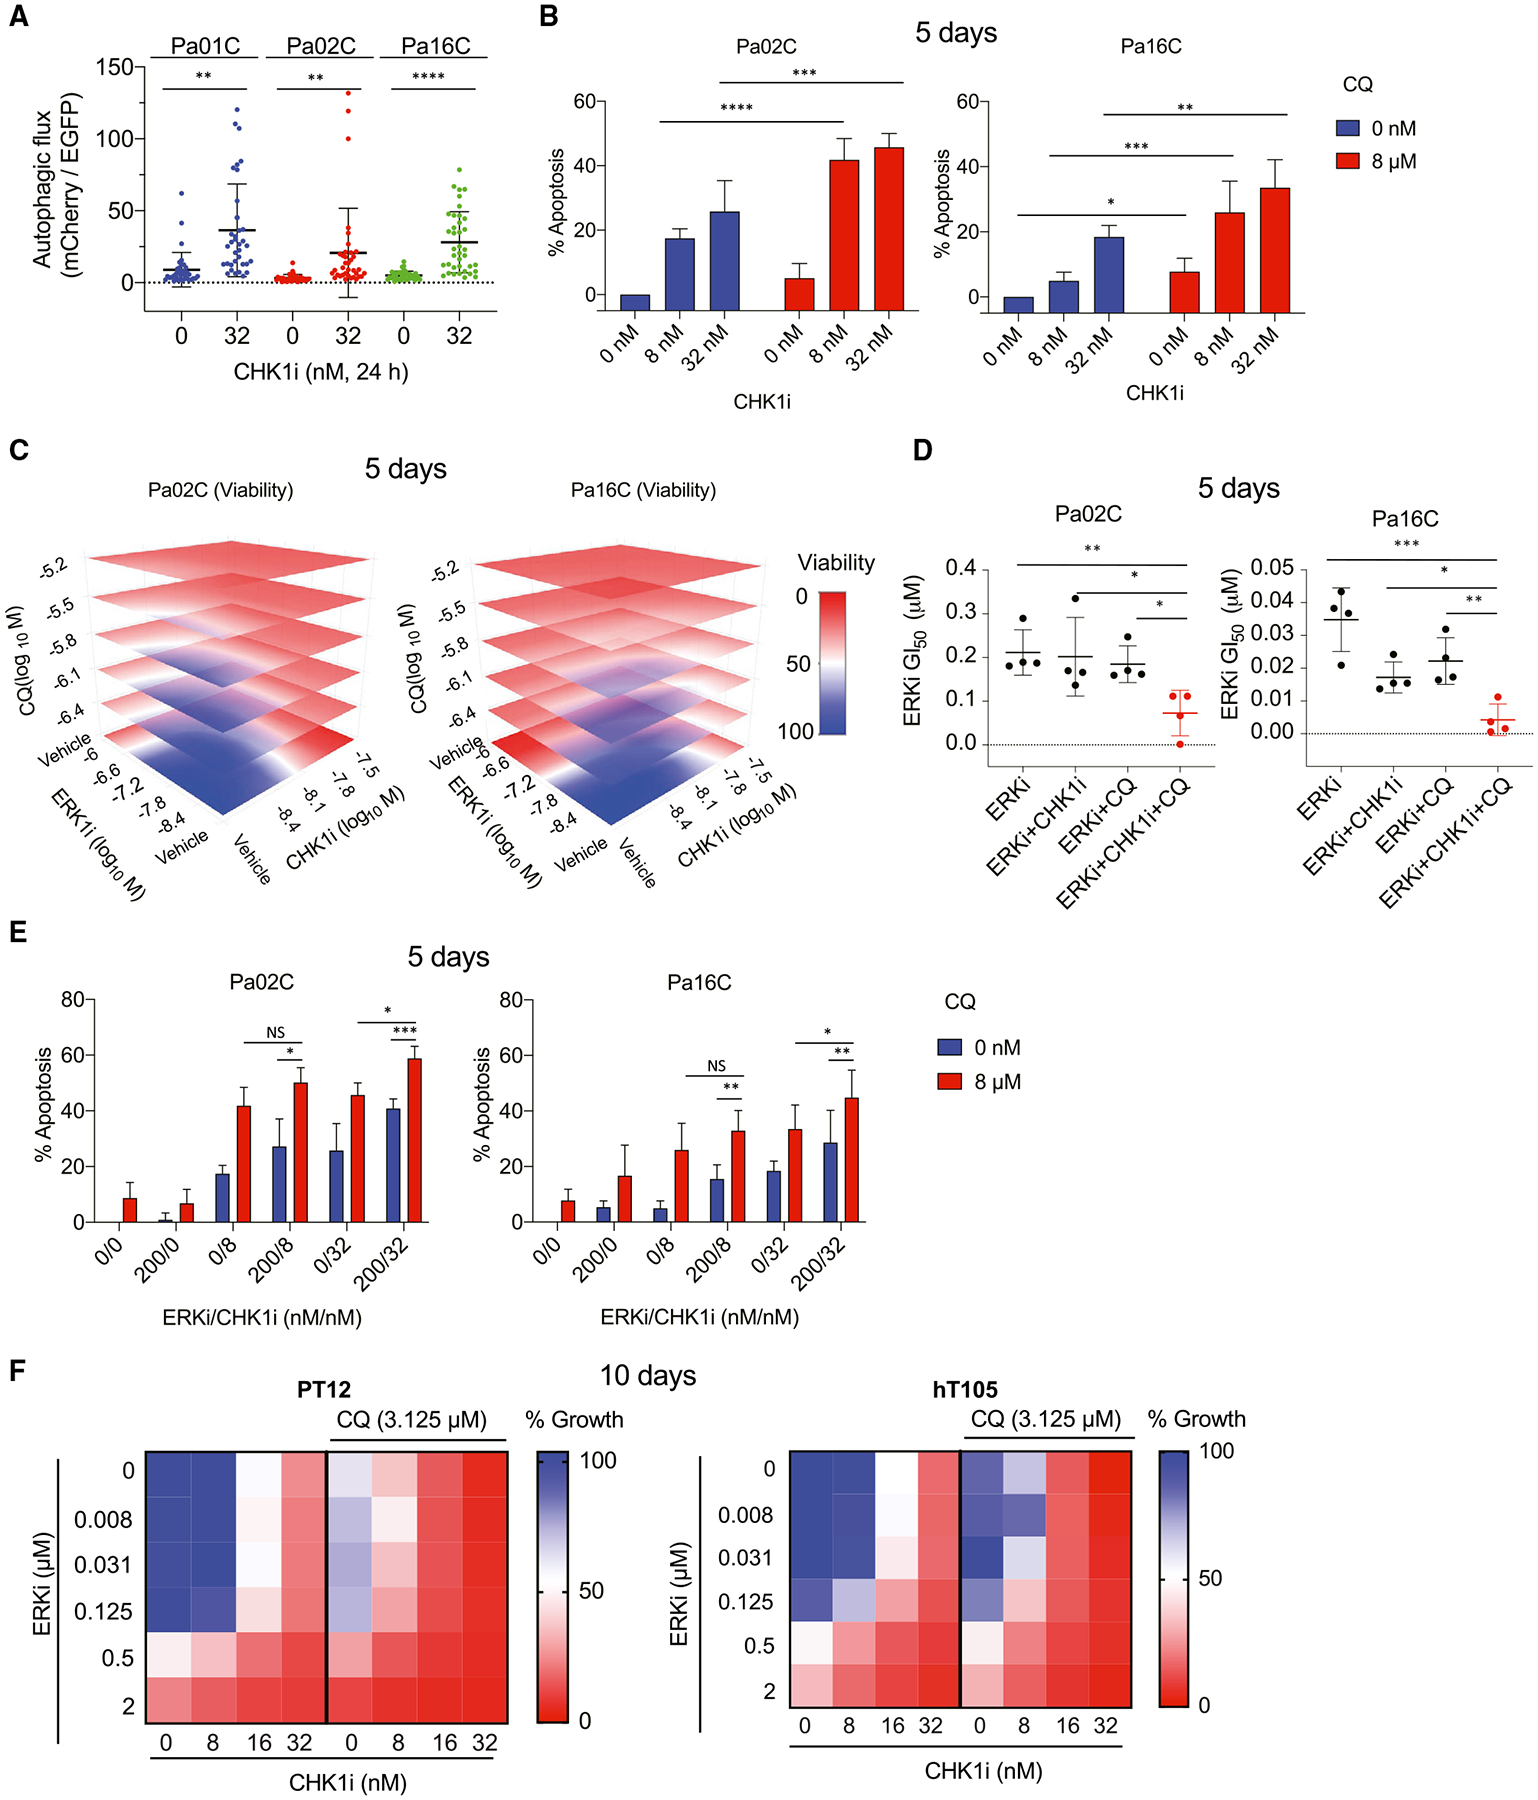
We apply genetic screens to delineate modulators of KRAS mutant pancreatic ductal adenocarcinoma (PDAC) sensitivity to ERK inhibitor treatment, and we identify components of the ATR-CHK1 DNA damage repair (DDR) pathway. Pharmacologic inhibition of CHK1 alone causes apoptotic growth suppression of both PDAC cell lines and organoids, which correlates with loss of MYC expression. CHK1 inhibition also activates ERK and AMPK and increases autophagy, providing a mechanistic basis for increased efficacy of concurrent CHK1 and ERK inhibition and/or autophagy inhibition with chloroquine. To assess how CHK1 inhibition-induced ERK activation promotes PDAC survival, we perform a CRISPR-Cas9 loss-of-function screen targeting direct/indirect ERK substrates and identify RIF1. A key component of non-homologous end joining repair, RIF1 suppression sensitizes PDAC cells to CHK1 inhibition-mediated apoptotic growth suppression. Furthermore, ERK inhibition alone decreases RIF1 expression and phenocopies RIF1 depletion. We conclude that concurrent DDR suppression enhances the efficacy of ERK and/or autophagy inhibitors in KRAS mutant PDAC.

Keywords: CHK1; DNA damage; ERK; KRAS; MYC; RIF1; pancreatic cancer.


Conflict of interest statement

Declaration of interests C.J.D. is a consultant/advisory board member for Anchiano Therapeutics, Deciphera Pharmaceuticals, Mirati Therapeutics, and Revolution Medicines. C.J.D. has received research funding support from SpringWorks Therapeutics, Mirati Therapeutics, and Deciphera Pharmaceuticals and has consulted for Ribometrix, Sanofi, Jazz Therapeutics, Turning Point Therapeutics, and Eli Lilly. A.D.C. has consulted for Eli Lilly and Mirati Therapeutics. E.F.P. and M.P. receive royalties from Avant Diagnostics. E.F.P. is a consultant to and shareholder in Avant Diagnostics, Inc., and Perthera, Inc., and received funding support from Mirati Therapeutics, Genentech, Inc., and Abbvie, Inc.

Figures

Figure 1.
Figure 1.. CHEK1 is identified as an ERKi sensitizer and essential for PDAC growth
(A) Pathway analysis of the top 50 genes identified in a loss-of-function CRISPR-Cas9 screen (Pa01C, Pa14C, and PANC-1) targeting the druggable genome. Enriched ERKi sensitizer reactomes were determined using a STRING false discovery rate set at 5% and comparing the mean logP of all cell types and time points of the entire library. (B) The shifts in ERKi GI50 with the top three CHEK1 siRNAs from the initial siRNA druggable genome screen. (C) Viability curves (Pa16C) following 4 day treatment with ERKi and 5 day treatment with CHEK1 siRNA, with GFP siRNA as a control. (D) The top 40 genes from the CRISPR-Cas9 “druggable genome” viability screen for identification of genes essential to PDAC cell growth; scale references the logP (RSA) value. (E) Reactomes enriched with “essential” genes were identified using a STRING false discovery rate of 5% as described in (A).
Figure 2.
Figure 2.. CHK1i blocks PDAC growth and induces S-phase arrest and apoptosis
(A) Immunoblot analyses of PDAC cell lines treated with increasing concentrations of CHK1i for 24 h. (B) Clonogenic proliferation assay to monitor growth suppression of PDAC cell lines treated (8 days) with the indicated concentrations (nM) of CHK1i. (C) Anchorage-dependent growth of PDAC cell lines was evaluated by live cell counting following CHK1i treatment for 5 days. (D) The mean GI50 with SD of data shown in (C). (E and F) PDAC organoid growth was monitored by the CellTiter-Glo viability assay after treatment (10 days) with the indicated concentrations of CHK1i. (E) The median of three biological replicates for each treatment is shown, and a shift from blue to red indicates a reduction in growth. (F) Individual growth values are shown for each organoid line at each concentration of CHK1i. (G) The percentages of cells in the indicated phases of the cell cycle were determined using propidium iodide staining and flow cytometry following 24 h of treatment with the indicated CHK1i concentration (nM). (H) The percentage of cells undergoing apoptosis was evaluated in three PDAC lines with varying degrees of growth sensitivity to CHK1i (5 days). Apoptosis was monitored using fluorescence-activated cell sorting (FACS) analysis of Annexin V- and propidium iodide-labeled cells. Statistical significance was evaluated using one-way ANOVA and Dunnett’s multiple-comparisons test; **p < 0.01, ***p < 0.001, ****p < 0.0001. In (A)–(D), (G), and (H), all experiments were performed in biological triplicate, immunoblots are representative images, and graphs show mean and SD.
Figure 3.
Figure 3.. CHK1i promotes DNA damage and loss of 53BP1-mediated repair
(A) Representative images of immunofluorescence to monitor γH2AX expression (red) and nuclei (white) in PDAC cells following CHK1i treatment (24 h) at the indicated concentrations (nM). Scale bar, 25 μm. (B) The relative integrated intensity of γH2AX per nucleus of the indicated cell lines treated with different doses of CHK1i. Each dot represents a nucleus, error bars represent the SD. Statistical significance was evaluated using one-way ANOVA with Dunnett’s multiple-comparisons test; ****p < 0.0001. (C) Representative images of Apple-tagged trunc53BP1 in PDAC cells following DMSO or CHK1i treatment for 24 h and/or the irradiation mimic neocarzinostatin (NCS) for 1 h at 100 ng/mL. Boxes show zoomed-in views with (Pa16C) or without (Pa01C) foci following CHK1i treatment. Scale bar, 25 μm. (D) The number of mApple-tagged trunc53BP1 foci per nucleus was evaluated. Statistical significance was evaluated using one-way ANOVA with Dunnett’s multiple-comparisons test; ****p < 0.0001. Each dot represents a nucleus and error bars the SD. (E) Heatmap of RPPA analyses to evaluate changes in the levels of phosphorylated (site[s] in parentheses) or total expression of the indicated proteins following CHK1i (15 nM) treatment for the indicated times in six PDAC cell lines. Shown are the median values from four biological replicates and highlights of the ten most up- and downregulated proteins.
Figure 4.
Figure 4.. Concurrent CHK1i treatment enhances ERKi-mediated growth suppression and apoptosis
(A) RPPA analyses of PDAC cell lines following 24 or 72 h treatment with CHK1i (15 nM) and/or ERKi (200 nM). The heatmap depicts the median values from four biological replicates and the ten most up- and downregulated protein changes on the basis of mean values of all cell lines evaluated. (B) Immunoblot analyses to monitor the indicated phosphorylated/total protein levels in cells treated (24 h) with the indicated concentrations of CHK1 and/or ERKi. (C) Clonogenic growth assay of PDAC cell lines treated for 8 days with the indicated inhibitor concentrations. Cells were visualized using staining with crystal violet. (D) Growth of PDAC cell lines was evaluated using live cell counting following CHK1i and/or ERKi treatment for 5 days. (E) The mean ERKi GI50 was determined following treatment with different concentrations of CHK1i. One-way ANOVA with Dunnett’s multiple-comparisons test was used to determine significance; *p < 0.05, **p < 0.01. (F) Percentage of cells undergoing apoptosis induced by treatment with CHK1i and/or ERKi was determined using FACS analysis of Annexin V- and propidium iodide-labeled cells. Significance was determined using two-way ANOVA and Tukey’s multiple-comparisons test; *p < 0.05, **p < 0.01. In (B)–(F), all experiments were performed in biological triplicate, for immunoblots a representative image is shown, and graphs depict mean and SD.
Figure 5.
Figure 5.. ERK inhibition decreases CHEK1 gene and CHK1 protein expression by causing G1 cell-cycle arrest
(A) Normalized gene set enrichment statistics were calculated using ranked log fold change (FC) values with our previous RNA-seq data of HPAC, HPAF-II, Pa01C, Pa04C, Pa14C, PANC-1, and SW1990 cell lines treated with ERKi (1 μM, 24 h) compared with baseline (0 h) (PRJEB25806) (Bryant et al., 2019). Shown is enrichment for 34 DNA damage repair gene sets from the Molecular Signatures Database (MSigDB) in ERKi-treated cells. Negative enrichment indicates genes downregulated upon the addition of ERKi. Gene sets used in analysis are provided in Table S2. (B) Relative mRNA expression of the indicated DDR genes from RNA-seq analyses of the indicated PDAC cell lines treated with ERKi (1 μM, 24 h). All values were standardized to 0 h to determine the relative expression change. The mean and SD were determined, with each dot representing a different cell line. MYC expression change was evaluated as a positive control for a previously validated ERK-regulated gene (Vaseva et al., 2018). Statistical significance was determined via dispersion corrected, moderated t tests as implemented in limma;*p < 0.05, **p < 0.01, ***p < 0.001, ****p < 0.0001. (C) PDAC cells were treated with the indicated concentrations of ERKi (24 h) and evaluated using immunoblot analyses for the indicated proteins. (D) Relative expression of CHEK1 in the indicated PDAC cell lines after treatment (24 h) with the indicated ERKi concentrations analyzed via qRT-PCR. Significance was determined by a two-way ANOVA and Dunnett’s multiple comparison test; *p < 0.05, **p < 0.01, ***p < 0.001, ****p < 0.0001. (E) Flow cytometry analyses to determine the percentage of cells in specific phases of the cell cycle, in PDAC cell lines treated (24 h) with the indicated concentrations of ERKi. (F) Flow cytometry analyses to determine the percentage of cells in specific phases of the cell cycle, in PDAC cell lines treated (24 h) with the indicated concentrations of palbociclib (CDK4/6i). (G) qRT-PCR analyses to determine CHEK1 transcript levels following 24 h palbociclib (CDK4/6i) treatment of PDAC cell lines at the indicated concentrations. Significance was determined by a two-way ANOVA and Dunnett’s multiple comparison test; ***p < 0.001, ****p < 0.0001. (H) Immunoblot analyses to determine CHK1 protein levels following 72 h palbociclib (CDK4/6i) treatment of PDAC cell lines at the indicated concentrations. In (C)–(H), all experiments were performed in biological triplicate, for immunoblots a representative image is shown, and graphs depict mean and SD.
Figure 6.
Figure 6.. Loss of RIF1 increases sensitivity to CHK1i
(A) Shown is a volcano plot comparing the log2 fold change (FC) versus the −logP (RSA sensitizer) of data from the CRISPR-Cas9 ERK substrate library screen to identify genes that modulate sensitivity to treatment with CHK1i at GI25 (15 nM, 4 weeks) or with DMSO vehicle control. (B) Top 25 genes identified in the screen in (A) were ranked by logP following RSA analysis, relative to vehicle-treated cells. (C) Representative immunofluorescence images of RIF1 (green) and γH2AX (red) expression following CHK1i or vehicle treatment. DAPI staining was done to visualize nuclei (white). Arrowhead indicates a RIF1 foci-positive nucleus; scale bar, 25 μm. (D) Quantification of the percentage of RIF-positive nuclei. Significance was evaluated using an unpaired t test; **p < 0.01. (E) Relative RIF1 expression was determined using qRT-PCR to quantify knockdown after treatment (72 h) with three distinct siRNAs targeting RIF1 or NS control in Pa02C and Pa16C PDAC cell lines further characterized in (F)–(H). (F) Growth was evaluated using live cell counting following RIF1 knockdown and CHK1i treatment (5 days). Cells were reverse-transfected with NS or three different siRNAs targeting RIF1 and treated with CHK1i starting 12 h later. (G) Graph showing the GI50 for CHK1i in NS versus RIF1 knockdown cells as in (F). Significance was determined by one-way ANOVA with Dunnett’s multiple-comparisons test; *p < 0.05, **p < 0.01. (H) RIF1 was depleted in Pa16C cells via siRNA for 12 h, and then cells were treated with CHK1i for an additional 5 days. Apoptosis was monitored using FACS analysis of propidium iodide and fluorescein isothiocyanate (FITC)-Annexin-stained cells. Significance was determined using two-way ANOVA and Tukey’ s multiple-comparisons test; *p < 0.05, **p < 0.01. (I) Cells were treated with 1 μM ERKi for the indicated times. RNA was collected and analyzed using RNA-seq. Statistical significance was determined using dispersion corrected, moderated t tests as implemented in limma; **p < 0.01, ***p < 0.001. Each dot represents a cell line. (J) Cells were treated with the indicated concentrations of ERKi for 24 h, then RNA was collected and evaluated using qRT-PCR. Significance was determined using one-way ANOVA and Dunnett’s multiple-comparisons test, where each treatment was compared with DMSO treatment; *p < 0.05, **p < 0.01, ***p < 0.001. In (C)–(H) and (J), all experiments were performed in biological triplicate. and graphs depict mean and SD.
Figure 7.
Figure 7.. CHK1 inhibition induces autophagy
(A) Cell lines stably expressing the autophagic flux biosensor mCherry-EGFP-LC3B were imaged following treatment with CHK1i (32 nM, 24 h) or vehicle control. Significance was evaluated using an unpaired t test; **p < 0.01, ****p <0.0001. Representative images are shown in Figure S10A. (B) Percentage of cells in apoptosis induced by CHK1i and/or chloroquine (CQ) alone or in combination (5 days) was determined via FITC-Annexin V staining and flow cytometry. Significance was determined using two-way ANOVA and Tukey’s multiple-comparisons test; *p < 0.05, **p < 0.01, ***p < 0.001. (C) Cells were treated for 5 days with the indicated concentrations of ERKi, CHK1i, and/or CQ alone or in combination. Cell growth was evaluated using live cell counting. For the kill effect, a shift from blue to red indicates a decrease in viability. (D) Graph showing alterations in the GI50 of ERKi following treatment combinations as shown in (C). GI50 shifts are shown for Pa02C and Pa16C cells treated with CHK1i at 4 and 8 nM, respectively, and 1.56 μM of CQ. Significance was determined as in (B). (E) Cells were treated simultaneously with CHK1i (8 or 32 nM) and ERKi (200 nM), with or without CQ (8 μM) for 5 days. Cells were collected, and apoptosis was determined using FACS analysis of Annexin V- and propidium iodide-labeled cells. Significance was determined as in (B). (F) The same triple combinations as in (C)–(E) were evaluated in patient-derived PDAC organoids. Organoids were treated for 10 days with the indicated concentrations of ERKi and CHK1i, with or without CQ (3.125 μM). The median of three biological replicates for each treatment is shown, and a shift from blue to red indicates reduction in organoid viability as assessed using CellTiter Glo. In (A)–(E) all experiments were performed in biological triplicate (A–D) or quadruplicate (E), and graphs represent the mean and SD.

References

    1. Adhikari H, and Counter CM (2018). Interrogating the protein interactomes of RAS isoforms identifies PIP5K1A as a KRAS-specific vulnerability. Nat. Commun 9, 3646. - PMC - PubMed
    1. Baldelli E, Calvert V, Hodge A, VanMeter A, Petricoin EF, and Pierobon M (2017). Reverse phase protein microarrays. In Molecular Profiling: Methods and Protocols, Espina V, ed. (New York: Springer; ), pp. 149–169. - PubMed
    1. Bennouna J, Lang I, Valladares-Ayerbes M, Boer K, Adenis A, Escudero P, Kim T-Y, Pover GM, Morris CD, and Douillard J-Y (2011). A phase II, open-label, randomised study to assess the efficacy and safety of the MEK1/2 inhibitor AZD6244 (ARRY-142886) versus capecitabine monotherapy in patients with colorectal cancer who have failed one or two prior chemotherapeutic regimens. Invest. New Drugs 29, 1021–1028. - PubMed
    1. Bhowmick R, Thakur RS, Venegas AB, Liu Y, Nilsson J, Barisic M, and Hickson ID (2019). The RIF1-PP1 axis controls abscission timing in human cells. Curr. Biol 29, 1232–1242.e5. - PubMed
    1. Bodoky G, Timcheva C, Spigel DR, La Stella PJ, Ciuleanu TE, Pover G, and Tebbutt NC (2012). A phase II open-label randomized study to assess the efficacy and safety of selumetinib (AZD6244 [ARRY-142886]) versus capecitabine in patients with advanced or metastatic pancreatic cancer who have failed first-line gemcitabine therapy. Invest. New Drugs 30, 1216–1223. - PubMed

Publication types

MeSH terms