. 2021 Nov 30;37(9):110071.
doi: 10.1016/j.celrep.2021.110071.

Heterogeneity of human anti-viral immunity shaped by virus, tissue, age, and sex

Affiliations

Heterogeneity of human anti-viral immunity shaped by virus, tissue, age, and sex

Maya M L Poon et al. Cell Rep. .

Abstract

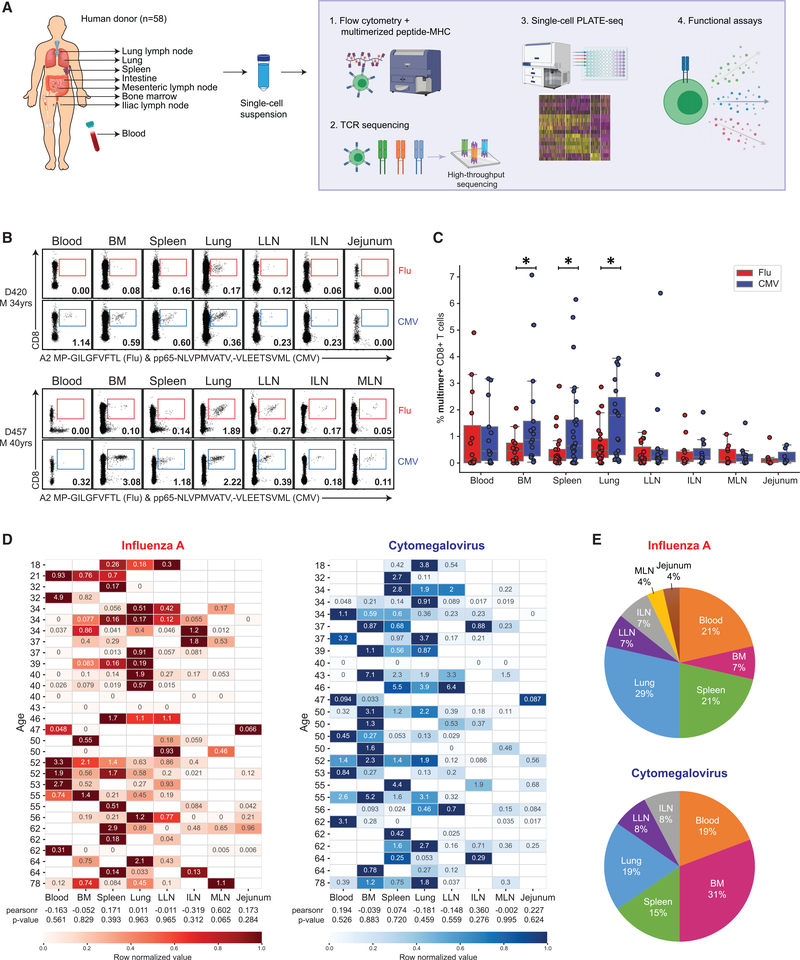
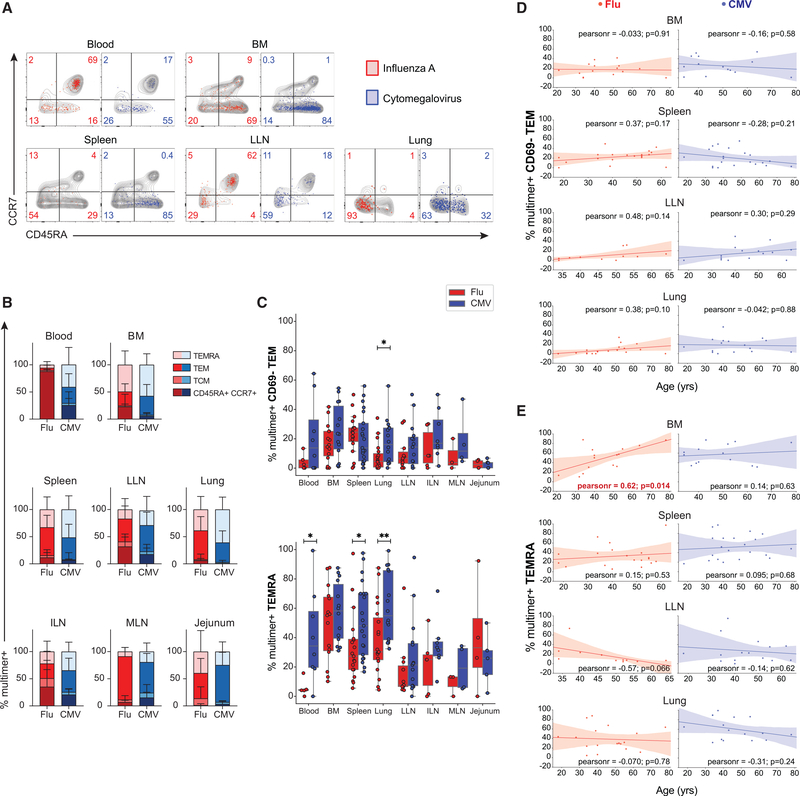
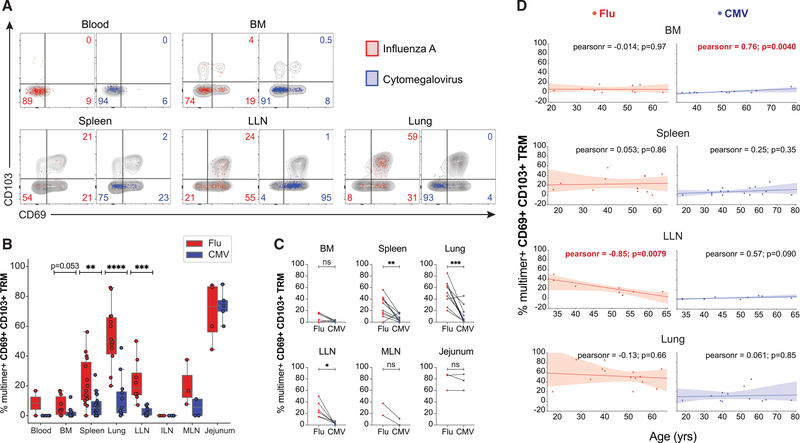
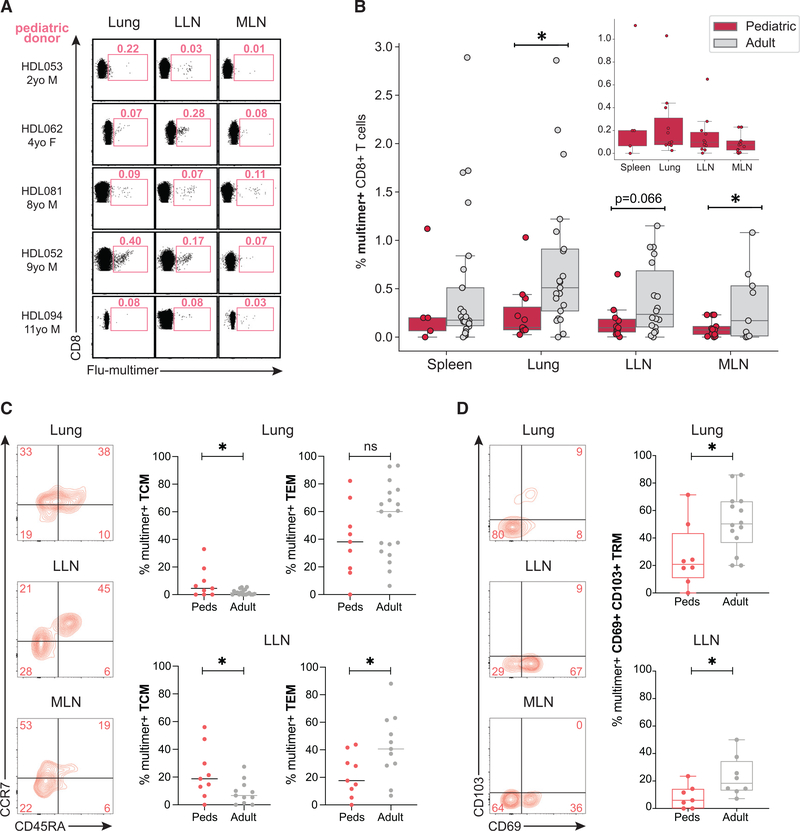
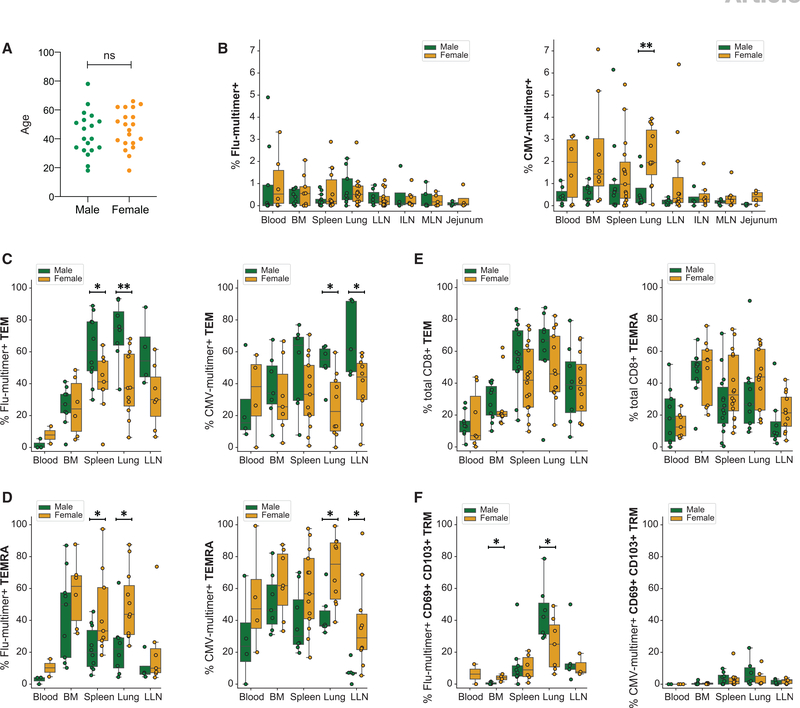
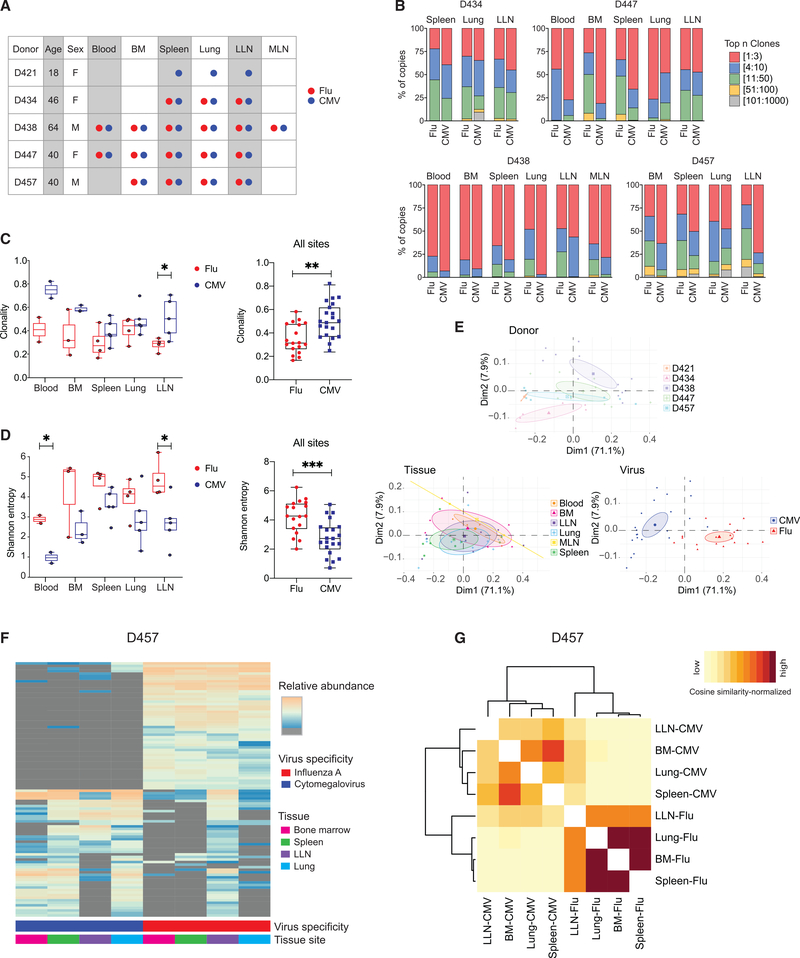
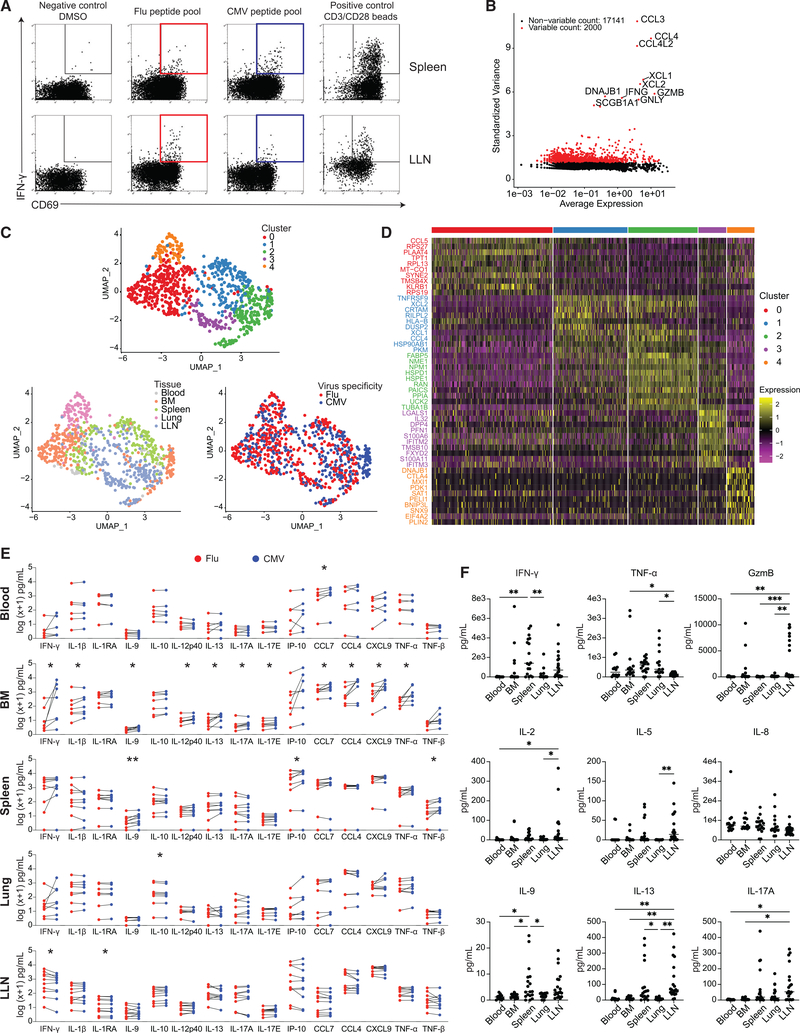
The persistence of anti-viral immunity is essential for protection and exhibits profound heterogeneity across individuals. Here, we elucidate the factors that shape maintenance and function of anti-viral T cell immunity in the body by comprehensive profiling of virus-specific T cells across blood, lymphoid organs, and mucosal tissues of organ donors. We use flow cytometry, T cell receptor sequencing, single-cell transcriptomics, and cytokine analysis to profile virus-specific CD8+ T cells recognizing the ubiquitous pathogens influenza and cytomegalovirus. Our results reveal that virus specificity determines overall magnitude, tissue distribution, differentiation, and clonal repertoire of virus-specific T cells. Age and sex influence T cell differentiation and dissemination in tissues, while T cell tissue residence and functionality are highly correlated with the site. Together, our results demonstrate how the covariates of virus, tissue, age, and sex impact the anti-viral immune response, which is important for targeting, monitoring, and predicting immune responses to existing and emerging viruses.

Keywords: T lymphocytes; anti-viral immunity; cytomegalovirus; human immunology; immunological memory; influenza; lymphoid organs; mucosal immunity; tissue resident memory T cells.


Conflict of interest statement

Declaration of interests A.S. is a consultant for Gritstone, Flow Pharma, Arcturus, Immunoscape, CellCarta, OxfordImmunotech, and Avalia. La Jolla Institute for Immunology (LJI) has filed for patent protection for various aspects of T cell epitope and vaccine design work. E.T.L.P. is an advisor for Roche Diagnostics, Enpicom, The Antibody Society, IEDB, and The American Autoimmune Related Diseases Association. D.L.F. is a consultant for Moderna.

Figures

Figure 1.
Figure 1.. Differential maintenance of flu- and CMV-specific CD8+ T cells across diverse tissue sites
(A) Schematic diagram illustrating human tissues obtained and experimental workflow for this study. (B) Distribution of influenza A (flu)-specific (red) and cytomegalovirus (CMV)-specific (blue) CD8+ T cells in different human tissues of two representative donors (D420, top; D457, bottom) based on staining with multimer reagents containing viral epitopes shown in representative flow cytometry plots (see Figure S1 for gating strategy). Numbers indicate frequency of multimer+ cells within total CD8+ T cells. (C) Frequencies of flu-multimer+ (red) and CMV-multimer+ (blue) CD8+ T cells from 7–27 donors for each tissue site. (D) Heatmaps showing frequency of flu-specific (left) and CMV-specific (right) CD8+ T cells in blood and tissues sites for individual donors from which data from two or more tissues were obtained. Donors are arranged by increasing age, and color intensity of each cell is based on row normalization of (minimum to maximum [min-max] scaled) values (white cells indicate no sample). Pearson correlation analysis of age and multimer frequency is indicated by “pearsonr” correlation coefficients, and p values are listed underneath each heatmap. (E) Pie charts showing percentage of donors for which the indicated tissue contains the greatest frequency of flu-multimer+ (top) or CMV-multimer+ (bottom) cells among the tissue sites studied for that donor. Statistical significance for comparison of means was calculated by unpaired t test and indicated by *p ≤ 0.05. BM, bone marrow; ILN, iliac lymph node; LLN, lung draining lymph node; M, male; MLN, mesenteric lymph node.
Figure 2.
Figure 2.. Antigen-specific CD8+ T cell subset differentiation and phenotype are based on virus specificity independent of age
(A) T cell subset distribution of flu-specific (red) and CMV-specific(blue) CD8+ T cells based on CD45RA and CCR7 expression (CD45RA+/CCR7+; CD45RA/CCR7+, TCM; CD45RA/CCR7, TEM; CD45RA+/CCR7, TEMRA) shown in representative flow cytometry plots. Gray contour plots depict CD45RA and CCR7 expression of total CD8+ T cells within the same sample. Numbers indicate frequency of multimer+ virus-specific cells within each subset. (B) Subset distribution of flu-specific (shades of red) and CMV-specific (shades of blue) CD8+ T cells compiled from 3–21 donors in blood and indicated tissue sites. (C) Frequencies of flu-multimer+ (red) and CMV-multimer+ (blue) CD8+ T cells maintained as CD69 TEM cells (top) and TEMRAs (bottom) from 3–21 donors for each tissue site. (D and E) Frequencies of flu-specific (red, left) and CMV-specific (blue, right) CD8+CD69 TEM cells (D) and CD8+ TEMRAs (E) in indicated tissue sites as a function of age for each individual donor. The line of best fit was determined by Pearson correlation; “pearsonr” refers to correlation coefficient, p values are indicated for each comparison, and red font indicates significant correlation for BM. Statistical significance for comparison of means was calculated by unpaired t test and indicated by **p ≤ 0.01; *p ≤ 0.05. Subset frequencies shown from donors with ≥10 multimer+ T cells.
Figure 3.
Figure 3.. Establishment of tissue residency correlates with virus specificity and site
(A) Expression of tissue residency markers CD69 and CD103 by flu-specific (red) and CMV-specific (blue) CD8+ T cells in indicated tissue sites shown in representative flow cytometry plots with gray contour plots depicting total CD8+ T cells within the same sample; numbers indicate frequency of multimer+ virus-specific cells. (B) Frequencies of flu-multimer+ (red) and CMV-multimer+ (blue) CD69+CD103+CD8+ TRM cells gated on TEM cells from 2–18 donors for each site. Statistical significance for comparison of means was calculated by unpaired t test and indicated by ****p ≤ 0.0001; ***p ≤ 0.001; **p ≤ 0.01. (C) Paired frequencies within individual donors of flu-multimer+ (red) and CMV-multimer+ (blue) CD69+ CD103+ CD8+ TRM cells from 2–10 donors for each site. Statistical significance between flu- and CMV-multimer+ TRM cells within each tissue site was determined by paired t test and indicated by ***p ≤ 0.001; **p ≤ 0.01; *p ≤ 0.05; ns, not significant. (D) Frequencies of flu-specific (red, left) and CMV-specific (blue, right) TRM cells in indicated tissue sites as a function of age for each individual donor. The line of best fit, Pearson coefficient, and p value are indicated for each comparison; red font indicates significant correlation for LLN. TRM cell frequencies shown from donors with ≥5 multimer+ TEM cells.
Figure 4.
Figure 4.. Distinct frequencies and subset distribution of flu-specific memory CD8+ T cells between adult and pediatric donors
(A) Distribution of flu-specific CD8+ T cells in lung, LLN, and MLN of pediatric and adult donors shown in representative flow cytometry plots. Numbers indicate frequency of multimer+ cells within total CD8+ T cell population. (B) Frequencies of flu-multimer+ CD8+ T cells in pediatric (pink; n = 15) and adult (gray; n = 31) donors from 5–21 donors for each tissue site. Inset shows frequencies of flu-multimer+ cells in pediatric tissues with y axis spanning 0%–1%. (C) Memory T cell subset distribution of flu-specific CD8+ T cells in indicated tissues of pediatric donors shown in representative flow cytometry plots (left) and compiled in graph (right) showing frequencies of flu-multimer+ CD8+ T cells in pediatric (pink) and adult (gray) donors maintained as TCM (left) and TEM (right) in lung (top) and LLN (bottom) tissue sites. Subset frequencies shown from donors with ≥10 multimer+ T cells. (D) Expression of tissue residency markers CD69 and CD103 by flu-specific CD8+ T cells in indicated tissues of pediatric donors shown in representative flow cytometry plots (left) and compiled in graph (right) showing frequencies of flu-multimer+ CD69+CD103+CD8+ TRM cells (gated on TEM) in pediatric (pink) and adult (gray) donors in lung (top) and LLN (bottom) tissue sites. TRM frequencies shown from donors with ≥5 multimer+ TEM cells. Statistical significance for comparison of means was calculated by unpaired t test and indicated by *p ≤ 0.05; ns, not significant.
Figure 5.
Figure 5.. Sex-related differences in tissue maintenance of virus-specific CD8+ T cells
(A) Age range of male and female donors in this study (male: green, n = 19; female: yellow, n = 20). (B) Frequencies of flu-multimer+ (left) and CMV-multimer+ (right) CD8+ T cells from 3–15 donors for each site stratified by sex. (C and D) Frequencies of flu-multimer+ (left) and CMV-multimer+ (right) CD8+ TEM cells (C) and CD8+ TEMRAs (D) from 2–13 donors for each site stratified by sex. (E) Frequencies of total CD8+ TEM cells (top) and TEMRA (bottom) from 7–16 donors for each site stratified by sex. (F) Frequencies of flu-multimer+ (left) and CMV-multimer+ (right) CD69+ CD103+ CD8+ TRM cells gated on multimer+ cells from 2–10 donors for each site stratified by sex. Subset frequencies shown from donors with ≥10 multimer+ T cells, and TRM frequencies shown from donors with ≥5 multimer+ TEM cells. Statistical significance for comparison of means was calculated by unpaired t test and indicated by **p ≤ 0.01; *p ≤ 0.05; ns, not significant.
Figure 6.
Figure 6.. CD8+ T cell clonal distribution and diversity are shaped by virus specificity
(A) Diagram showing donor, tissue, and virus specificity of samples for T cell receptor (TCR) sequencing. flu-multimer+ (red), CMV-multimer+ (blue), and total (gray) CD8+ T cells were sorted from indicated tissue sites of five organ donors. (B) Clonal abundance plots showing proportion of top n clones per sample for flu- and CMV-specific CD8+ T cells from indicated tissue sites for donors D434 (top left), D447 (top right), D438 (bottom left), and D457 (bottom right). (C and D) TCR clonality (C; see STAR Methods) and Shannon entropy (D; see STAR Methods) by virus specificity for flu-specific (red) and CMV-specific (blue) CD8+ T cell clones stratified by tissue site (left) and in all tissue sites combined (right). (E) Principal-component analysis (PCA) of TRBV gene usage based on clone counts per sample, labeled and grouped by donor, tissue, and virus with confidence ellipses plotted around group mean points using the factoextra R package. (F) Sharing of flu- and CMV-specific CD8+ T cells between indicated sites of donor D457 shown in clone tracking plots with each individual clone denoted by a line shaded by relative abundance within a tissue site. (G) Cosine similarity between pairwise cell populations of flu- and CMV-specific CD8+ T cell clones in BM, LLN, lung, and spleen of donor D457. Color intensity of each cell is based on the normalization of (min-max scaled) values of sequenced samples. Statistical significance for comparison of means was calculated by unpaired t test and indicated by ***p ≤ 0.001; **p ≤ 0.01; *p ≤ 0.05.
Figure 7.
Figure 7.. Tissue segregation of the anti-viral T cell response revealed by single-cell transcriptome and functional profiling
(A) Antigen-responding CD69+IFN-γ+CD8+ T cells in the spleen and LLN of donor D481 following stimulation by DMSO negative control, flu antigen-specific peptide pool, CMV antigen-specific peptide pool, and anti-CD3/CD28 bead positive control, shown in representative flow cytometry plots. Colored gates (red: flu; blue: CMV) indicate populations that were subsequently sorted for sequencing. (B) Scatterplot showing 2,000 variable genes (red) as determined by calculating average expression and dispersion of each gene. The top 10 most highly variable genes are labeled on the graph. (C) UMAP embedding of virus-reactive CD8+ T cells colored by cluster as identified via unsupervised hierarchical clustering (see STAR Methods), tissue, or virus specificity. (D) Heatmap showing top 10 most differentially expressed genes in each cluster. See Table S4 for complete list of differentially expressed genes (padj < 0.1). (E) Pairwise comparisons of log(x+1) normalized cytokine levels in supernatants from in vitro stimulation of single-cell suspensions from blood (n = 6), BM (n = 7), spleen (n = 9), lung (n = 8), and LLN (n = 10) with flu (red) or CMV (blue) peptide pools. Statistical significance between flu- and CMV-stimulated conditions was calculated by paired t test and indicated by **p ≤ 0.01; *p ≤ 0.05. (F) Cytokine levels in blood, BM, spleen, lung, and LLN supernatant samples. Statistical significance was calculated using one-way ANOVA followed by Tukey’s multiple comparisons test indicated by ***p ≤ 0.001; **p ≤ 0.01; *p ≤ 0.05.

Similar articles

Cited by

References

    1. Abdullah M, Chai PS, Chong MY, Tohit ER, Ramasamy R, Pei CP, and Vidyadaran S (2012). Gender effect on in vitro lymphocyte subset levels of healthy individuals. Cell. Immunol. 272, 214–219. - PubMed
    1. Akondy RS, Fitch M, Edupuganti S, Yang S, Kissick HT, Li KW, Youngblood BA, Abdelsamed HA, McGuire DJ, Cohen KW, et al. (2017). Origin and differentiation of human memory CD8 T cells after vaccination. Nature 552, 362–367. - PMC - PubMed
    1. Alam S, and Sant AJ (2011). Infection with seasonal influenza virus elicits CD4 T cells specific for genetically conserved epitopes that can be rapidly mobilized for protective immunity to pandemic H1N1 influenza virus. J. Virol. 85, 13310–13321. - PMC - PubMed
    1. Assarsson E, Bui HH, Sidney J, Zhang Q, Glenn J, Oseroff C, Mba-wuike IN, Alexander J, Newman MJ, Grey H, and Sette A (2008). Immunomic analysis of the repertoire of T-cell specificities for influenza A virus in humans. J. Virol. 82, 12241–12251. - PMC - PubMed
    1. Bolotin DA, Poslavsky S, Mitrophanov I, Shugay M, Mamedov IZ, Putintseva EV, and Chudakov DM (2015). MiXCR: software for comprehensive adaptive immunity profiling. Nat. Methods 12, 380–381. - PubMed

Publication types

MeSH terms