. 2021 Nov 30;37(9):110076.
doi: 10.1016/j.celrep.2021.110076.

Synaptic protein interaction networks encode experience by assuming stimulus-specific and brain-region-specific states

Affiliations

Synaptic protein interaction networks encode experience by assuming stimulus-specific and brain-region-specific states

Jonathan D Lautz et al. Cell Rep. .

Abstract

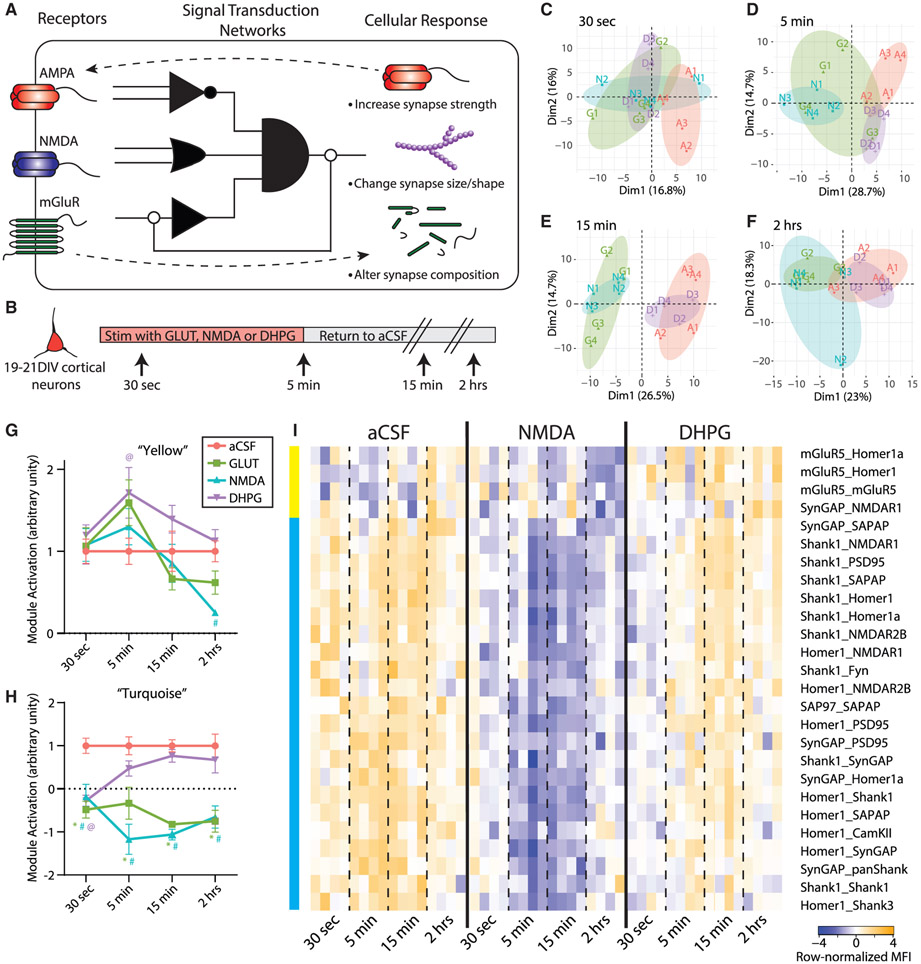
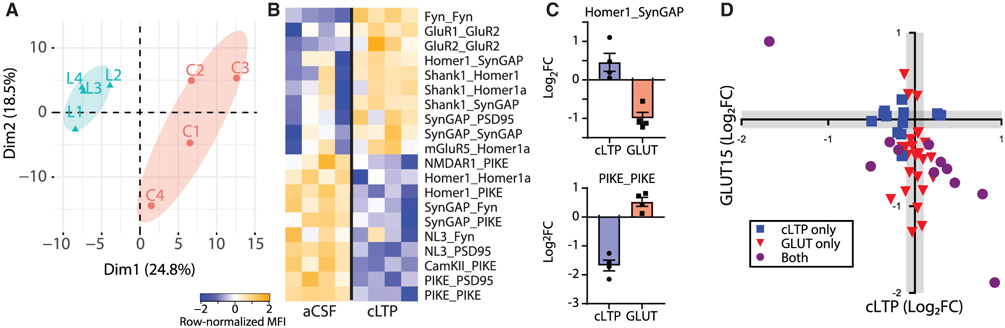
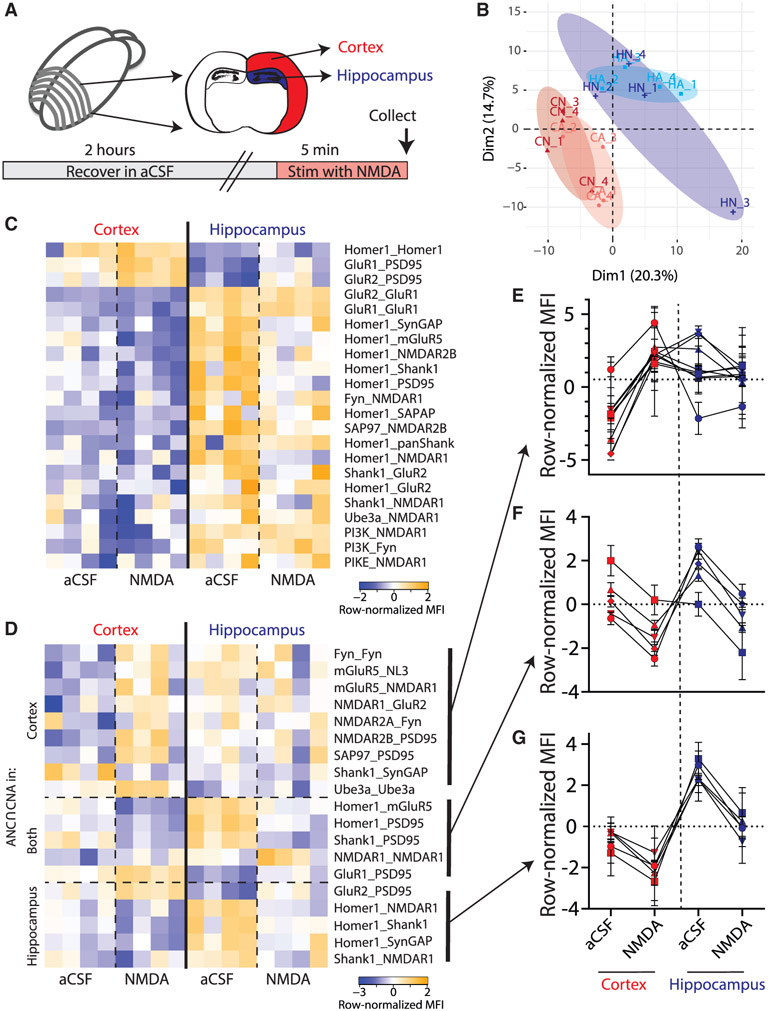
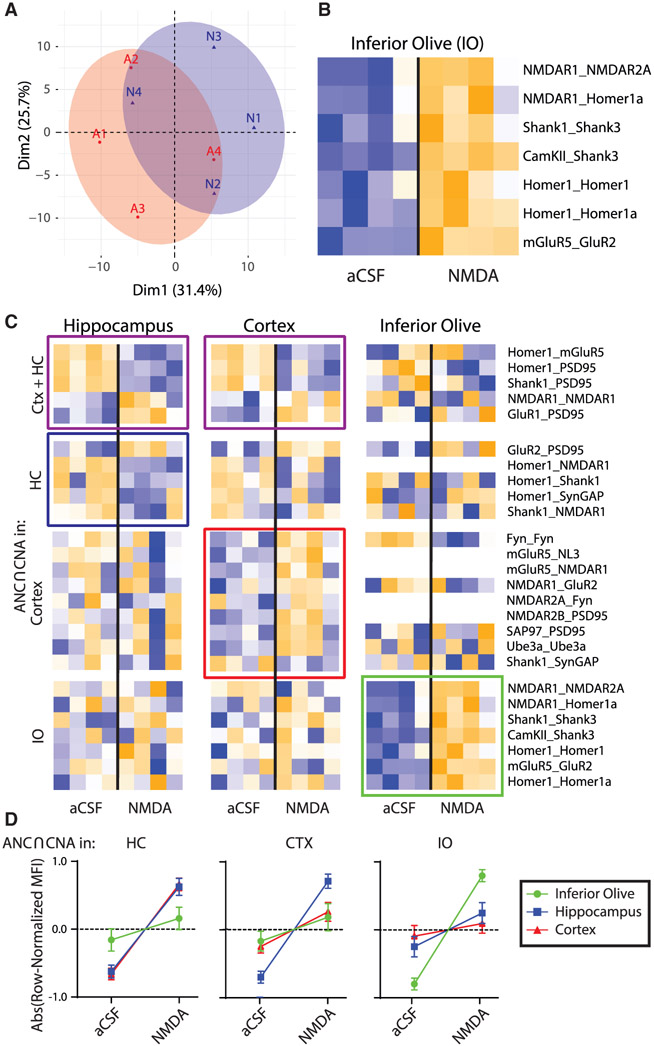
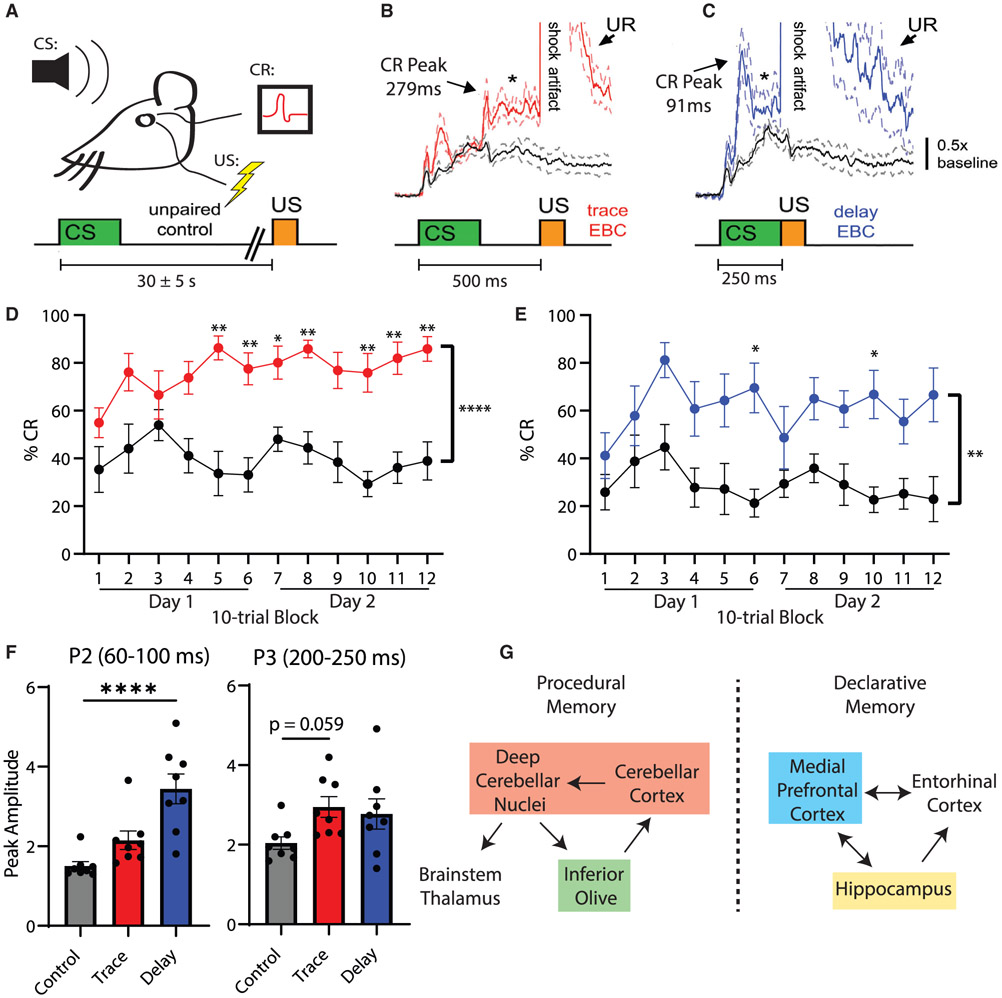
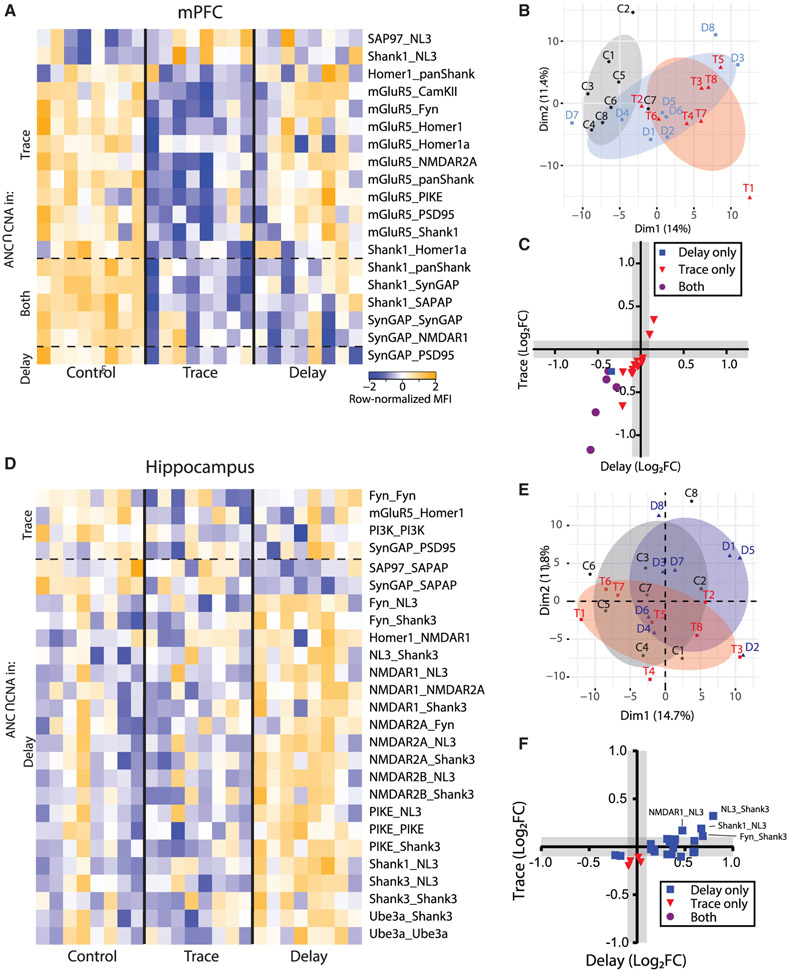
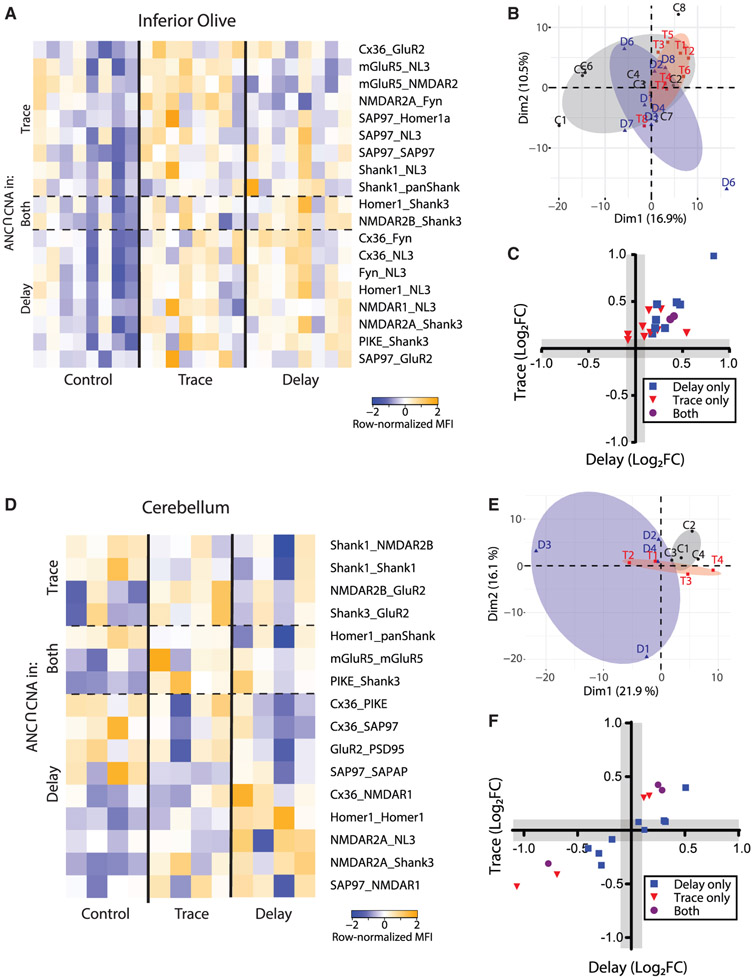
A core network of widely expressed proteins within the glutamatergic post-synapse mediates activity-dependent synaptic plasticity throughout the brain, but the specific proteomic composition of synapses differs between brain regions. Here, we address the question, how does proteomic composition affect activity-dependent protein-protein interaction networks (PINs) downstream of synaptic activity? Using quantitative multiplex co-immunoprecipitation, we compare the PIN response of in vivo or ex vivo neurons derived from different brain regions to activation by different agonists or different forms of eyeblink conditioning. We report that PINs discriminate between incoming stimuli using differential kinetics of overlapping and non-overlapping PIN parameters. Further, these "molecular logic rules" differ by brain region. We conclude that although the PIN of the glutamatergic post-synapse is expressed widely throughout the brain, its activity-dependent dynamics show remarkable stimulus-specific and brain-region-specific diversity. This diversity may help explain the challenges in developing molecule-specific drug therapies for neurological disorders.

Keywords: PiSCES; eyeblink conditioning; protein-protein interaction; signaling.


Conflict of interest statement

Conflict of interest The authors declare no competing interests.

Figures

Figure 1.
Figure 1.. Glutamate post-synapse PIN kinetics following NMDA and DHPG stimulation of cultured cortical neurons
(A) Conceptual illustration of a PIN logic circuit linking receptor inputs with cellular outcome. Receptors on the cell surface activate “molecular logic circuits” that link receptor activation to downstream cellular responses. (B) Experimental design. (C–F) PCA of 30 s (C), 5 min (D), 15 min (E), and 2 h (F) time points separates aCSF (A, red), glutamate (G, green), NMDA (N, blue), and DHPG (D, purple) treatments. Each data point represents a single biological replicate, N = 48 total. (G) Average aCSF-normalized time course of PiSCES in the turquoise CNA module for the aCSF, glutamate, NMDA, and DHPG treatments. *, #, and@indicate p < 0.005 for glutamate, NMDA, and DHPG, respectively, by Dunnett’s post hoc test after significant 2-way ANOVA (treatment, F3,48 = 52.31, p < 0.0001; time, F3,48 = 0.13 NS; interaction, F9,48 = 2.92, p < 0.01). (H) Average aCSF-normalized time course of PiSCES in the yellow CNA module presented as in (G). *, #, and@indicate p < 0.05 for glutamate, NMDA, and DHPG, respectively, by Dunnett’s post hoc tests after significant 2-way ANOVA (treatment, F3,48 = 4.78, p < 0.01; time, F3,48 = 7.94, p < 0.0005; interaction, F9,48 = 1.65, NS). (I) Heatmap of all PiSCES that were ANC∩CNA significant for the 30 s to 2 h time course expressed as row-normalized MFI. All PiSCES shown are ANC∩CNA significant, meaning they are significant by the ANC statistical test for a comparison between the ACSF condition and at least one time point/treatment and belong to a CNA module that is significantly correlated with NMDA and/or DHPG treatment. CNA modules are illustrated by colored bars on the left, for details on CNA analysis see Figure S2. Each column represents a single biological replicate, N = 48, and each box represents a single PiSCES measurement.
Figure 2.
Figure 2.. Glutamate post-synapse PIN alterations following chemical LTP in cultured cortical neurons
(A) PCA showing separation of aCSF control (C, red) and cLTP (L, blue). (B) Heatmap of all PiSCES that were ANC∩CNA significant for the cLTP versus control comparison, meaning they are significant by the ANC statistical test and belong to a CNA module that is significantly correlated with cLTP treatment. Each column represents a single biological replicate, N = 8, and each box represents a single PiSCES measurement. (C) Graphs comparing the log2 fold change of two example PiSCES, Homer1_SynGAP and PIKE_PIKE, that were ANC∩CNA-significant in both cLTP and 15-min GLUT experiments. Points represent a ratio between the aCSF condition and the respective stimulation, N = 4 per treatment. (D) x-y plot comparing the log2 fold change (FC) of all PiSCES that were ANC∩CNA significant for either the cLTP experiment (blue), the 15 min glutamate time point (red), or both experiments (purple).
Figure 3.
Figure 3.. Glutamate post-synapse PIN dynamics following ex vivo NMDA stimulation of CTX and HC slices
(A) Experimental design. (B) PCA of CTX (C, red) and HC (H, blue) following aCSF (A, lighter shade) or NMDA (N, darker shade) treatment. PCA demonstrates separation by brain region but not by NMDA stimulation. Each point represents a biological replicate, N = 16. (C) Heatmap of all PiSCES that were ANC∩CNA significant for the CTX versus HC comparison, meaning they are significant by the ANC statistical for a comparison between CTX versus HC, and belong to a CNA module that is significantly correlated with brain region. Each column represents a single biological replicate, N = 16, and each box represents a single PiSCES measurement. (D) Heatmap of all PiSCES that were ANC∩CNA significant for the NMDA versus aCSF comparison, meaning they are significant by the ANC statistical test for a comparison between ACSF versus NMDA in either brain region and belong to a CNA module that is significantly correlated with NMDA treatment. Each column represents a single biological replicate, N = 16, and each box represents a single PiSCES measurement. PiSCES are grouped based on whether they are ANC significant for the ACSF versus NMDA comparison in cortex (top), hippocampus (bottom), or both (middle). (E–G) Normalized MFIs for PiSCES that were ANC∩CNA significant only in CTX (E), only in HC (G), or both (F). Points represent the average normalized MFI ± SEM for N = 4 biological replicates of a single PiSCES measurement. Lines connect points representing the same PiSCES for visual clarity but do not represent repeated-measures.
Figure 4.
Figure 4.. Effects of NMDA stimulation on the ex vivo IO as compared to CTX and HC
(A) PCA of aCSF (A, red) and NMDA (N, blue) groups for the IO. Each point represents a biological replicate, N = 8. (B) Heatmap of all PiSCES that are ANC∩CNA significant for the NMDA versus aCSF comparison for the IO, meaning they are significant by the ANC statistical test for a comparison between ACSF versus NMDA in the IO and belong to a CNA module that is significantly correlated with NMDA treatment. (C) Heatmaps of all PiSCES that were ANC∩CNA significant for the NMDA versus aCSF comparison in CTX, HC, and IO (CTX and HC data are identical to that in Figure 3). The heatmap is row-normalized separately for each brain region to highlight overall PiSCES behavior while ignoring baseline differences in protein expression. Boxes indicate PiSCES that are ANC∩CNA significant for that brain region: purple boxes indicate significant for both CTX and HC, blue indicates HC, red indicates CTX, and green indicates IO. Although there is overlap in the PiSCES activated by NMDA in HC and CTX, the response in IO is unique. (D) For each brain area, the averaged normalized MFI value of all PiSCES that were ANC∩CNA significant in that brain area are shown for all other brain areas. For example, the left graph shows PiSCES that significant in the HC also showed similar behavior in CTX, but not in the IO. Conversely, PiSCES that were significant in the IO (right graph) did not change in CTX nor in HC.
Figure 5.
Figure 5.. Associative learning modifies the glutamate post-synapse PIN in the mPFC
(A) Experimental design. Eye blinks were detected as muscle activations by intramuscular EMG. CS-US interval for the explicitly unpaired control paradigm was randomized at 30 ± 5 s. (B and C) Average (±SEM) CRs acquired during trace EBC (B, red) and delay EBC (C, blue) as compared to small reflex muscle activations elicited by the CS during unpaired stimuli (black). Block diagrams underneath EMG traces indicate CS-US timing (n = 8 mice per group). (D and E) The percentage CRs during 2 daily sessions of trace (D) (red) or delay (E) (blue) EBC in which the percentage CRs exceeded the unpaired control group for both trace EBC (2-way ANOVA: F(1,14) = 35.8, p < 0.0001)and delay EBC (2-way ANOVA: F(1,14) = 10.3, p = 0.006). Asterisks indicate blocks of 10 trials that were significantly different between EBC and unpaired controls by Sidak post hoc testing (*p < 0.05, **p < 0.01). (F) Peak amplitude of trails in which a CR was recorded for trace (red) and delay (blue) EBC, during the P2 (60–100 ms) or P3 (200–250 ms) time windows. ****p < 0.0001 by ANOVA followed by Dunnett’s post hoc test. (G) Simplified schematic of brain regions mediating procedural or declarative memories with brain regions that were dissected and lysed for QMI analysis highlighted in colored boxes.
Figure 6.
Figure 6.. Effects of associative learning on the glutamate post-synapse PIN in brain regions mediating declarative memory
(A) Heatmap of row-normalized MFIs for all PiSCES that were ANC∩CNA significant in the delay or trace EBC experiments in medial prefrontal cortical tissue, meaning they are significant by the ANC statistical test in a comparison between trace EBC versus control or delay EBC versus control, and belong to a CNA module that is significantly correlated with EBC. Each column represents a single biological replicate, N = 8 per condition, and each colored box represents a single PiSCES measurement. PiSCES are grouped based on if they are ANC-significant in trace EBC (top), delay EBC (bottom) or both trace and delay EBC (middle). (B) PCA of cortical QMI data for the unpaired control (C, black), delay EBC (D, blue), and trace EBC (T, red) groups. Each point represents a single mouse, N = 24. (C) x-y plot comparing the log2 fold change of all PiSCES that were ANC∩CNA significant for only delay EBC (blue), for only trace EBC (red), or for both EBC paradigms (purple) in the cortex. (D–F) Identical to (A)–(C), except data are from hippocampal tissue.
Figure 7.
Figure 7.. Effects of associative learning on the glutamate post-synapse PIN in brain regions mediating procedural memory
(A) Heatmap of row-normalized MFIs for all PiSCES that were ANC∩CNA-significant in the delay or trace EBC experiments in tissue from the inferior olive, meaning PiSCES are significant by the ANC statistical test in a comparison between trace EBC versus control or delay EBC versus control, and belong to a CNA module that is significantly correlated with EBC. Each column represents a single biological replicate, N = 24, and each colored box represents a single PiSCES measurement. PiSCES were grouped based on if they are ANC-significant in trace EBC (top), delay EBC (bottom), or both trace and delay EBC (middle). (B) PCA of cortical QMI data for the unpaired control (C, black), delay EBC (D, blue), and trace EBC (T, red) groups. Each point represents a single mouse, N = 24. (C) x-y plot comparing the log2 fold change of all PiSCES that were ANC∩CNA significant for only delay EBC (blue), for only trace EBC (red), or for both EBC paradigms (purple) in the IO. (D–F) Identical to (A)–(C) except data are from cerebellar tissue and N = 12.

Similar articles

Cited by

References

    1. Antebi YE, Linton JM, Klumpe H, Bintu B, Gong M, Su C, McCardell R, and Elowitz MB (2017). Combinatorial Signal Perception in the BMP Pathway. Cell 170, 1184–1196.e24. - PMC - PubMed
    1. Araki Y, Zeng M, Zhang M, and Huganir RL (2015). Rapid dispersion of SynGAP from synaptic spines triggers AMPA receptor insertion and spine enlargement during LTP. Neuron 85, 173–189. - PMC - PubMed
    1. Araki Y, Hong I, Gamache TR, Ju S, Collado-Torres L, Shin JH, and Huganir RL (2020). SynGAP isoforms differentially regulate synaptic plasticity and dendritic development. eLife 9, e56273. - PMC - PubMed
    1. Bayés A, van de Lagemaat LN, Collins MO, Croning MD, Whittle IR, Choudhary JS, and Grant SG (2011). Characterization of the proteome, diseases and evolution of the human postsynaptic density. Nat. Neurosci 14, 19–21. - PMC - PubMed
    1. Bayés A, Collins MO, Croning MD, van de Lagemaat LN, Choudhary JS, and Grant SG (2012). Comparative study of human and mouse postsynaptic proteomes finds high compositional conservation and abundance differences for key synaptic proteins. PLoS ONE 7, e46683. - PMC - PubMed

Publication types

LinkOut - more resources