. 2021 Dec 9;184(25):6101-6118.e13.
doi: 10.1016/j.cell.2021.11.007. Epub 2021 Nov 30.

Neoantigen-driven B cell and CD4 T follicular helper cell collaboration promotes anti-tumor CD8 T cell responses

Affiliations

Neoantigen-driven B cell and CD4 T follicular helper cell collaboration promotes anti-tumor CD8 T cell responses

Can Cui et al. Cell. .

Abstract

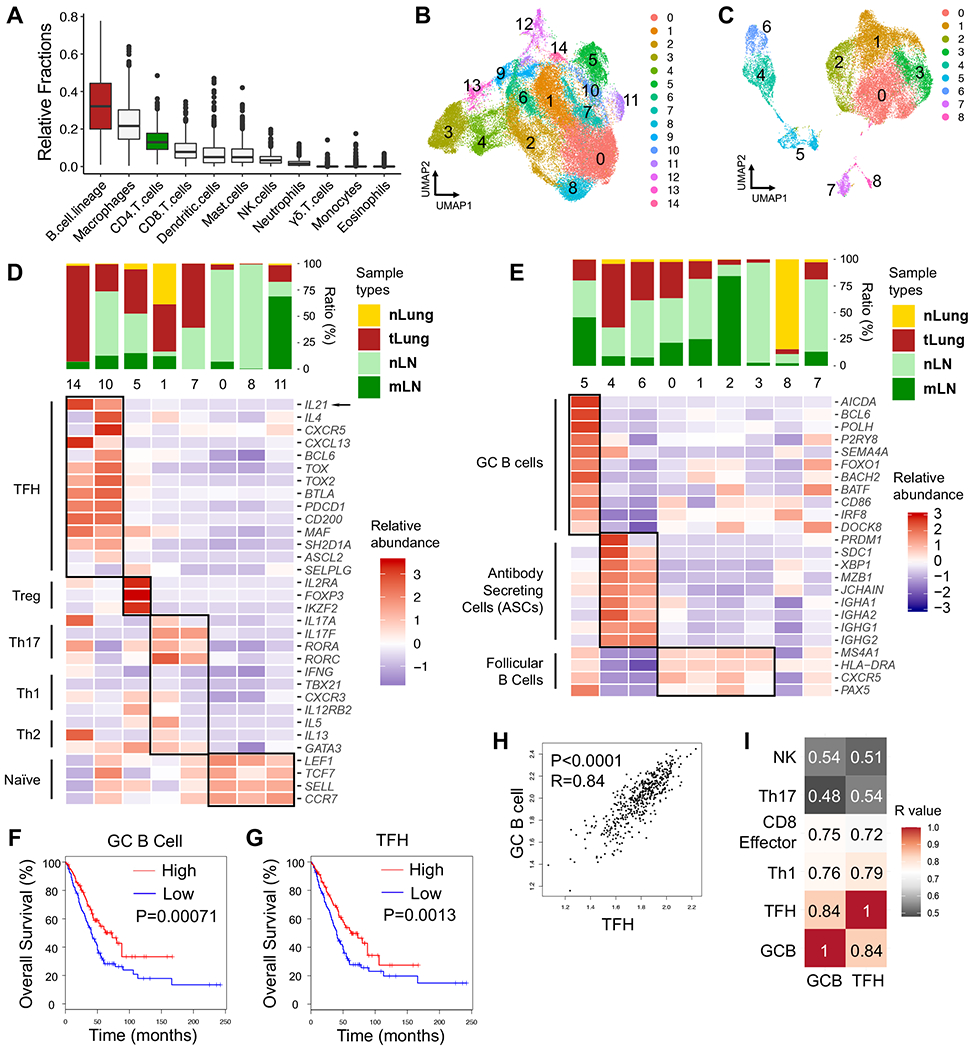
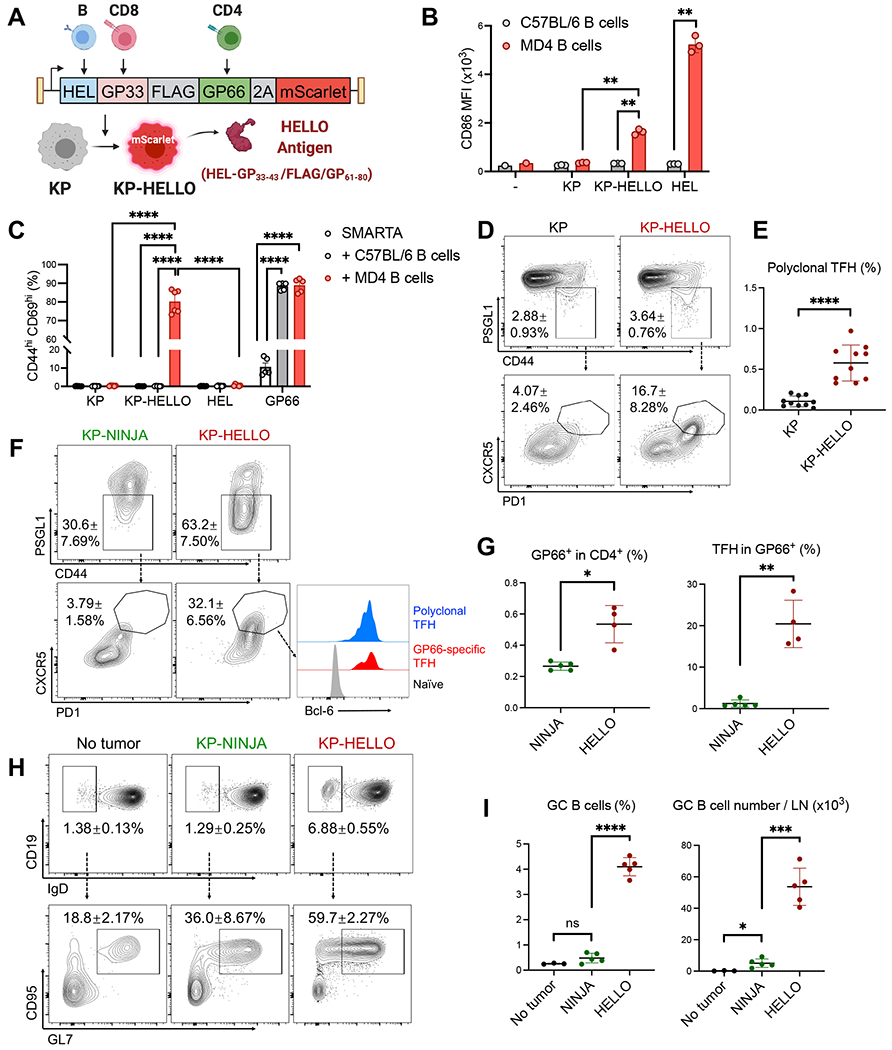
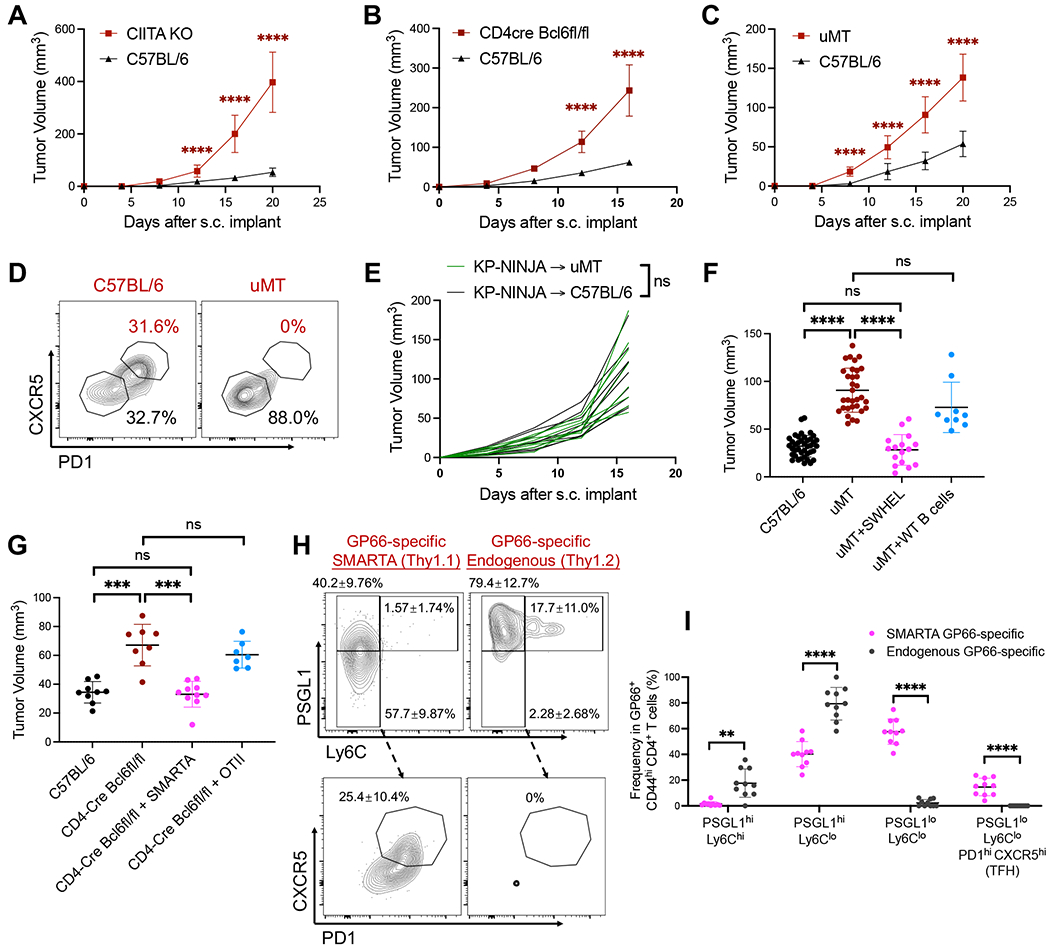
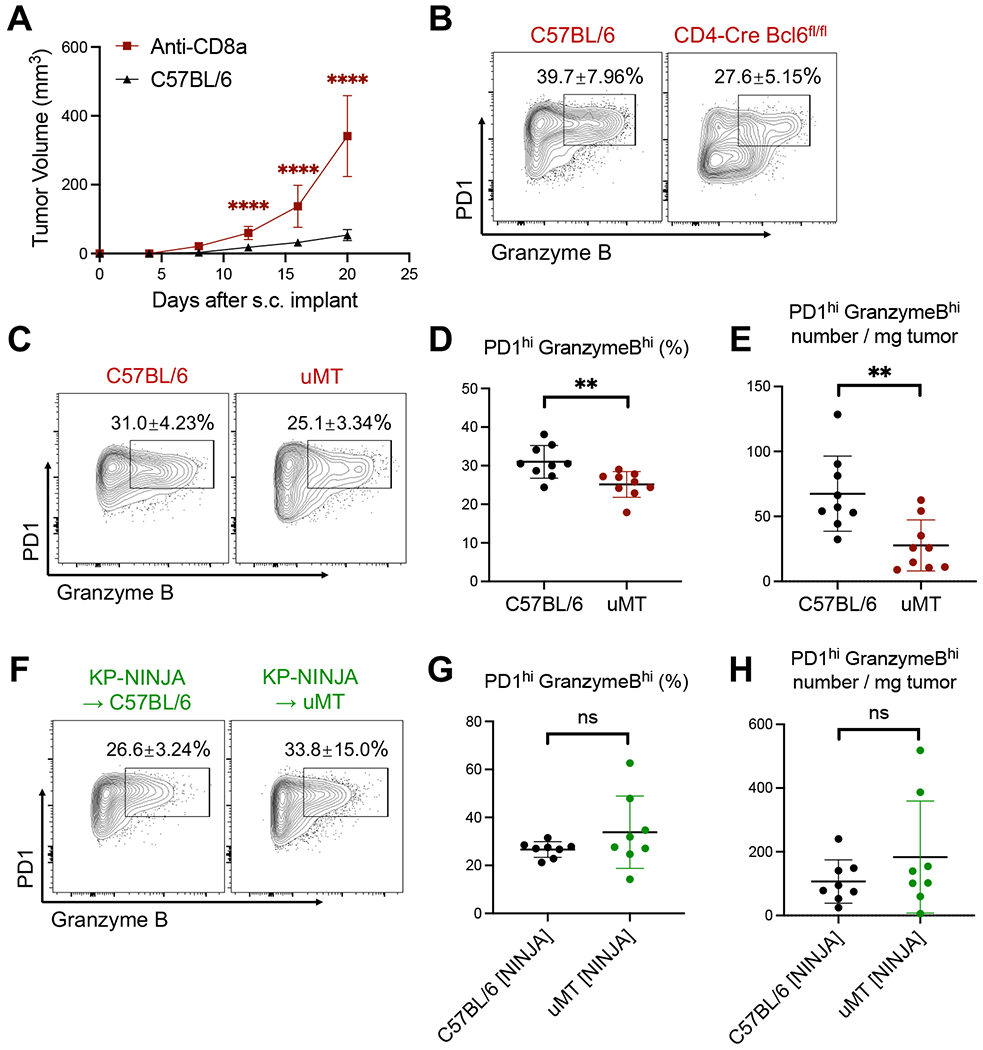
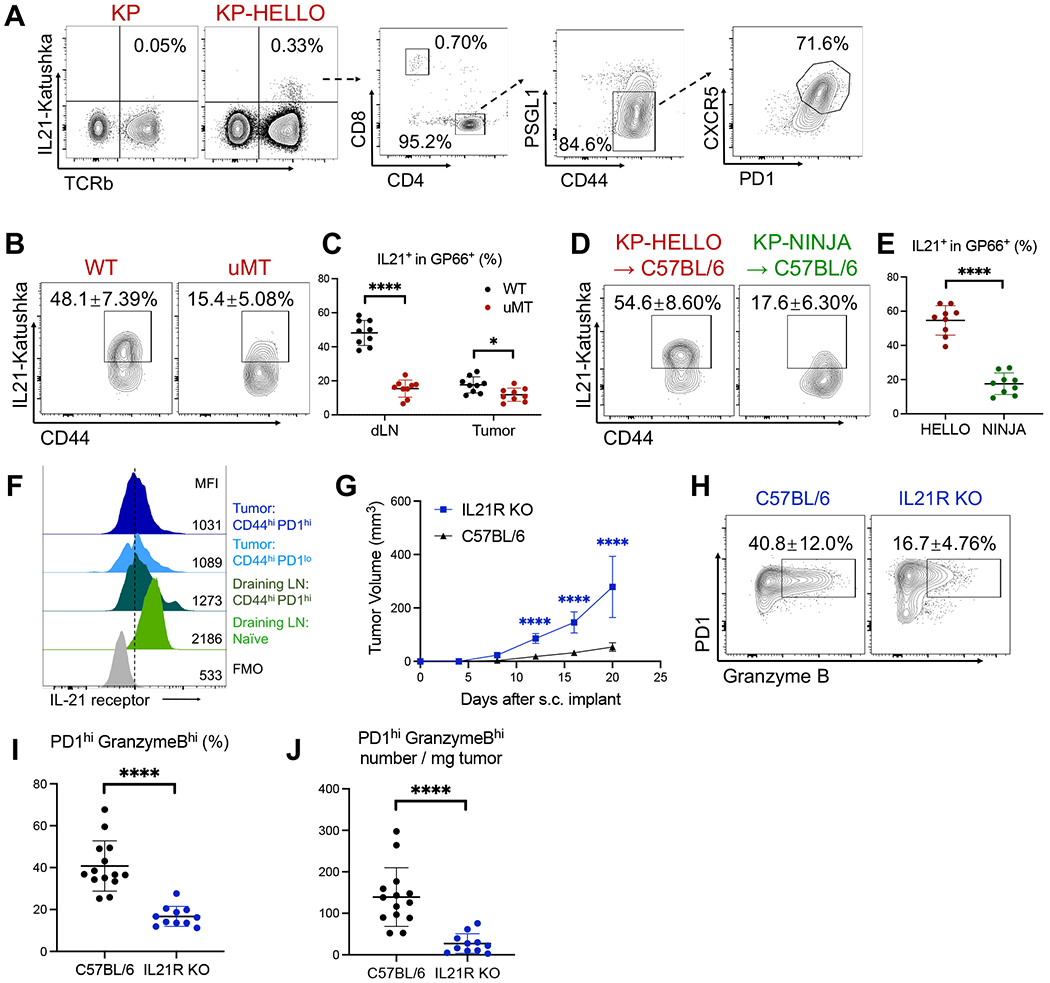
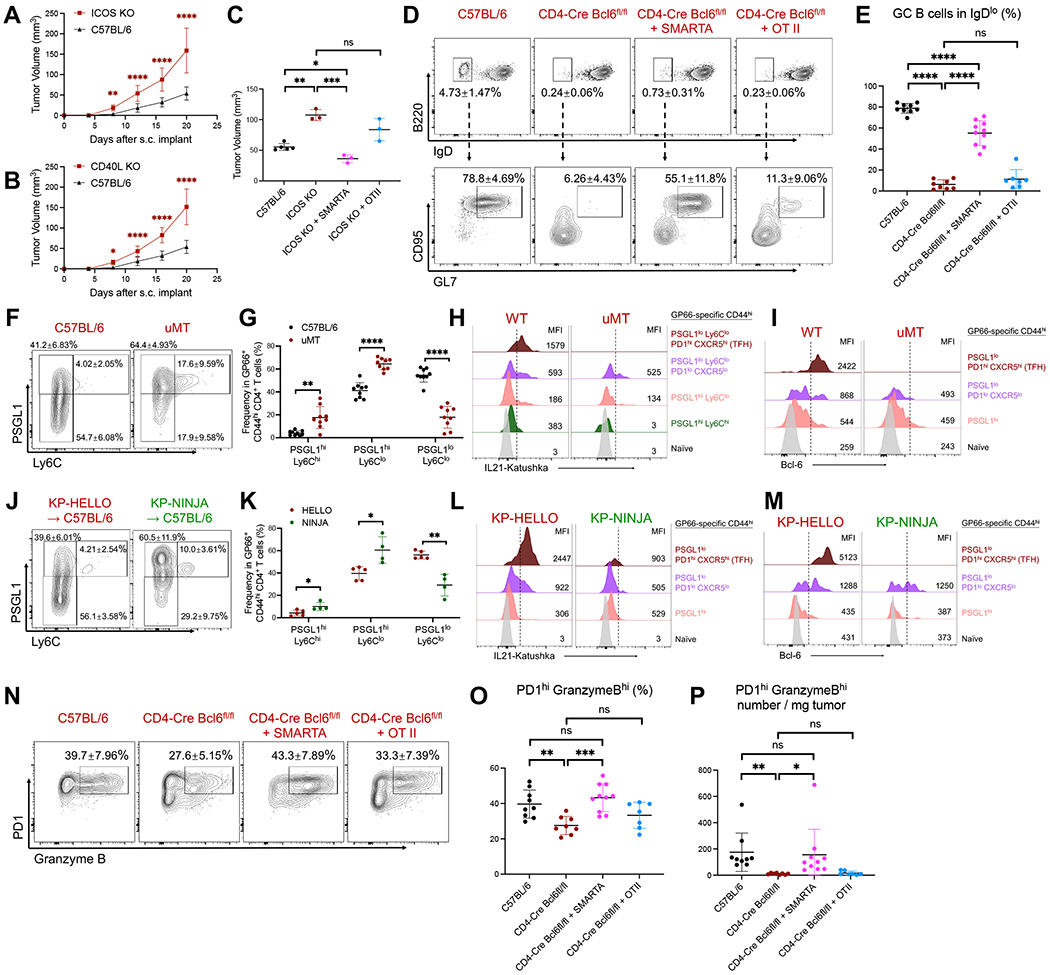
CD4 T follicular helper (TFH) cells support B cells, which are critical for germinal center (GC) formation, but the importance of TFH-B cell interactions in cancer is unclear. We found enrichment of TFH cell transcriptional signature correlates with GC B cell signature and with prolonged survival in individuals with lung adenocarcinoma (LUAD). We further developed a murine LUAD model in which tumor cells express B cell- and T cell-recognized neoantigens. Interactions between tumor-specific TFH and GC B cells, as well as interleukin (IL)-21 primarily produced by TFH cells, are necessary for tumor control and effector CD8 T cell function. Development of TFH cells requires B cells and B cell-recognized neoantigens. Thus, tumor neoantigens can regulate the fate of tumor-specific CD4 T cells by facilitating their interactions with tumor-specific B cells, which in turn promote anti-tumor immunity by enhancing CD8 T cell effector functions.

Keywords: B cell; CD8 T cell; IL-21; T follicular helper cell; lung cancer; neoantigen.


Conflict of interest statement

Declaration of interests The authors declare no competing interests.

Figures

Figure 1.
Figure 1.. GC B cells and TFH cells correlate with favorable clinical outcomes in LUAD patients
A, Estimated fractions of immune cell subsets from bulk expression data of primary tumor tissues in TCGA-LUAD patient cohort (n=513). CIBERSORT algorithm was used for deconvolution. B – E, scRNA-seq analyses (GSE131907, Kim et.al.) of T/NK and B cell clusters in treatment-naïve human LUAD samples from primary sites (tLung), metastatic LNs (mLN), normal lung tissues (nLung) and normal LNs (nLN). B – C, UMAP displaying T/NK (B) and B cell clusters (C). D – E, Bar graphs displaying tissue origins (top) and heatmaps (bottom) showing relative abundance of signature genes in CD4 T cell (D) and B cell clusters (E). F – G, Survival analyses based on GC B cell-signature (F) and TFH-signature (G) in TCGA-LUAD patient cohort (n=478). H, Correlation analyses on GC B cell-signature and TFH-signature in TCGA-LUAD cohort. I, Heatmap showing R values for the correlations among expression signatures of GC B cells, TFH, Th1, CD8 effector cells, Th17, NK cells in TCGA-LUAD cohort. F – G, log-rank Mantel-Cox test. H – I, two-tailed Pearson correlation test.
Figure 2.
Figure 2.. KP-HELLO tumor cells elicit tumor-specific CD4 T cell and B cell responses
A, KP-HELLO model design. B, CD86 expression (median fluorescence intensity, MFI) on MD4 or C57BL/6 B cells (CD19+ B220+ TCRb) after 48-hour co-culture with KP or KP-HELLO supernatant, or 500ng/mL HEL. C, CD44hi CD69hi frequency in SMARTA CD4 T cells, after 48-hour co-culture with MD4 or C57BL/6 B cells, and KP or KP-HELLO supernatant, 500ng/mL HEL or 5ug/mL GP61-80. D – E, Representative flow plots (D) and frequency (E) of polyclonal CD4 TFH cells from tumor-draining LNs (dLNs) of KP or KP-HELLO tumor-bearing C57BL/6 mice. F – G, Representative flow plots (F) and frequency (G) of I-Ab/GP66-77-specific (GP66-specific) CD4 TFH cells from dLNs of KP-NINJA or KP-HELLO tumor-bearing C57BL/6 mice. H – I, Representative flow plots (H) and frequency (I) of GC B cells from dLNs of KP-NINJA or KP-HELLO tumor-bearing C57BL/6 mice. No tumor C57BL/6 mice were used as negative controls. Data (mean ±SD) were pooled, from 2 – 5 mice/group/experiment, and representative of at least 2 independent experiments. LN tissues were harvested on day 10–12. B – C, E, G, I, unpaired t-test with Welch’s correction. *P < 0.05, **P < 0.01, ***P < 0.001, ****P < 0.0001.
Figure 3.
Figure 3.. CD4 T cells, TFH cells and B cells are necessary for optimal control over KP-HELLO tumors
A and C, Tumor growth curves: C57BL/6, CIITA KO or uMT mice were subcutaneously (s.c.) implanted with 2 x 10⁵ KP-HELLO. Growth curves of C57BL/6 (n = 40) and uMT (n = 32), pooled from 8 independent experiments, were set as the baseline of analyses. B, Tumor growth curves: C57BL/6 or CD4-Cre Bcl6fl/fl mice were s.c. implanted with 5 x 10⁵ KP-HELLO. D, Representative flow plots of GP66-specific CD4 TFH cells from dLNs of KP-HELLO tumor-bearing C57BL/6 or uMT mice. Flow cytometric analyses were performed on day 10 – 12 and quantified in Figure S5. Flow plots were pre-gated on TCRb+ CD4+ GP66-tetramer+ CD44hi PSGL1lo. E, Tumor growth curves: C57BL/6 or uMT mice were s.c. implanted with 5 x 10⁵ KP-NINJA. Each line represented one mouse. F, 1 x 10⁶ SWHEL or WT C57BL/6 B cells were adoptively transferred into uMT recipients, 1 day prior to KP-HELLO s.c. implant. Graph shows tumor volumes on day 16. G – I, 1 x 10⁵ SMARTA CD4 T cells (Thy1.1/Thy1.1) or OT-II CD4 T cells (Thy1.1/Thy1.2) were adoptively transferred into CD4-Cre Bcl6fl/fl recipients (Thy1.2/Thy1.2), 1 day prior to KP-HELLO s.c. implant. G, Tumor volumes on day 16 after s.c. implant. H – I, Representative flow plots (H) and frequency (I) of GP66-specific CD4 T cell subsets from dLNs of [CD4-Cre Bcl6fl/fl + SMARTA] group, separated by transferred SMARTA and endogenous cells. Flow plots were pre-gated on TCRb+ CD4+ GP66-tetramer+ CD44hi. Data (mean ±SD) were pooled, from 3–10 mice/group/experiment, and representative of at least 2 independent experiments. A – C and E, two-way ANOVA. F – G and I, unpaired t-test with Welch’s correction. *P < 0.05, **P < 0.01, ***P < 0.001, ****P < 0.0001.
Figure 4.
Figure 4.. TFH and B cells are critical to drive anti-tumor effector CD8 T cell responses
A, Control and anti-CD8a treated C57BL/6 mice were s.c. implanted with 2 x 10⁵ KP-HELLO. Growth curve of C57BL/6 (n = 40), pooled from 8 independent experiments, was set as the baseline of analyses. B, Representative flow plots of tumor-infiltrating PD1hi Granzyme Bhi CD8 T cells from KP-HELLO tumors in C57BL/6 or CD4-Cre Bcl6fl/fl mice, further quantified in Figure 6O–6P. C – E, Representative flow plots (C), frequency (D) and number/mg tumor (E) of tumor-infiltrating PD1hi Granzyme Bhi CD8 T cells from KP-HELLO tumors in C57BL/6 or uMT mice. F – H, Representative flow plots (F), frequency (G) and number/mg tumor (H) of tumor-infiltrating PD1hi Granzyme Bhi CD8 T cells from KP-NINJA tumors in C57BL/6 or uMT mice. Data (mean ±SD) were pooled, from 3–5 mice/group/experiment, and representative of at least 2 independent experiments. Tumors were harvested on day 15–16. A, two-way ANOVA. D – E and G – H, unpaired t-test with Welch’s correction. *P < 0.05, **P < 0.01, ***P < 0.001, ****P < 0.0001.
Figure 5.
Figure 5.. IL-21 production is dependent on B cells and B-cell-recognized neoantigens and is required for effector CD8 T cell responses
A, Representative flow plots showing IL-21-producing cells in dLNs of KP or KP-HELLO tumor-bearing mice. B – C, Representative flow plots (B) and frequency (C) of IL-21 producers in GP66-specific CD44hi CD4 T cells from dLNs and tumors of KP-HELLO tumor-bearing WT or uMT mice. D – E, Representative flow plots (D) and frequency (E) of IL-21 producers in GP66-specific CD44hi CD4 T cells from dLNs of KP-HELLO or KP-NINJA tumor-bearing WT mice F, IL-21 receptor expression on CD8 T cell subsets from dLNs and tumors of KP-HELLO tumor-bearing mice. Gate was drawn based on FMO in CD44hi PD1hi tumor-infiltrating CD8 T cells. G, Tumor growth curves: C57BL/6 and IL21R KO mice were s.c. implanted with 2 x 10⁵ KP-HELLO. Growth curve of C57BL/6 (n = 40), pooled from 8 independent experiments, was set as the baseline of analyses. H – J, Representative flow plots (H), frequency (I) and number/mg tumor (J) of tumor-infiltrating PD1hi Granzyme Bhi CD8 T cells from KP-HELLO tumors in C57BL/6 or IL21R KO mice. Data (mean ±SD) were pooled, from 3–10 mice/group/experiment, and representative of at least 2 independent experiments. C, E, and I – J, unpaired t-test with Welch’s correction. G, two-way ANOVA. *P < 0.05, **P < 0.01, ***P < 0.001, ****P < 0.0001.
Figure 6.
Figure 6.. Collaborations between CD4 T cells and B cells are critical for anti-tumor immune responses
A – B, Tumor growth curves: C57BL/6, ICOS KO or CD40L KO mice were s.c. implanted with 2 x 10⁵ KP-HELLO. Growth curve of C57BL/6 (n = 40), pooled from 8 independent experiments, was set as the baseline of analyses. C, 1 x 10⁵ SMARTA CD4 T cells or OT-II CD4 T cells were adoptively transferred to ICOS KO recipients prior to KP-HELLO s.c. implant. Graph shows tumor volumes on day 16. D – E, Representative flow plots (D) and frequency (E) of GC B cells in dLNs of KP-HELLO tumors in C57BL/6, CD4-Cre Bcl6fl/fl mice, or CD4-Cre Bcl6fl/fl recipients following transfer of 1 x 10⁵ SMARTA T cells or OT-II T cells (as described in Figure 3G). F – G, Representative flow plots (F) and frequency (G) of GP66-specific CD4 T cell subsets from dLNs of KP-HELLO tumor-bearing WT or uMT mice. J – K, Representative flow plots (J) and frequency (K) of GP66-specific CD4 T cell subsets from dLNs of KP-HELLO or KP-NINJA tumor-bearing WT mice. H – I and L – M, Histograms displaying IL-21 or Bcl-6 expression on naïve and GP66-specific CD4 T cell subsets. Gating strategy was shown in Figure 3D, 6F and 6J. N – P, Representative flow plots (N), frequency (O) and number/mg tumor (P) of tumor-infiltrating PD1hi Granzyme Bhi CD8 T cells from KP-HELLO tumors in C57BL/6, CD4-Cre Bcl6fl/fl mice, or CD4-Cre Bcl6fl/fl recipients following transfer of 1 x 10⁵ SMARTA T cells or OT-II T cells (as described in Figure 3G). Data (mean ±SD) were pooled, from 3–5 mice/group/experiment, and representative of at least 2 independent experiments. A – B, two-way ANOVA. C, E, G, K and O – P, unpaired t-test with Welch’s correction. *P < 0.05, **P < 0.01, ***P < 0.001, ****P < 0.0001.

References

    1. Akama-Garren EH, Joshi NS, Tammela T, Chang GP, Wagner BL, Lee DY, Rideout WM 3rd, Papagiannakopoulos T, Xue W, and Jacks T (2016). A Modular Assembly Platform for Rapid Generation of DNA Constructs. Sci Rep 6, 16836. 10.1038/srep16836. - DOI - PMC - PubMed
    1. Alspach E, Lussier DM, Miceli AP, Kizhvatov I, DuPage M, Luoma AM, Meng W, Lichti CF, Esaulova E, Vomund AN, et al. (2019). MHC-II neoantigens shape tumour immunity and response to immunotherapy. Nature 574, 696–701. 10.1038/s41586-019-1671-8. - DOI - PMC - PubMed
    1. Alvarez Arias DA, Kim HJ, Zhou P, Holderried TA, Wang X, Dranoff G, and Cantor H (2014). Disruption of CD8+ Treg activity results in expansion of T follicular helper cells and enhanced antitumor immunity. Cancer Immunol Res 2, 207–216. 10.1158/2326-6066.CIR-13-0121. - DOI - PMC - PubMed
    1. Battegay M, Moskophidis D, Rahemtulla A, Hengartner H, Mak TW, and Zinkernagel RM (1994). Enhanced establishment of a virus carrier state in adult CD4+ T-cell-deficient mice. J Virol 68, 4700–4704. - PMC - PubMed
    1. Bindea G, Mlecnik B, Tosolini M, Kirilovsky A, Waldner M, Obenauf AC, Angell H, Fredriksen T, Lafontaine L, Berger A, et al. (2013). Spatiotemporal dynamics of intratumoral immune cells reveal the immune landscape in human cancer. Immunity 39, 782–795. 10.1016/j.immuni.2013.10.003. - DOI - PubMed

Publication types