. 2021 Dec 9;184(25):6037-6051.e14.
doi: 10.1016/j.cell.2021.11.023. Epub 2021 Nov 18.

A defective viral genome strategy elicits broad protective immunity against respiratory viruses

Affiliations

A defective viral genome strategy elicits broad protective immunity against respiratory viruses

Yinghong Xiao et al. Cell. .

Abstract

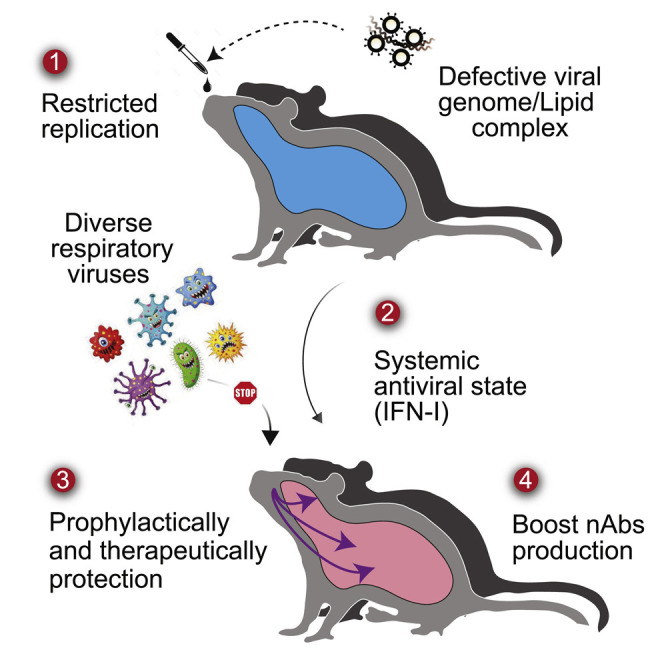
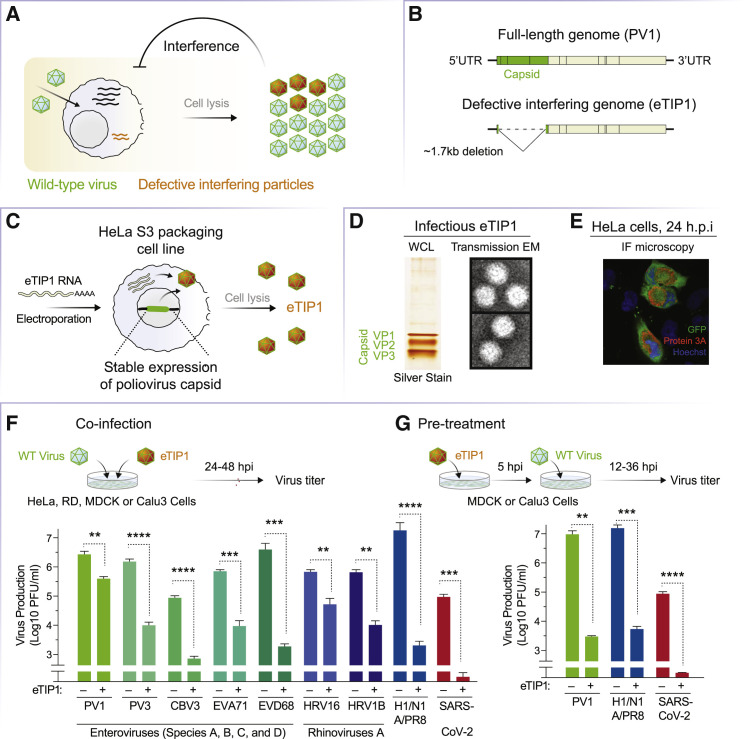
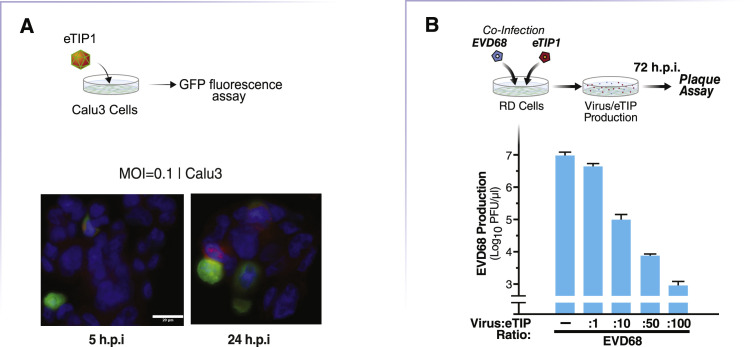
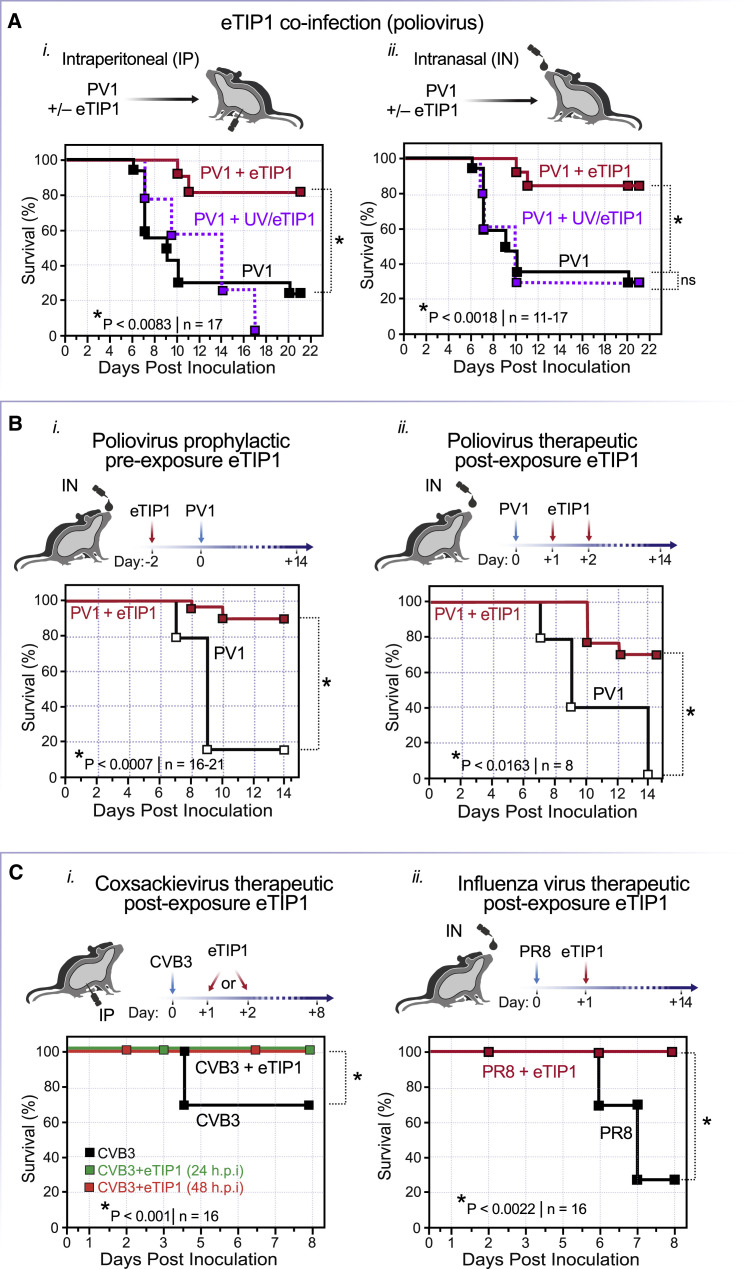
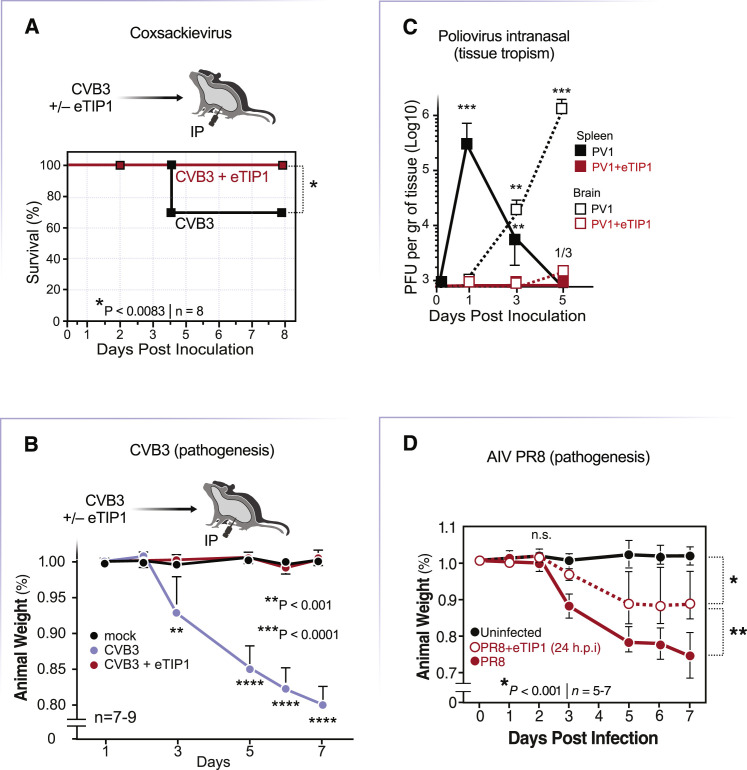
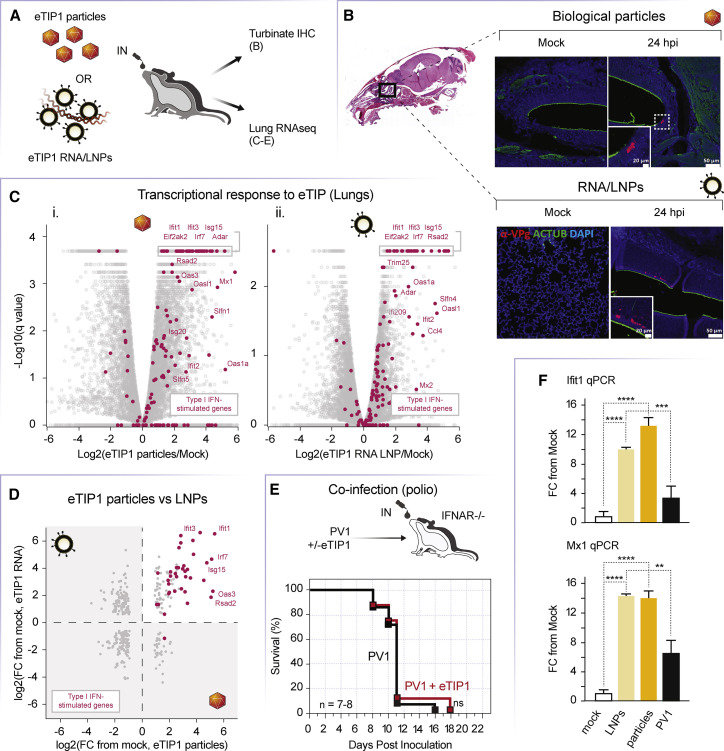
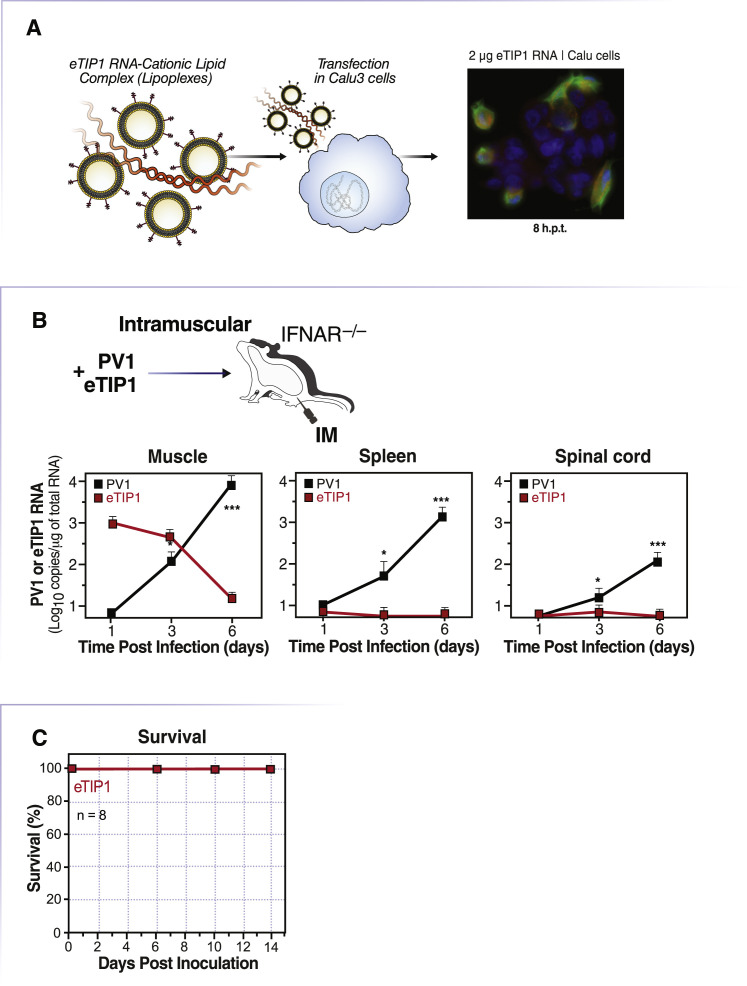
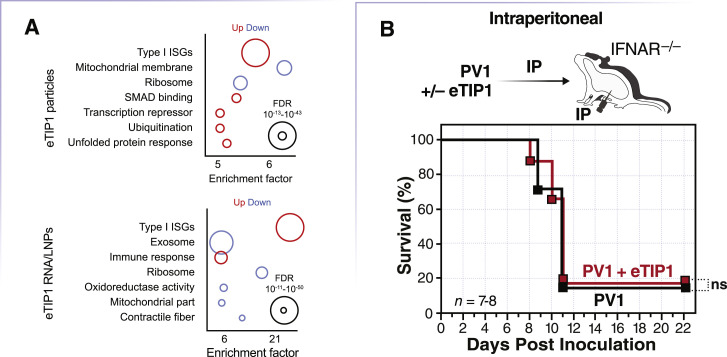
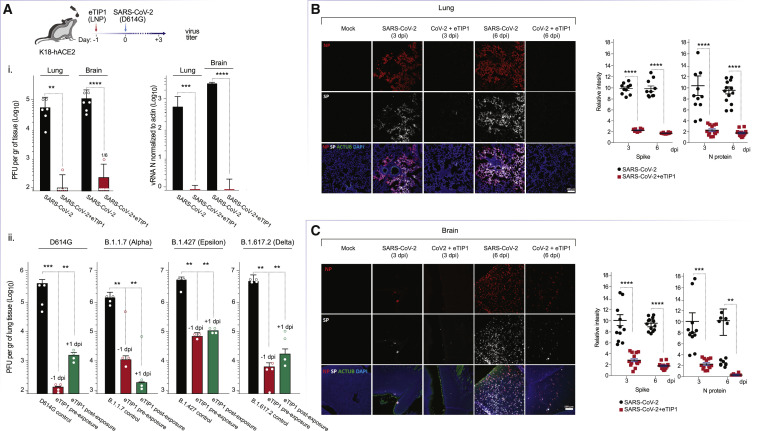
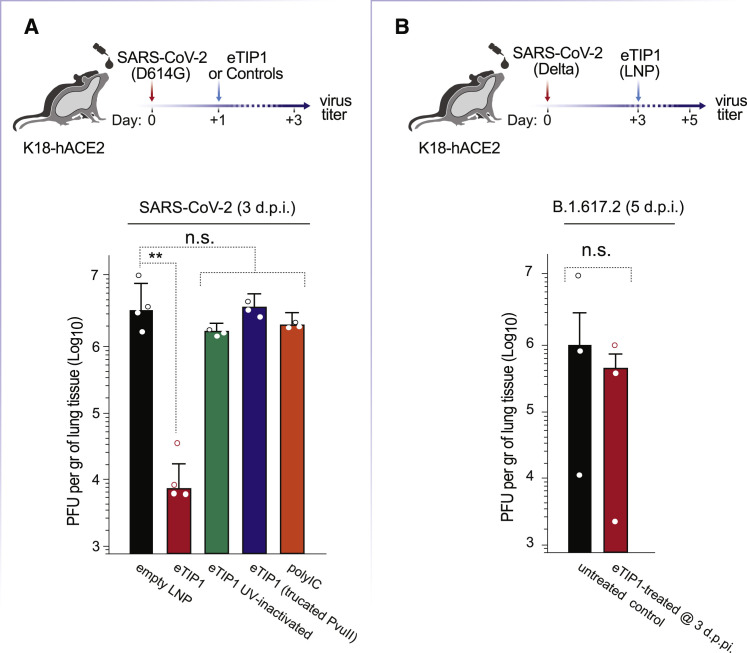
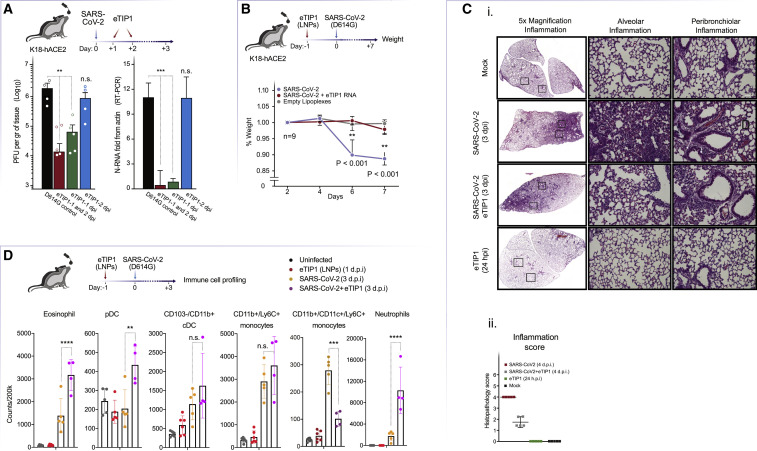
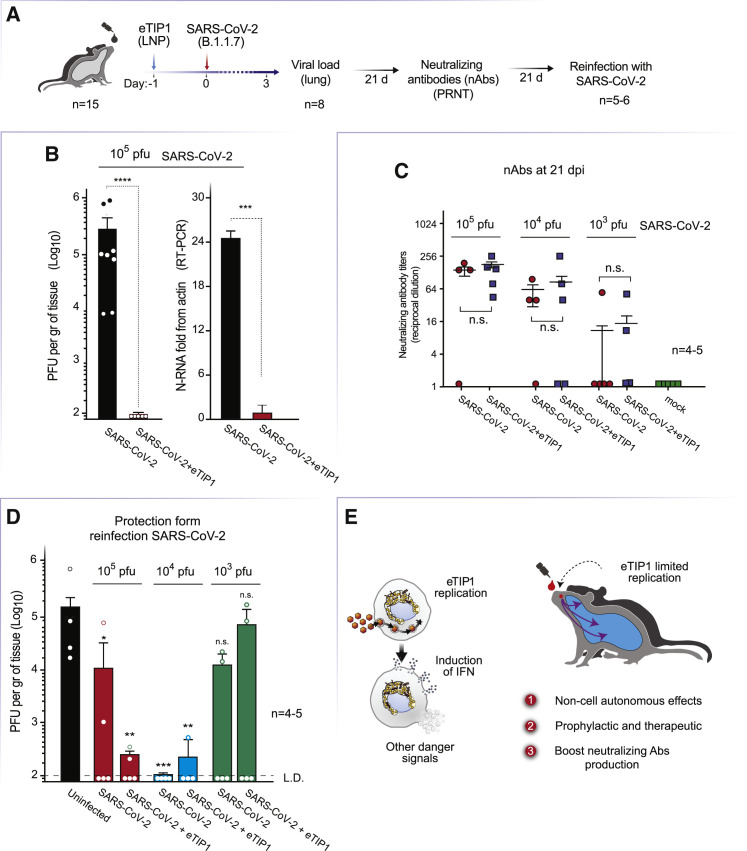
RNA viruses generate defective viral genomes (DVGs) that can interfere with replication of the parental wild-type virus. To examine their therapeutic potential, we created a DVG by deleting the capsid-coding region of poliovirus. Strikingly, intraperitoneal or intranasal administration of this genome, which we termed eTIP1, elicits an antiviral response, inhibits replication, and protects mice from several RNA viruses, including enteroviruses, influenza, and SARS-CoV-2. While eTIP1 replication following intranasal administration is limited to the nasal cavity, its antiviral action extends non-cell-autonomously to the lungs. eTIP1 broad-spectrum antiviral effects are mediated by both local and distal type I interferon responses. Importantly, while a single eTIP1 dose protects animals from SARS-CoV-2 infection, it also stimulates production of SARS-CoV-2 neutralizing antibodies that afford long-lasting protection from SARS-CoV-2 reinfection. Thus, eTIP1 is a safe and effective broad-spectrum antiviral generating short- and long-term protection against SARS-CoV-2 and other respiratory infections in animal models.

Keywords: RNA viruses; SARS-CoV-2; antiviral; broad-spectrum; defective viral genomes; innate immunity; interferon; respiratory infection.


Conflict of interest statement

Declaration of interests Y.X., R.N., and R. Andino have submitted a patent application. Provisional patent application: recombinant enteroviruses and uses thereof. eTIP1. US Provisional Patent Filed 7/2020. The application was accorded serial no. 63/047,398. D.T. and R.N. are shareholders and employees of Aleph Therapeutics, Inc. E.B. is a shareholder and employee of Pine Biotech Inc.

Figures

None
Graphical abstract
Figure 1
Figure 1
An engineered defective interfering particle derived from PV confers broad-spectrum antiviral protection in cell-culture models (A) During replication, RNA virus produces defective viral genomes (DVGs) that attenuate parental virus replication and pathogenesis. (B) Schematic representation of the WT PV1 and the engineered DVG genome, herein called eTIP1. The structural genes (capsid, green) encode viral capsid proteins, and the non-structural coding region (yellow) encodes the enzymatic machinery required for replication. eTIP1 carries a large deletion of ∼1,700 bases in the capsid proteins of PV1 virus, and GFP-Venus gene was inserted at the N terminus of the engineered viral polyprotein. (C) Production of eTIP1 particles. In-vitro transcribed RNA was transfected into a packaging cell line that expresses the precursor for poliovirus capsid proteins (HelaS3/P1). eTIP1s were passaged three times in HeLaS3/P1 cells to generate higher titer eTIP1 stocks (∼107 infectious units/mL). (D) eTIP1 were purified by sucrose gradient and examined by SDS-polyacrylamide gel electrophoresis with silver staining and electron microscopy and negative staining. (E) eTIP1 replication in cell culture. HeLa cells were infected with eTIP1 at an moi = 1, and 24 h post-infection, HelaS3 cells were fixed and analyzed by immunostaining with antibodies to polio-3A antibody (red) and GFP (green), and DAPI (blue). (F) eTIP1 inhibits a wide range of enterovirus sub-species in cell culture (e.g., PV1 and 3, coxsackievirus B3 (CVB3), enterovirus A71 (EV-A71), enterovirus D68 (EV-D86), rhinovirus 16 (HRV16), rhinovirus 1A (HRV1A), influenza virus A virus (H1/N1, A/PR8), and SARS-CoV-2. (G) eTIP1 inhibits replication PV1, A/PR8, SARS-CoV-2. Cells were pretreated with eTIP1 with moi = 5 for 5 h, and then cells were infected with PV1, H1/N1 A/PR8, SARS-CoV-2 at moi = 0.1. Significance was calculated using a two-tailed Student’s t test. ∗∗p < 0.01; ∗∗∗p < 0.001; and ∗∗∗∗p < 0.0001.
Figure S1
Figure S1
Replication of eTIP1 and doses-dependent effect on EV-D68 replication, related to Figure 1 (A) Immunofluorescence(IF) for eTIP1 particles on infected lung cell type, Calu-3 cells at moi = 0.1. At 5 and 24 h post-infection, cells were fixed with 4% PFA and the IF were performed with polio-3A antibody (red color) (STAR Methods). (B) eTIP1 was to infect RD cells at different multiplicity of infection (moi) ranging from 10 to 0.1, and coinfected with EV-D68 eTIP1 (moi = 0.1). eTIP1 inhibits replication on EV-D68, implicated in outbreaks of severe respiratory illness in the US in a dose-dependent manner.
Figure 2
Figure 2
eTIP1 protects against poliovirus (PV1), coxsackievirus B3 (CVB3), and influenza virus (H1/N1, A/PR8) in mouse models of infection (A) (i) IP inoculation in immune-competent C57BL6 TgPVR mice with 107 pfu poliovirus (PV1) or co-infected eTIP1 at a ratio of 1:10. As a control, PV1 was co- inoculated with UV-inactivated eTIP1 (UV/eTIP1). Black line represents PV1 alone. Red line represents co-infected mixed PV1+ eTIP1 group. Purple line represents co-infected mixed PV1 with UV/eTIP1. (ii) IN inoculation. C57BL6 TgPVR mice were infected with 3 × 105 pfu PV1 IN or co-infected eTIP1 or UV/eTIP1, at ratio 1:20. Color code as in (i). p < 0.001. (B) Pre-exposure and post-exposure prophylaxis. (i) eTIP1 (6 × 106 IU) was inoculated into C57BL6 TgPVR mice intranasally, and 48 h later mice were challenged with 3 × 105 pfu of pathogenic PV1. (ii) C57BL6 mice were infected with 3 × 105 pfu PV1 C57BL6, and 1 and 2 days post-infection animals were treated IN with 6 × 106 IU eTIP1. n = 16–21. (C) (i) Post-exposure effects of eTIP1 treatment on coxsackievirus. C57BL6 mice were infected with 105 pfu CVB3 by the IP route (black line), and at 24 (green line) or 48 h (red line), animals were IP inoculated with 107 IU eTIP1 (n = 7–9). (ii) Therapeutic effects of eTIP1 on influenza virus. C57BL6 mice were infected with 105 pfu influenza A/PR8 IN, and then 6 × 106 IU eTIP1 were inoculated IN at 24 h post-infection (n = 16). In (A), (B), (F), and (E), the statistical analysis of survival curves was performed by log-rank (Mantel-Cox) test. Significance is noted with asterisks; ns, not significant.
Figure S2
Figure S2
eTIP1 protects respiratory tract and enterovirus infection and protect from disease cause by coxsackievirus B3, poliovirus and influenza virus (AIV), related to Figure 2. (A) Intraperitoneal inoculation in immune-competent C57BL6 TgPVR mice with 105 P.F.U. coxsackievirus B3 (CVB3) or co-infected eTIP1 at a ratio of 1:100(n = 7-9). Survival curve. Black line represents CVB3 alone. Red line are mice infected with a mix of CVB3 + eTIP1 group. The statistical analysis of survival curves was carried out by log-rank (Mantel-Cox) test. Significance is noted with asterisks; ns, not significant. (B) Weight lost, experiment was carried out as in Fig.S2A. blue line represents CVB3 alone, red line are mice infected with a mix of CVB3 + eTIP1 group, black line represents mock(un-infected) control. (C) Virus loads in spleen and brain tissues of PV1-infected (black) or PV1 + eTIP1 co-infected intranasally (IN) at a ratio of 1:20. Tissues were collected at indicated times, homogenized and tittered by plaque assay. n = 3-5. Data was analyzed using unpaired Student’s t tests. Significance is noted with asterisks as follow: ∗∗p < 0.001; and ∗∗∗p < 0.0001. Two independent experiments. (D) Weight lost, red solid line represents influenza virus (PR8) alone, red dotted line are mice infected with a mix of PR8 + eTIP1 group, black line represents mock(un-infected) control(n = 5-7).. Significance is noted with asterisks as follow: p < 0.05, ∗∗p < 0.001; and ∗∗∗p < 0.0001. Two independent experiments.
Figure 3
Figure 3
eTIP1 protects against PV through a type I IFN response (A) Schematic representation of the eTIP1 biological particles and eTIP1 RNA complex with LNPs. Animals were analyzed 24 h after IN intranasal inoculation by immune histochemistry (IHC) or by RNA-seq transcriptome profiling of the lung gene expression. (B) eTIP1 site of replication within the respiratory tract. Mice were inoculated IN with 30 μg of eTIP1 RNA or mock (PBS with empty LNPs) or infected with 6 × 106 infectious units of eTIP1. Heads of inoculated animals were analyzed 24 h post-inoculation by IHC. Heads and lungs were collected and fixed in 4% paraformaldehyde (PFA), embedded in paraffin wax, and cut into 5-μm sections. eTIP1s and eTIP1 RNA were stained using PV antibody VPg (3B protein). VPg (3B) (red), ACTUB (green), nuclear (blue). eTIP1 replication was restricted to the upper respiratory nasal cavity. We observed no replication in the lungs. (C) C57BL6 TgPVR mice were infected with 6 × 106 IU eTIP1 particles or PBS (mock) (i), or animals were inoculated IN with 30 μg eTIP1 LNP or mock (empty LNP). Lung tissues were collected 24 (eTIP1 LNP) or 48 h (eTIP1 particles) post-inoculation, and mRNA was isolated from these tissues and examined by RNA-seq. Volcano plot shows pairwise comparisons of mRNA levels in infected versus mock-infected lung tissues and represented as a volcano plot of the genes with significant changes in expression, compared to the mock-treated group (false discovery rate, q-value < 0.05). n = 3 on two experimental replicates. (D) Pairwise comparison of eTIP1 RNA/LNP versus eTIP1 particle in lung of infected animal. Red dots represent type I IFN genes. (E) eTIP1 fails to protect against PV1 (IN in mice lacking IFNAR−/−. IFNAR−/− mice were infected with 5 × 104 pfu PV1 alone or co-infected with mixed PV1 + eTIP1 at a ratio of 1:20 by IN route. Black line represents PV1 alone. Red dash line represents co-infected mixed PV1+ eTIP1 group (n = 7-10). Data were collected from two independent experiments. The comparison of survival curves was performed by log-rank (Mantel-Cox) test. ns, not significant. (F) RT-qPCR validation of upregulated genes in lungs of animals treated with eTIP1. K18-hACE2 mice were transfected with 30 μg of eTIP1 RNA or infected with 6 × 106 IU of eTIP1 particles or PV1. As control, we mock-infected animals (PBS with empty LNPs, lipofectamine 2000) for 24 h. Lungs were collected, and total RNA was extracted with Trizol reagents. RT-qPCR were performed to qualify the IFN-induced genes MX1 and ISG56 (IFIT1), n = 3, normalized to GAPDH. Unpaired Student’s t tests. p < 0.05; ∗∗p < 0.01; ∗∗∗p < 0.001.
Figure S3
Figure S3
Delivery of eTIP1 using lipid nanoparticles (LNPs) and safety characterization of eTIP1 inoculated intramuscularly in highly susceptible mice, related to Figure 3 (A) eTIP1 RNA transfection and expression. Schematic representation of eTIP1 RNA/LNP complex. eTIP1 RNA expression in cell culture model. 2ug eTIP1 RNAs were transfected into HelaS3 cells with lipofectamine 2000, then immunofluorescence (IF) staining with the poliovirus −3A antibody at 8 h post-transfection. Poliovirus 3A protein staining (Red), eTIP1 RNA(green), the nuclear(blue). (B) eTIP1 replication is restricted to the site of inoculation (leg muscle) even in the presence of WT polio helped virus. 6 to 8-weeks-old C57BL6 PVR interferon α/β receptor knockout (IFNAR−/−) mice were infected with 200 P.F.U. wildtype poliovirus or co- infected with mixed PV1+ eTIP1 at ratio 1:5000 by intramuscular (I.M.) route. eTIP1 inhibits wildtype virus spread into central neuron system (CNS). However, eTIP1 replication is limited to the site of inoculation (muscle) but not spread and replicates in spleen and spinal cord. RNA genome copies for eTIP1 and PV1 by digital droplet RT-qPCR. y axis represents RNA genome copies per 1 mg total RNA. Black line with square represents as PV1 genome copies in wildtype virus alone group. Red line with square represents as PV1 genome copies in co-infection group. (n = 3). Two tails multiple-t tests. Significance is noted with asterisks as follow: p < 0.05; and ∗∗∗p < 0.001. (C) Survival curves of mice inoculated intramuscularly with eTIP1. 6 to 8-weeks-old C57BL6 PVR interferon α/β receptor knockout (IFNAR−/−) mice were infected with 2 × 105 P.F.U of encapsidated biological particles eTIP1.
Figure S4
Figure S4
RNA-seq analysis of mice treated with eTIP1/LNP and the role of Type I IFN, related to Figure 3 (A) Gene Ontology (GO) annotations with manual validation were used to calculate an average fold change from mock for all host mRNA induced during eTIP1 inoculation. ANOVA p value indicated for each. (B) eTIP1 fails to protect against poliovirus (PV1) intraperitoneally (IP) in mice lacking a type I interferon response (IFNAR−/−). IFNAR−/− mice were infected with 5x10⁴ pfu PV1 alone or co-infected with mixed PV1 + eTIP1 at a ratio of 1:10 by IP route. Black line represents PV1 alone. Red dash line represents co-infected mixed PV1+ eTIP1 group (n = 7-8). Data presented was collected from two independent experiments. The comparison of survival curves was performed by log-rank (Mantel-Cox) test. ns, not significant.
Figure 4
Figure 4
eTIP1 RNAs inhibit SARS-CoV-2 replication in infected mice (A) Schematic representation of experimental design. (i) 30 μg of eTIP1 RNA/LNP or mock (empty LNP) were delivered into K18-hACE2 mice IN, and 20 h later, K18-hACE2 mice were challenged by IN inoculation 104 pfu SARS-CoV-2. Tissues (lung and brain) were collected at 3 days post-infection and homogenized, and supernatants were tittered by plaque assay in Vero-E6 cells. Total RNA was extracted and quantified by RT-qPCR with primers target to nucleocapsid (N) gene of SARS-CoV-2, normalized to GAPDH (n = 6). Unpaired Student’s t tests. (ii) Prophylactic and therapeutic effects of eTIP1on SARS-CoV-2 variants of concerns or variants of interest (VOCs or VOIs). eTIP1 RNA/LNP was inoculated into K18-hACE2 mice by the IN route, and at 20 h post-infection, mice were infected with 104 pfu SARS-CoV-2 variants (D614G, B.1.1.7 [Alpha], B.1.427 [Epsilon], or B.1.617.2 [Delta]) by IN route (n = 4–5). Virus titers in lugs were determined by plaque assays. (B and C) IHC staining for SARS-CoV-2 in lung (B) and brain (C) of infected animals. Lung and brain tissues were collected at days 3 and 6 post-infection, fixed in 4% PFA, embedded in paraffin wax, and cut into 5-μm sections. Slides were stained with antibodies that recognized SARS-CoV-2 NP (red) and spike proteins (SPs, gray). ACTUB (green), nuclear (DAPI, blue). Expression levels of SPs and NPs were qualified by Fuji/ImageJ with mean intensity and normalized to the SARS-CoV-2-infected group. For each image, we selected at least 10 areas at same places in the different groups. Unpaired Student’s t tests, p values for each comparison. ∗∗p < 0.01; ∗∗∗p < 0.001; and ∗∗∗p < 0.001.
Figure S5
Figure S5
Only replication-competent eTIP1 protects against SARS-CoV-2, delivery of none-replicative RNA in LNP complex are not effective, related to Figures 4 and 5 (A) eTIP1 RNA/LNP and controls, e.g., UV-inactivated eTIP1 RNA, replication incompetent eTIP1 with a large deletion (∼2kbps) of the most-3′ region of the eTIP1 genome, or poly IC, were inoculated into K18-hACE2 mice by the intranasal route, and at 24 h mice were infected with 104 P.F.U. SARS-CoV-2 D614G, B by IN route (n = 4-5). Virus titers in lugs were determined by plaque assays 3 days after infection. (B) K18-hACE2 mice were infected by the intranasal route with 104 P.F.U. SARS-CoV-2 Delta variant by IN route (n = 4-5). Mice were inoculated with eTIP1 RNA/LNP (30 μg) or mock (empty LNPs) 72 h post-infection. Virus titers in lungs at 5 days post infection were determined by plaque assays. Direct animal observation suggested that eTIP1 inoculation during ongoing infection did not enhance signs of disease stress or augmented lethality of SARS-CoV-2.
Figure 5
Figure 5
eTIP1 reduces the symptoms and lung damage of COVID-19 disease in infected mice by recruiting a specific set of immune cells (A) Therapeutic window of eTIP1on SARS-CoV-2. K18-hACE2 mice were infected by the IN route with 104 pfu SARS-CoV-2 variants by IN route (n = 4–5). Mice were inoculated with eTIP1 RNA/LNP (30 μg) or mock (empty LNPs) at 24, 48, or 24- and 48-h post-infection. Virus titers in lungs at 3 days post-infection were determined by plaque assays. (B) Pathogenesis, weight lost in SARS-CoV2-infected animals. Mice were treated with 30 μg of eTIP1 RNA/LNP or mock (empty LNPs) by intranasal inoculation IN, and 20 h later, K18-hACE2 mice were challenged with 104 pfu SARS-CoV-2. Weight changes were normalized to the initial weight for each mouse (n = 9 for each condition in two independent experiments). After animals lost 15% of their body weight, they were humanely euthanized. (C) Lung tissues were collected at days 3 post-infection, fixed in 4% PFA, embedded in paraffin wax, and cut into 5-μm sections. Sections of lung from K18 hACE2 mice were H&E stained. Sections were evaluated for comprehensive histological changes and inflammation progression (STAR Methods). (D) Immune cell profiling (flow cytometry) of lung of mice inoculated IN with eTIP1 RNA/LNPs (30 μg), SARS-CoV-2 infected, eTIP1 RNA/LNPs treated + SARS-CoV-2 infected or mock (empty LNPs, uninfected). Data are the number of CD45+ specific immune cells per 200,000 total cells obtained from mouse lungs (n = 3–6). Data are from two independent experiments. Unpaired Student’s t tests. p < 0.05; ∗∗p < 0.01. n.s., not significant.
Figure S6
Figure S6
Gating of the flowcytometry to identify subset immune cells from the lung of eTIP1 inoculated mice, related to Figure 5 (A) Mice were perfused with PBS, lungs were collected, dissociated, red cells were lysed, single cells from each lung were obtained. Cells were counted, stainned with a flow cytometry antibody panels. Cell were then fixed with 1% PFA overnight, then washed two times with DPBS. Samples resuspend in FACS buffer and analyzed FACS machine. 200K events were collected from each sample. Data were analyzed by flowjo by sequential gating. For the first antibody panel (Myeloid Cells), from single and live cells: CD45+ cells represent as immune-cells. CD45+/SiglecF+ is eosinophils (EOS). CD45+/ SiglecF+/CD11C+ is alveolar macrophage (AM CD45+/ SiglecF-/CD317+/CD45R+ is pDC. CD45+/ SiglecF-/ CD45R- / LY6G+ is neutrophils(Neut),). CD45+/ SiglecF-/ CD45R-/ LY6G-/ LY6C+/ MHC2- is LY6C+ positive monocytes (LY6C+ Mono), CD45+/ SiglecF-/ CD45R-/ LY6G-/ LY6C+/ MHC2-/CD11b+ is LY6C+ CD11b+ positive monocytes (LY6C+ CD11b+ Mono), CD45+/ SiglecF-/ CD45R-/ LY6G-/ LY6C+/ MHC2-/CD11b+ + /CD11C+is LY6C+ CD11b+ CD11C+positive monocytes (LY6C+ CD11b+ CD11C+Mono), CD45+/ SiglecF-/ CD45R-/ LY6G-/ LY6C+/ MHC2-/CD11b+ + /CD11C+is LY6C+ CD11b + CD11C-positive monocytes (LY6C+ CD11b+ CD11C-Mono). CD45+/ SiglecF-/ CD45R-/ LY6G-/ LY6C+/ MHC2+ CD11 is MHC2+ CD11+ dentritic cells(DCs), CD45+/ SiglecF-/ CD45R-/ LY6G-/ LY6C+/ MHC2+ CD11/CD103+/Cd11b+ is LY6C+/ MHC2+ CD11/CD103+/Cd11b dentritic cells(DCs). For the 2nd antibody panel(Lymphocytes Cell gating), from single and live cells: CD45+ cells represent as immune-cells. NK1.1+ positive cells is NK cells. NK1.1- /CD19+ cells is B cells, . NK1.1- /CD19-/gd TCR+ cells is Gammadelta TCR cells, NK1.1- /CD19-/gd TCR-/CD3+/ CD4+/ is CD4+ T cells, NK1.1- /CD19-/gd TCR-/CD3+/ CD8+/ is CD8+ T cells Then cells numbers were calculated, data represented as cell counts group. Unpaired Student’s t tests. p < 0.05 as significant. ∗∗p < 0.01, ∗∗∗p < 0.001. ns, no significant. (B) Immune cell profiling (flow cytometry) of lung of mice infected intranasally with eTIP1 RNA/LNPs or mock infected. Data are represented as the number of CD45+ specific immune cells per 200,000 total cells obtained from mouse lungs (n = 3-6). Data are from two independent experiments. Unpaired Student’s t tests. Significance is noted with asterisks as follow: n.s., not significant.
Figure 6
Figure 6
eTIP1 inhibits SARS-CoV-2 replication but enables the generation of neutralizing antibodies that fully protect animals from re-challenge (A) Schematic representation of experimental design. C57BL6 mice were inoculated IN with 30 μg of eTIP1 RNA/LNP or mock inoculated (empty LNP). At 24 h after eTIP1 inoculation, mice were infected by the IN route with 105, 104, or 103 pfu of SARS-CoV-2 (B.1.1.7). (B) Lung tissues were collected at 3 days post-infection and homogenized, and supernatants were tittered by plaque assay in Vero-TMPRSS2 cells. Only maximal dose 105 pfu is represented in the figure. Unpaired Student’s t test was used for statistical analysis. ∗∗∗∗p < 0.0001. (C) At 21 days post-SARS-CoV-2 infection, mice were bled, and neutralizing antibody titers (reciprocal dilution) determined by plaque-reduction neutralizing test (PRNT). Unpaired Student’s t tests. n.s., not significant. (D) Re-infection with SARS-CoV-2. Animals that were infected with 105, 104, or 103 pfu of SARS-CoV-2 and recuperate or treated with eTIP1 and infected with SARS-CoV-2 (see B) were re-challenged by IN inoculation with 105 pfu of SARS-CoV-2 (B.1.1.7). Lung tissues were collected at 3 days post-infection and homogenized, and supernatants were tittered by plaque assay in Vero-TMPRSS2 cells. Unpaired Student’s t test was used for statistical analysis. p < 0.03; ∗∗p < 0.005; ∗∗∗p < 0.0001. L.D. = limit of detection, 100 pfu per gram tissue. (E) Self-replicating eTIP1 RNAs form cytosolic dsRNA intermediates and activate pattern recognition receptors, leading to the production of IFN and IFN-stimulated genes. This could also promote a protective antiviral state within the local tissue as well as at distal sites. The plasma membrane of the infected cells loses integrity and release damage-associated molecular patterns. Replication of eTIP1 within the upper-respiratory tract (red dot represents replication in nasal turbinates) send signals to recruit various types of circulating leukocytes at local (nasal-associated lymphoid tissue) and distal sites (bronchus-associated lymphoid tissue). In this way, eTIP1 can induce non-cell autonomous, distal protection, is effective prophylactically and therapeutically, and can boost neutralizing antibody production.

Comment in

Similar articles

Cited by

References

    1. Abdool Karim S.S., de Oliveira T. New SARS-CoV-2 Variants - Clinical, Public Health, and Vaccine Implications. N. Engl. J. Med. 2021;384:1866–1868. - PMC - PubMed
    1. Ascough S., Vlachantoni I., Kalyan M., Haijema B.-J., Wallin-Weber S., Dijkstra-Tiekstra M., Ahmed M.S., van Roosmalen M., Grimaldi R., Zhang Q., et al. Local and Systemic Immunity against Respiratory Syncytial Virus Induced by a Novel Intranasal Vaccine. A Randomized, Double-Blind, Placebo-controlled Clinical Trial. Am. J. Respir. Crit. Care Med. 2019;200:481–492. - PMC - PubMed
    1. Bao L., Deng W., Huang B., Gao H., Liu J., Ren L., Wei Q., Yu P., Xu Y., Qi F., et al. The pathogenicity of SARS-CoV-2 in hACE2 transgenic mice. Nature. 2020;583:830–833. - PubMed
    1. Bessière P., Wasniewski M., Picard-Meyer E., Servat A., Figueroa T., Foret-Lucas C., Coggon A., Lesellier S., Boué F., Cebron N., et al. Intranasal type I interferon treatment is beneficial only when administered before clinical signs onset in the SARS-CoV-2 hamster model. PLoS Pathog. 2021;17:e1009427. - PMC - PubMed
    1. Bohrer A.C., Castro E., Hu Z., Queiroz A.T.L., Tocheny C.E., Assmann M., Sakai S., Nelson C., Baker P.J., Ma H., et al. Tuberculosis Imaging Program Eosinophils are part of the granulocyte response in tuberculosis and promote host resistance in mice. J. Exp. Med. 2021;218:e20210469. - PMC - PubMed

Publication types

MeSH terms