. 2021 Nov;150(5):3581.
doi: 10.1121/10.0007046.

Modeling the effects of age and hearing loss on concurrent vowel scores

Affiliations

Modeling the effects of age and hearing loss on concurrent vowel scores

Harshavardhan Settibhaktini et al. J Acoust Soc Am. 2021 Nov.

Abstract

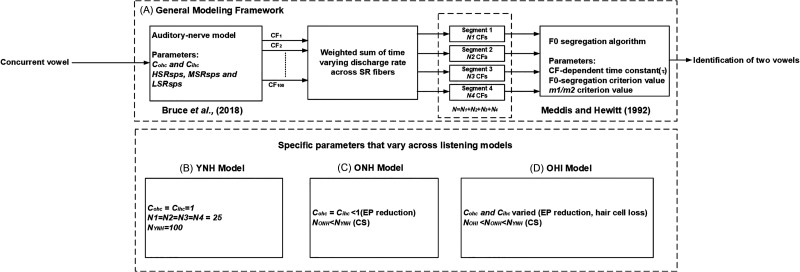
A difference in fundamental frequency (F0) between two vowels is an important segregation cue prior to identifying concurrent vowels. To understand the effects of this cue on identification due to age and hearing loss, Chintanpalli, Ahlstrom, and Dubno [(2016). J. Acoust. Soc. Am. 140, 4142-4153] collected concurrent vowel scores across F0 differences for younger adults with normal hearing (YNH), older adults with normal hearing (ONH), and older adults with hearing loss (OHI). The current modeling study predicts these concurrent vowel scores to understand age and hearing loss effects. The YNH model cascaded the temporal responses of an auditory-nerve model from Bruce, Efrani, and Zilany [(2018). Hear. Res. 360, 40-45] with a modified F0-guided segregation algorithm from Meddis and Hewitt [(1992). J. Acoust. Soc. Am. 91, 233-245] to predict concurrent vowel scores. The ONH model included endocochlear-potential loss, while the OHI model also included hair cell damage; however, both models incorporated cochlear synaptopathy, with a larger effect for OHI. Compared with the YNH model, concurrent vowel scores were reduced across F0 differences for ONH and OHI models, with the lowest scores for OHI. These patterns successfully captured the age and hearing loss effects in the concurrent-vowel data. The predictions suggest that the inability to utilize an F0-guided segregation cue, resulting from peripheral changes, may reduce scores for ONH and OHI listeners.


Figures

FIG. 1.
FIG. 1.
Block diagram illustrating the steps involved in the computational model to predict the concurrent vowel scores across F0 differences. (A) General modeling framework across three listening models. The parameters of the AN model are Cohc, Cihc, HSRsps, MSRsps, and LSRsps, whereas the parameters for the F0-segregation algorithm are the CF-dependent time constant (τ), and F0-segregation and m1/m2 criterion values. The AN responses are obtained for 100 CFs that ranged logarithmically between 250 and 4000 Hz. These 100 CFs are divided into four octave-spaced segments [i.e., segment 1 (250 to 500 Hz); segment 2 (500 to 1000 Hz); segment 3 (1000 to 2000 Hz); and segment 4 (2000 to 4000 Hz)] using N1, N2, N3, and N4 for the low to high CF bands, respectively]. (B) Parameters modified for YNH computational model. (C) Parameters modified for ONH computational model. (D) Parameters modified for OHI computational model. For the ONH and OHI models, the number of CFs in each segment is varied to simulate CS. For hypothesis testing, only the parameters associated with the peripheral stage were altered to predict the concurrent vowel scores for ONH and OHI models, whereas the same parameter values were used for the F0-segregation algorithm across all three peripheral models.
FIG. 2.
FIG. 2.
Predicted effects of F0 difference on percent concurrent vowel identification (top panels, solid lines) and percent segregation (bottom panels). Percent F0 segregation is computed as the proportion of vowel pairs (out of 25) in which the ACFs were segregated into two different sets. YNH model (A and E), ONH model with only EP reduction (B and F), ONH model (C and G), and OHI model (D and H). Note that the same F0-guided segregation parameter values are used across models. To simulate CS, only 30 CFs (i.e., 4, 3, 3, and 20 across the four segments) and 20 CFs (i.e., 2, 1, 1, and 16 across the four segments) out of 100 are used for ONH and OHI models (third and fourth columns), respectively. The percent identification scores of Chintanpalli et al. (2016) are shown in the top panels using the dashed lines, rather than the rationalized arcsine transformed scores.
FIG. 3.
FIG. 3.
Model responses for /i (F0 = 100 Hz), æ (F0 = 106 Hz)/ presented to the YNH model. The first column corresponds to the individual ACF channels from 100 different AN fibers. These channels are added together to obtain the pooled ACF (D). The estimated dominant (F0) is 106 Hz, as indicated by an arrow (D). The second column shows only ACF channels that have a peak at 9.43 ms (B) and the remaining channels are placed in the third column (C). The model vowel responses are correct, as shown in (E) and (F). Note that the timbre regions of the templates /æ/ and /i/ (thin solid lines) are shown in (E) and (F) with an arbitrary vertical and horizontal offset for clarity. For visualization purposes, only 50% of channels are shown in the ACF plots.
FIG. 4.
FIG. 4.
Model responses for/i (F0 = 100 Hz), æ (F0 = 106 Hz)/presented to the ONH model. The first column corresponds to the individual ACF channels of the 30 selected AN fibers (4, 3, 3, and 20 across four segments) due to CS. The figure layout is similar to Fig. 3. The estimated dominant F0 is 106 Hz, as indicated by an arrow (D). The model vowel responses are correct, as shown in panels (E) and (F).
FIG. 5.
FIG. 5.
Model responses for/i (F0 = 100 Hz), æ (F0 = 106 Hz)/presented to the OHI model. (A) Only 20 ACF channels (2, 1, 1, and 16 across four segments) are included due to CS. (B) These channels are added together to obtain the pooled ACF, where the estimated F0 is 106 Hz (arrow). Figure layout similar to Fig. 3, but without segregated ACFs. The model predicts an incorrect vowel response /æ, æ/ for this no-F0 segregation condition.

Similar articles

References

    1. Allen, P. D. , and Eddins, D. A. (2010). “ Presbycusis phenotypes form a heterogeneous continuum when ordered by degree and configuration of hearing loss,” Hear. Res. 264(1–2), 10–20.10.1016/j.heares.2010.02.001 - DOI - PMC - PubMed
    1. Arehart, K. H. , Arriaga, C. , Kelly, K. , and Mclean-Mudgett, S. (1997). “ Role of fundamental frequency differences in the perceptual separation of competing vowel sounds by listeners with normal hearing and listeners with hearing loss,” J. Speech, Lang. Hear. Res. 40, 1434–1444.10.1044/jslhr.4006.1434 - DOI - PubMed
    1. Arehart, K. H. , Rossi-Katz, J. , and Swensson-Prutsman, J. (2005). “ Double-vowel perception in listeners with cochlear hearing loss: Differences in fundamental frequency, ear of presentation, and relative amplitude,” J. Speech. Lang. Hear. Res. 48, 236–252.10.1044/1092-4388(2005/017) - DOI - PubMed
    1. Arehart, K. H. , Souza, P. E. , Muralimanohar, R. K. , and Miller, C. W. (2011). “ Effects of age on concurrent vowel perception in acoustic and simulated electroacoustic hearing,” J. Speech Lang. Hear. Res. 54, 190–210.10.1044/1092-4388(2010/09-0145) - DOI - PMC - PubMed
    1. Assmann, P. F. , and Summerfield, Q. (1990). “ Modeling the perception of concurrent vowels: Vowels with different fundamental frequencies,” J. Acoust. Soc. Am. 88, 680–697.10.1121/1.399772 - DOI - PubMed

Publication types