

Macrophage-Specific IGF-1 Overexpression Reduces CXCL12 Chemokine Levels and Suppresses Atherosclerotic Burden in Apoe-Deficient Mice
- PMID: 34852642
- PMCID: PMC8792341
- DOI: 10.1161/ATVBAHA.121.316090
Macrophage-Specific IGF-1 Overexpression Reduces CXCL12 Chemokine Levels and Suppresses Atherosclerotic Burden in Apoe-Deficient Mice
Abstract
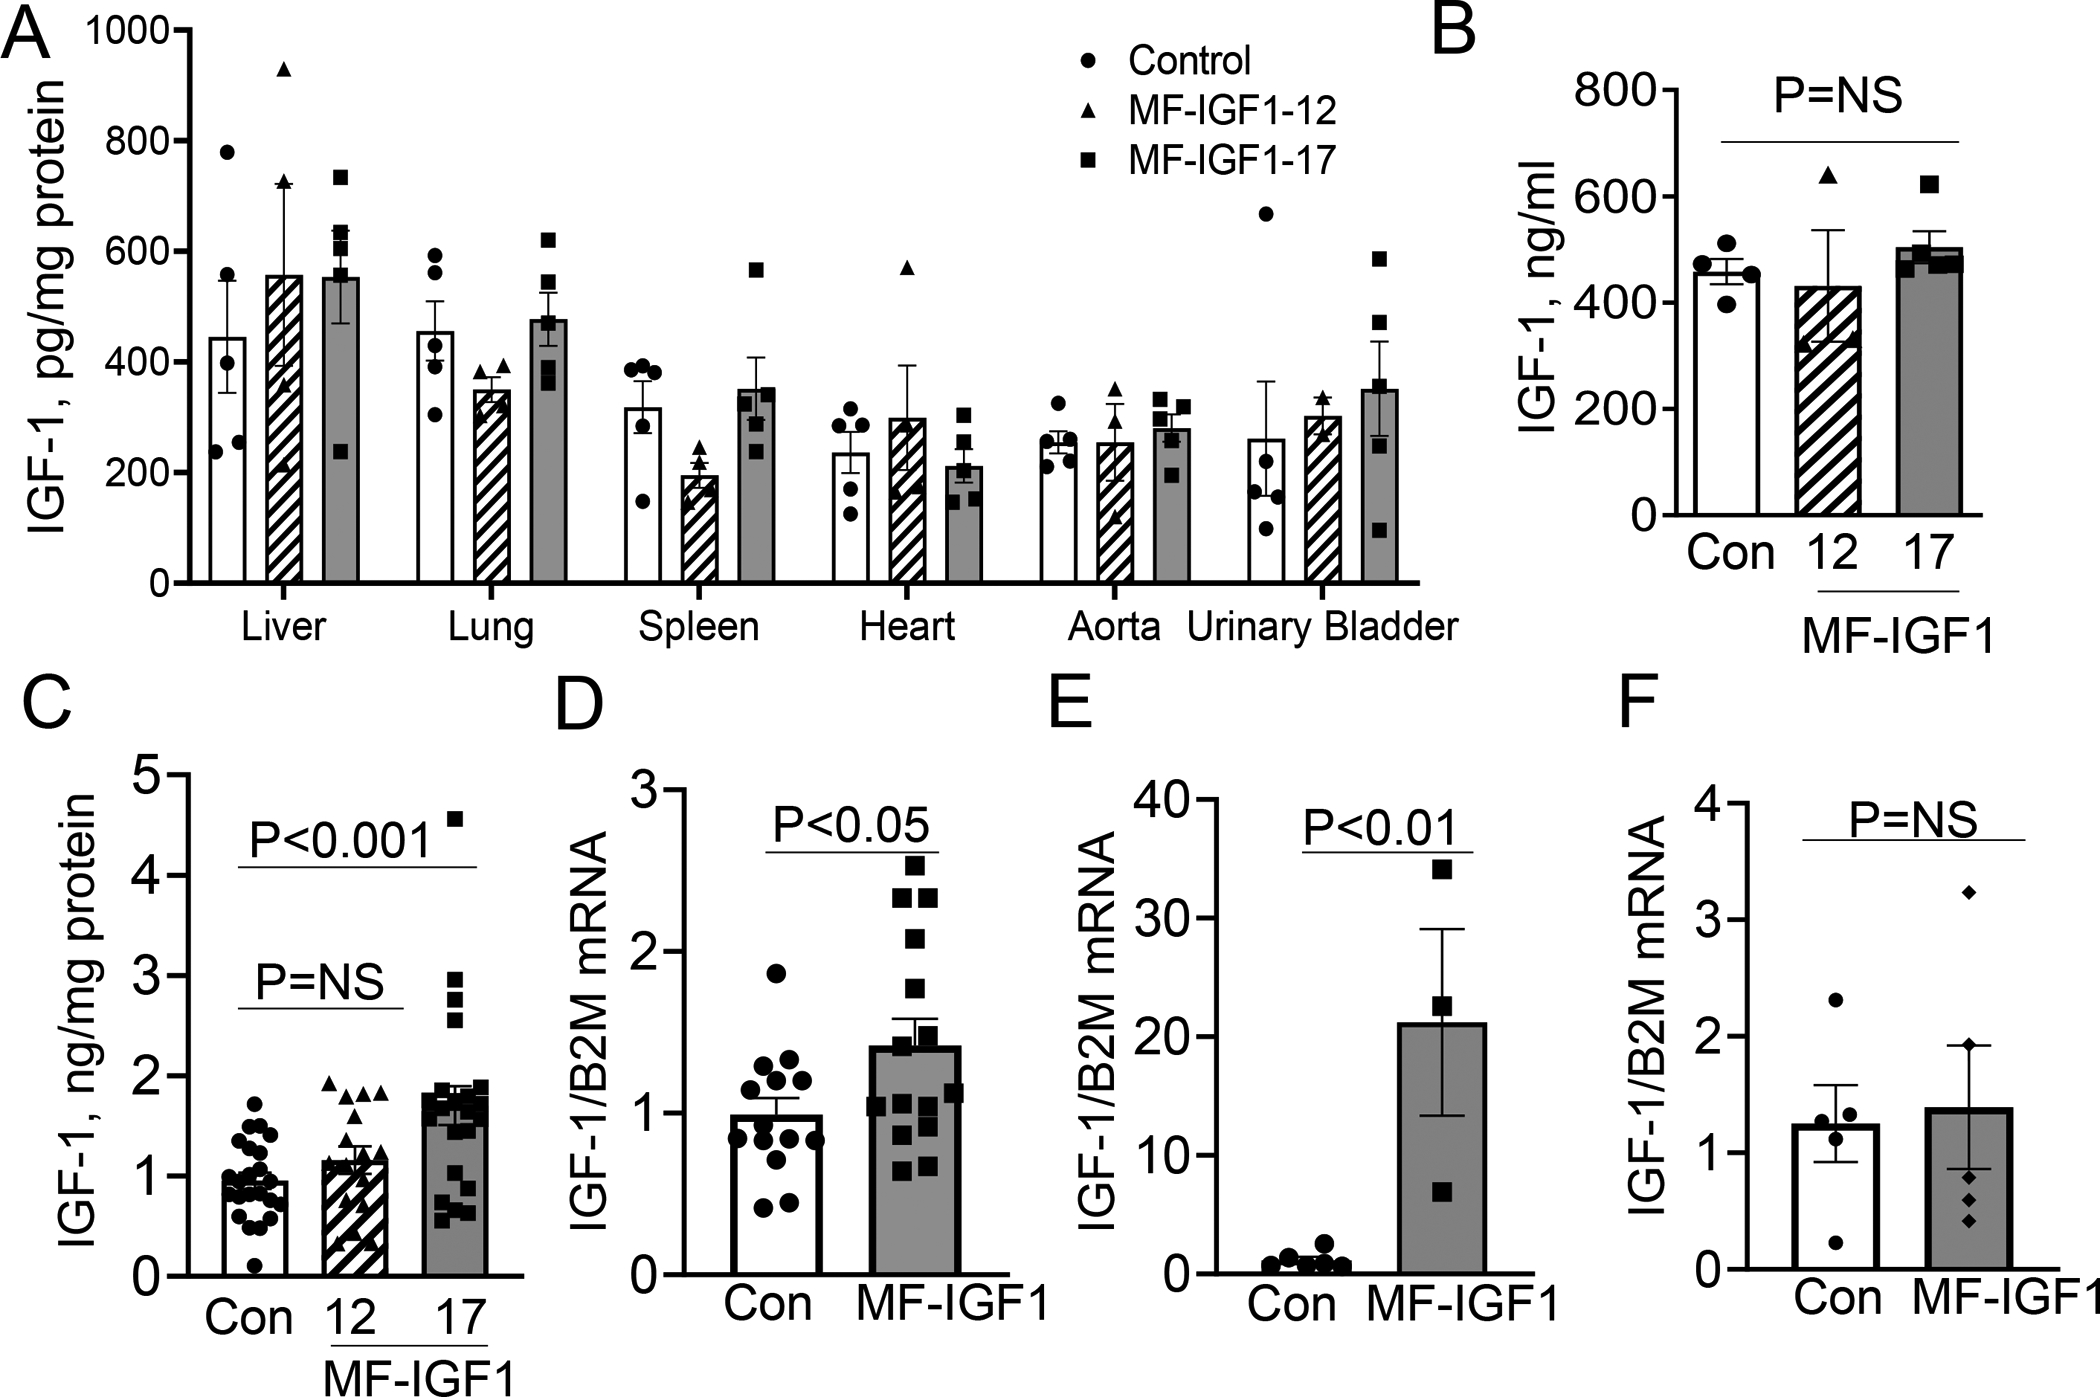
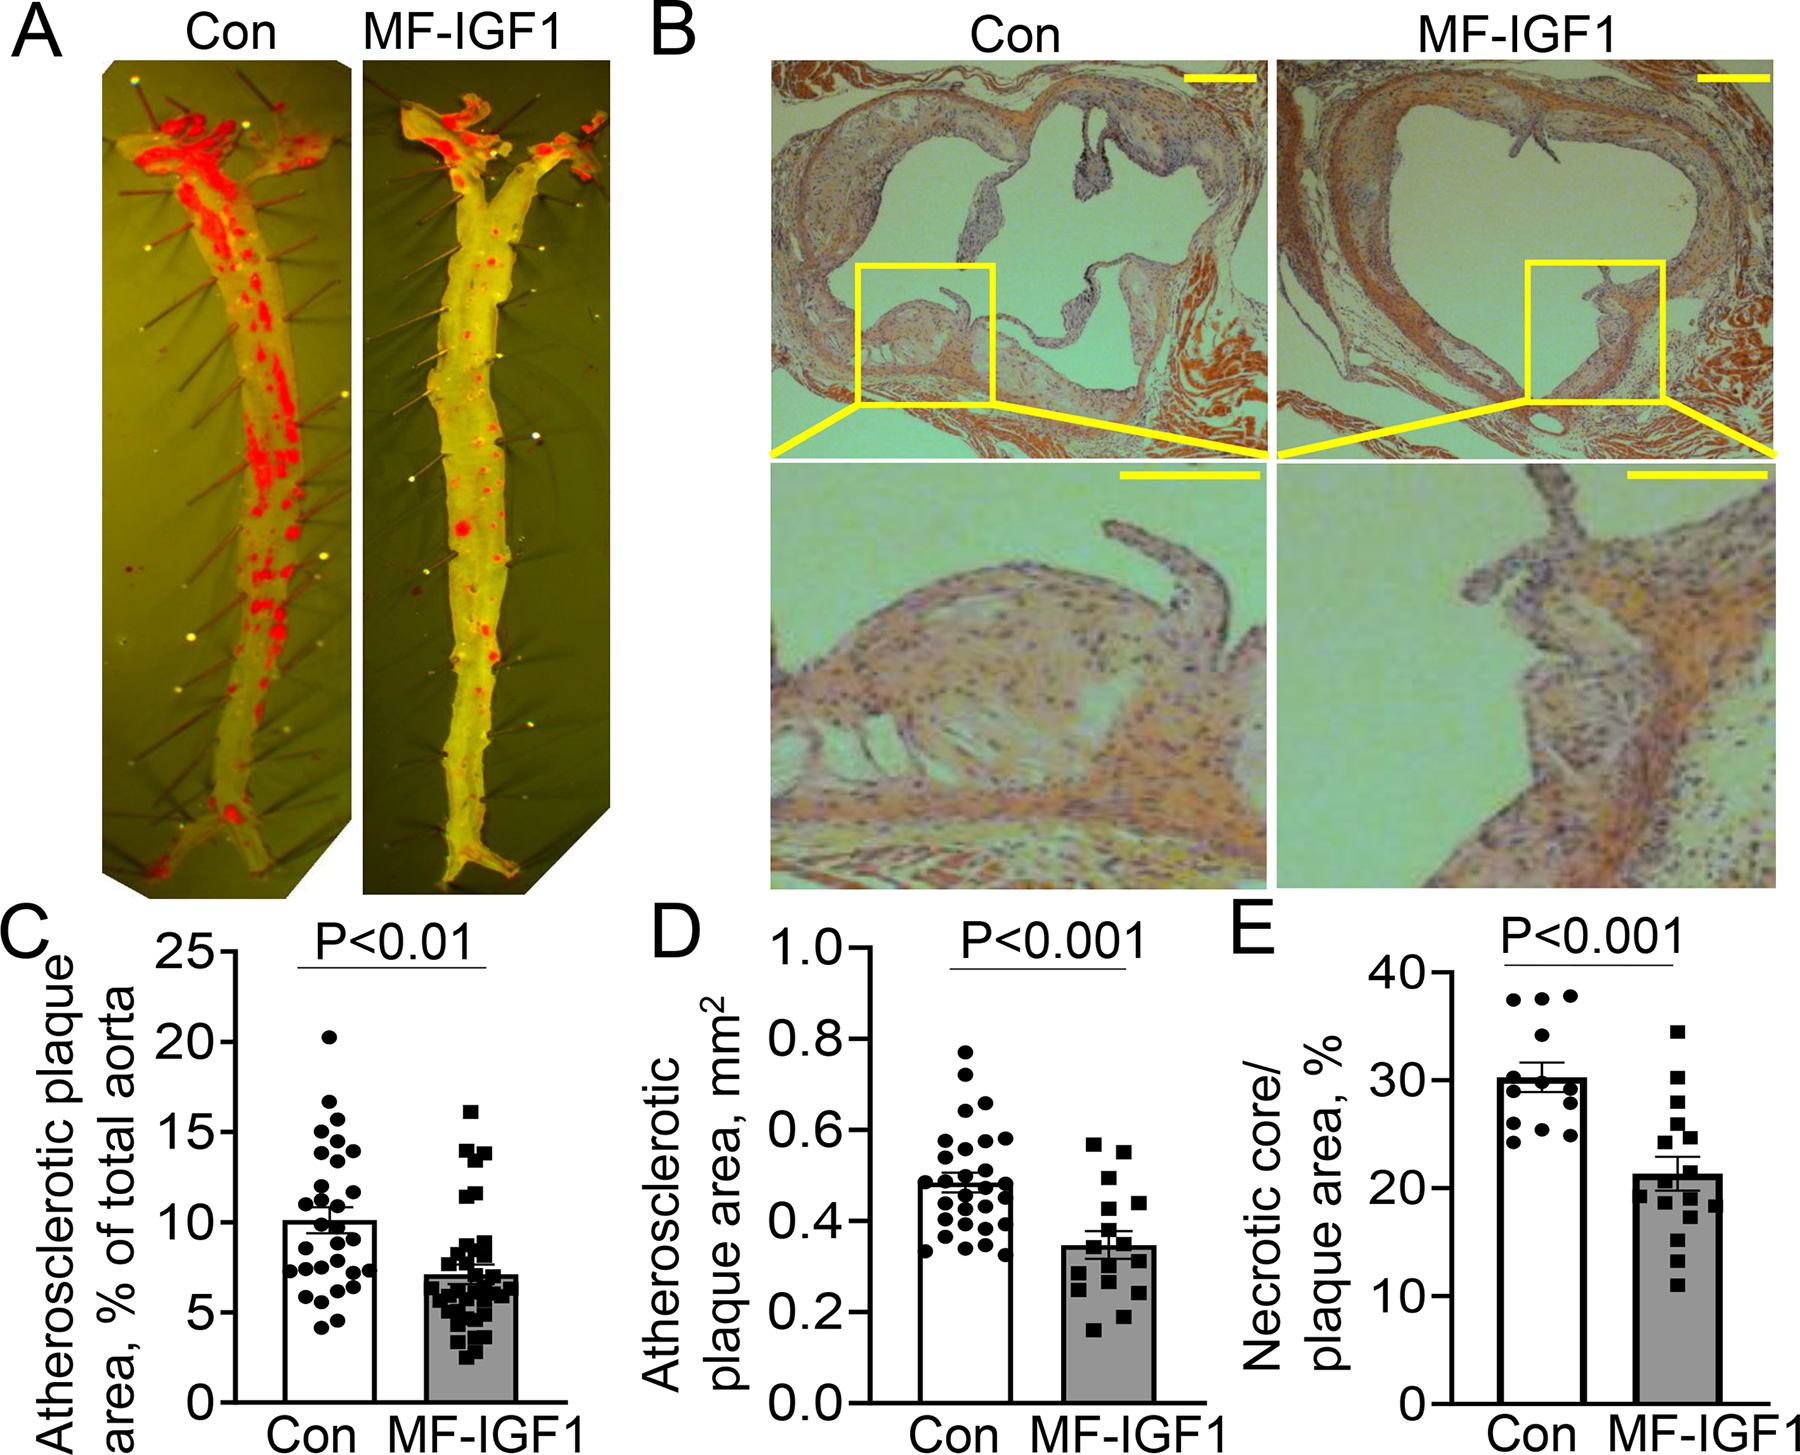
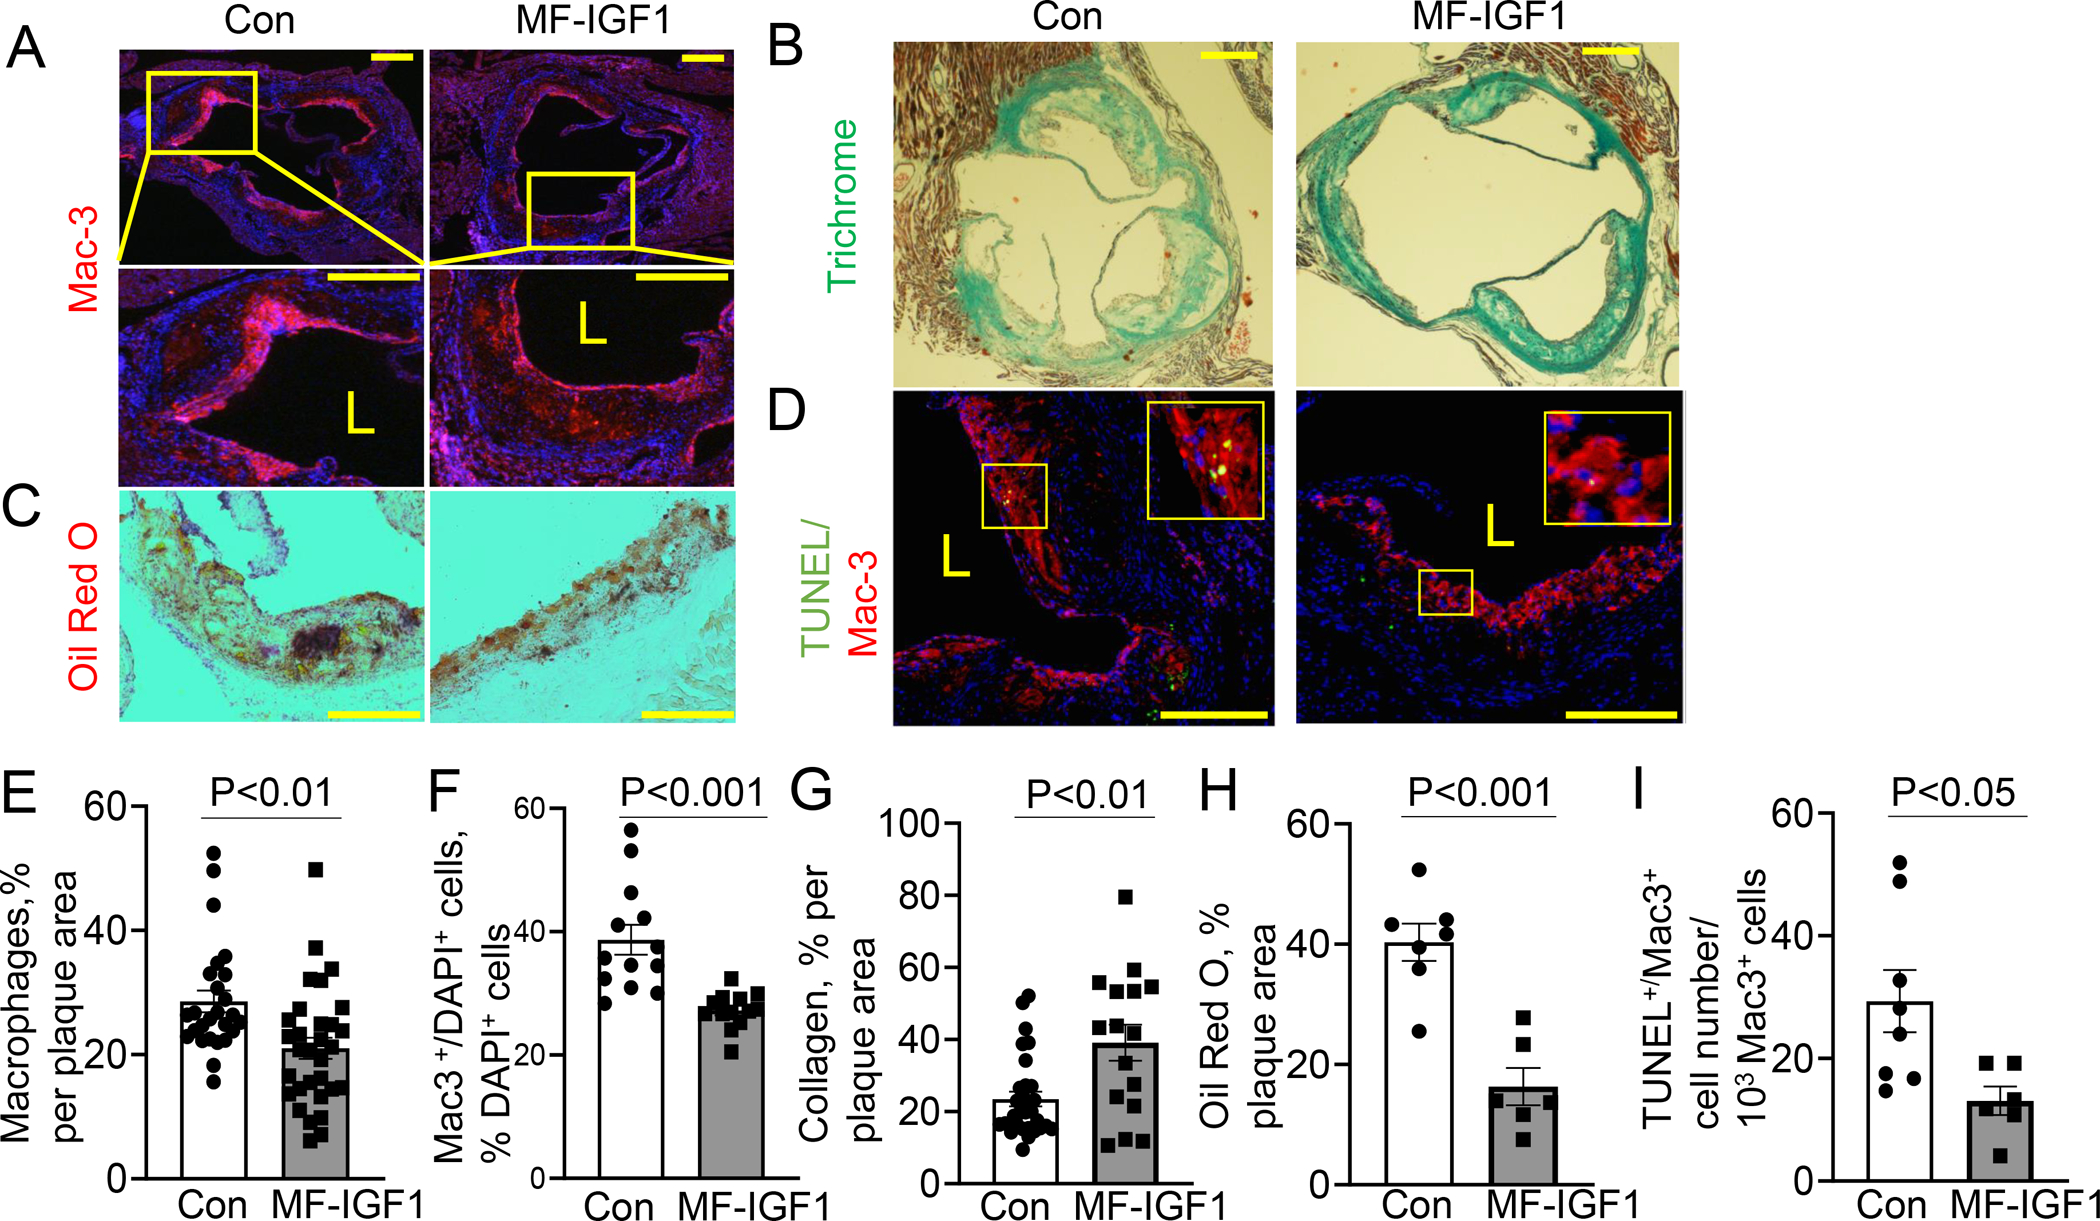
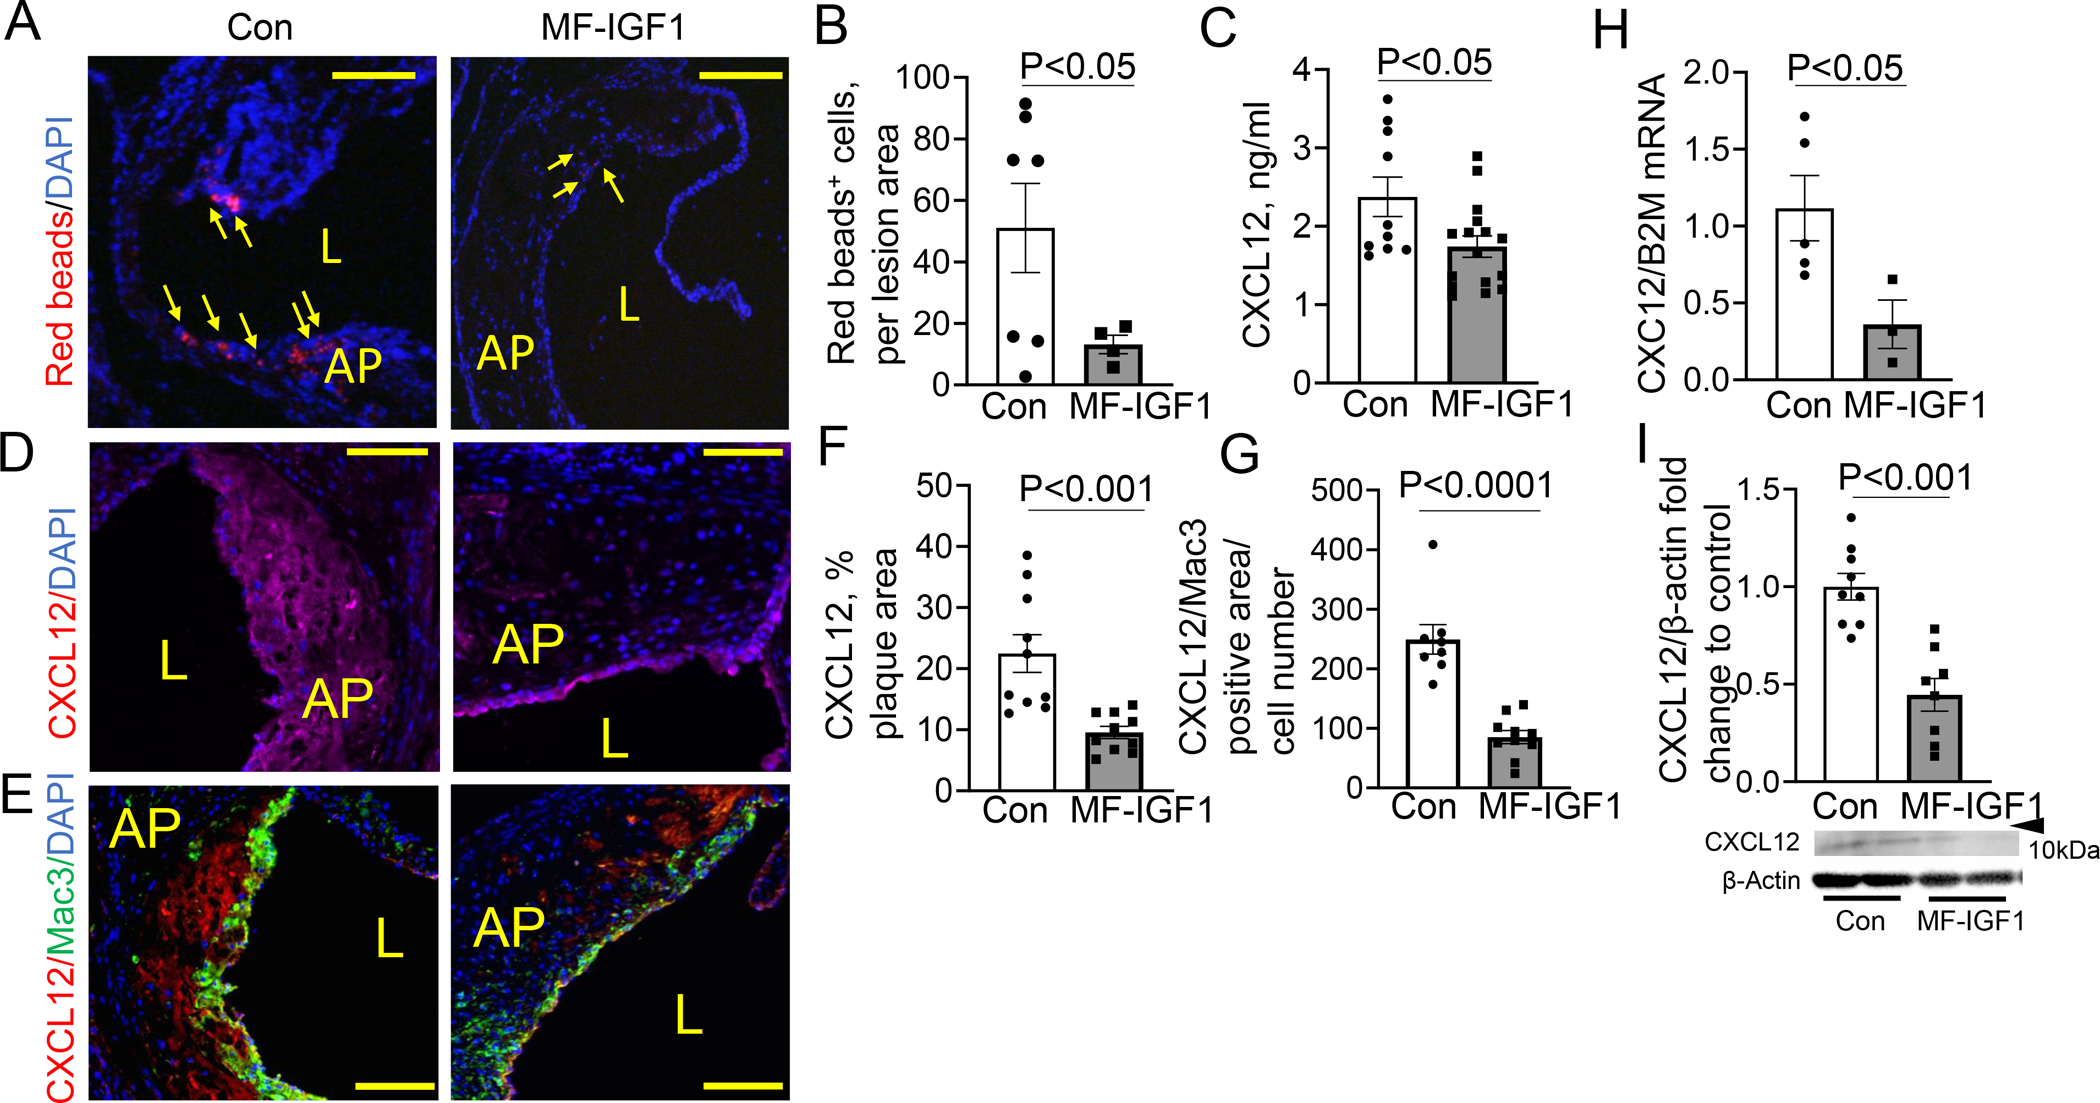
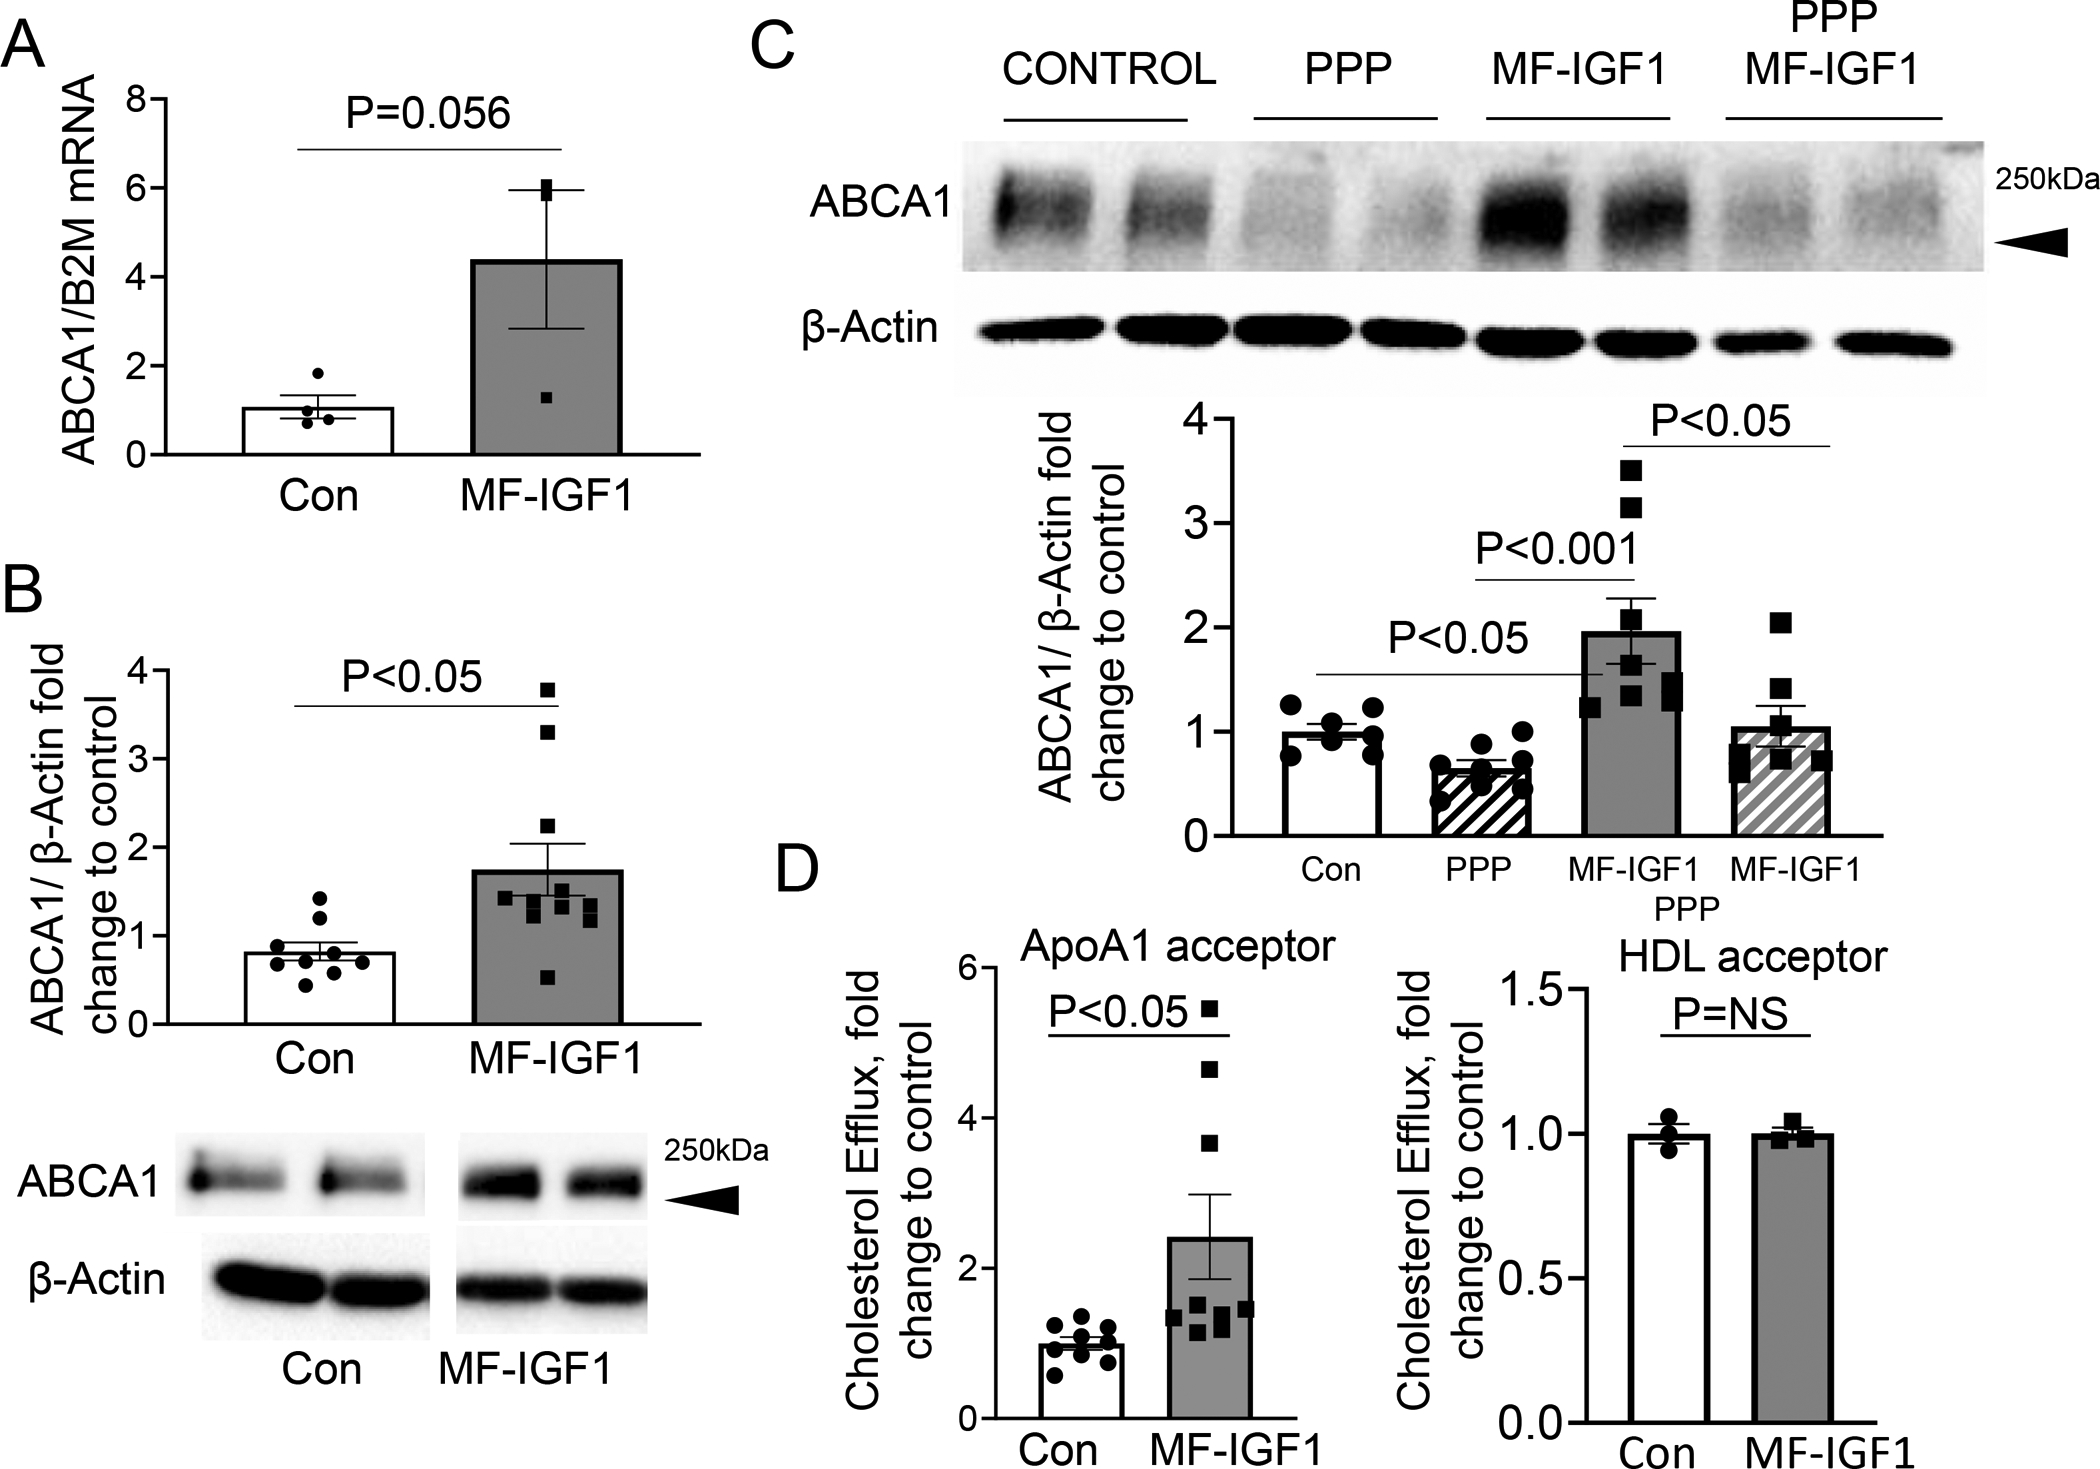
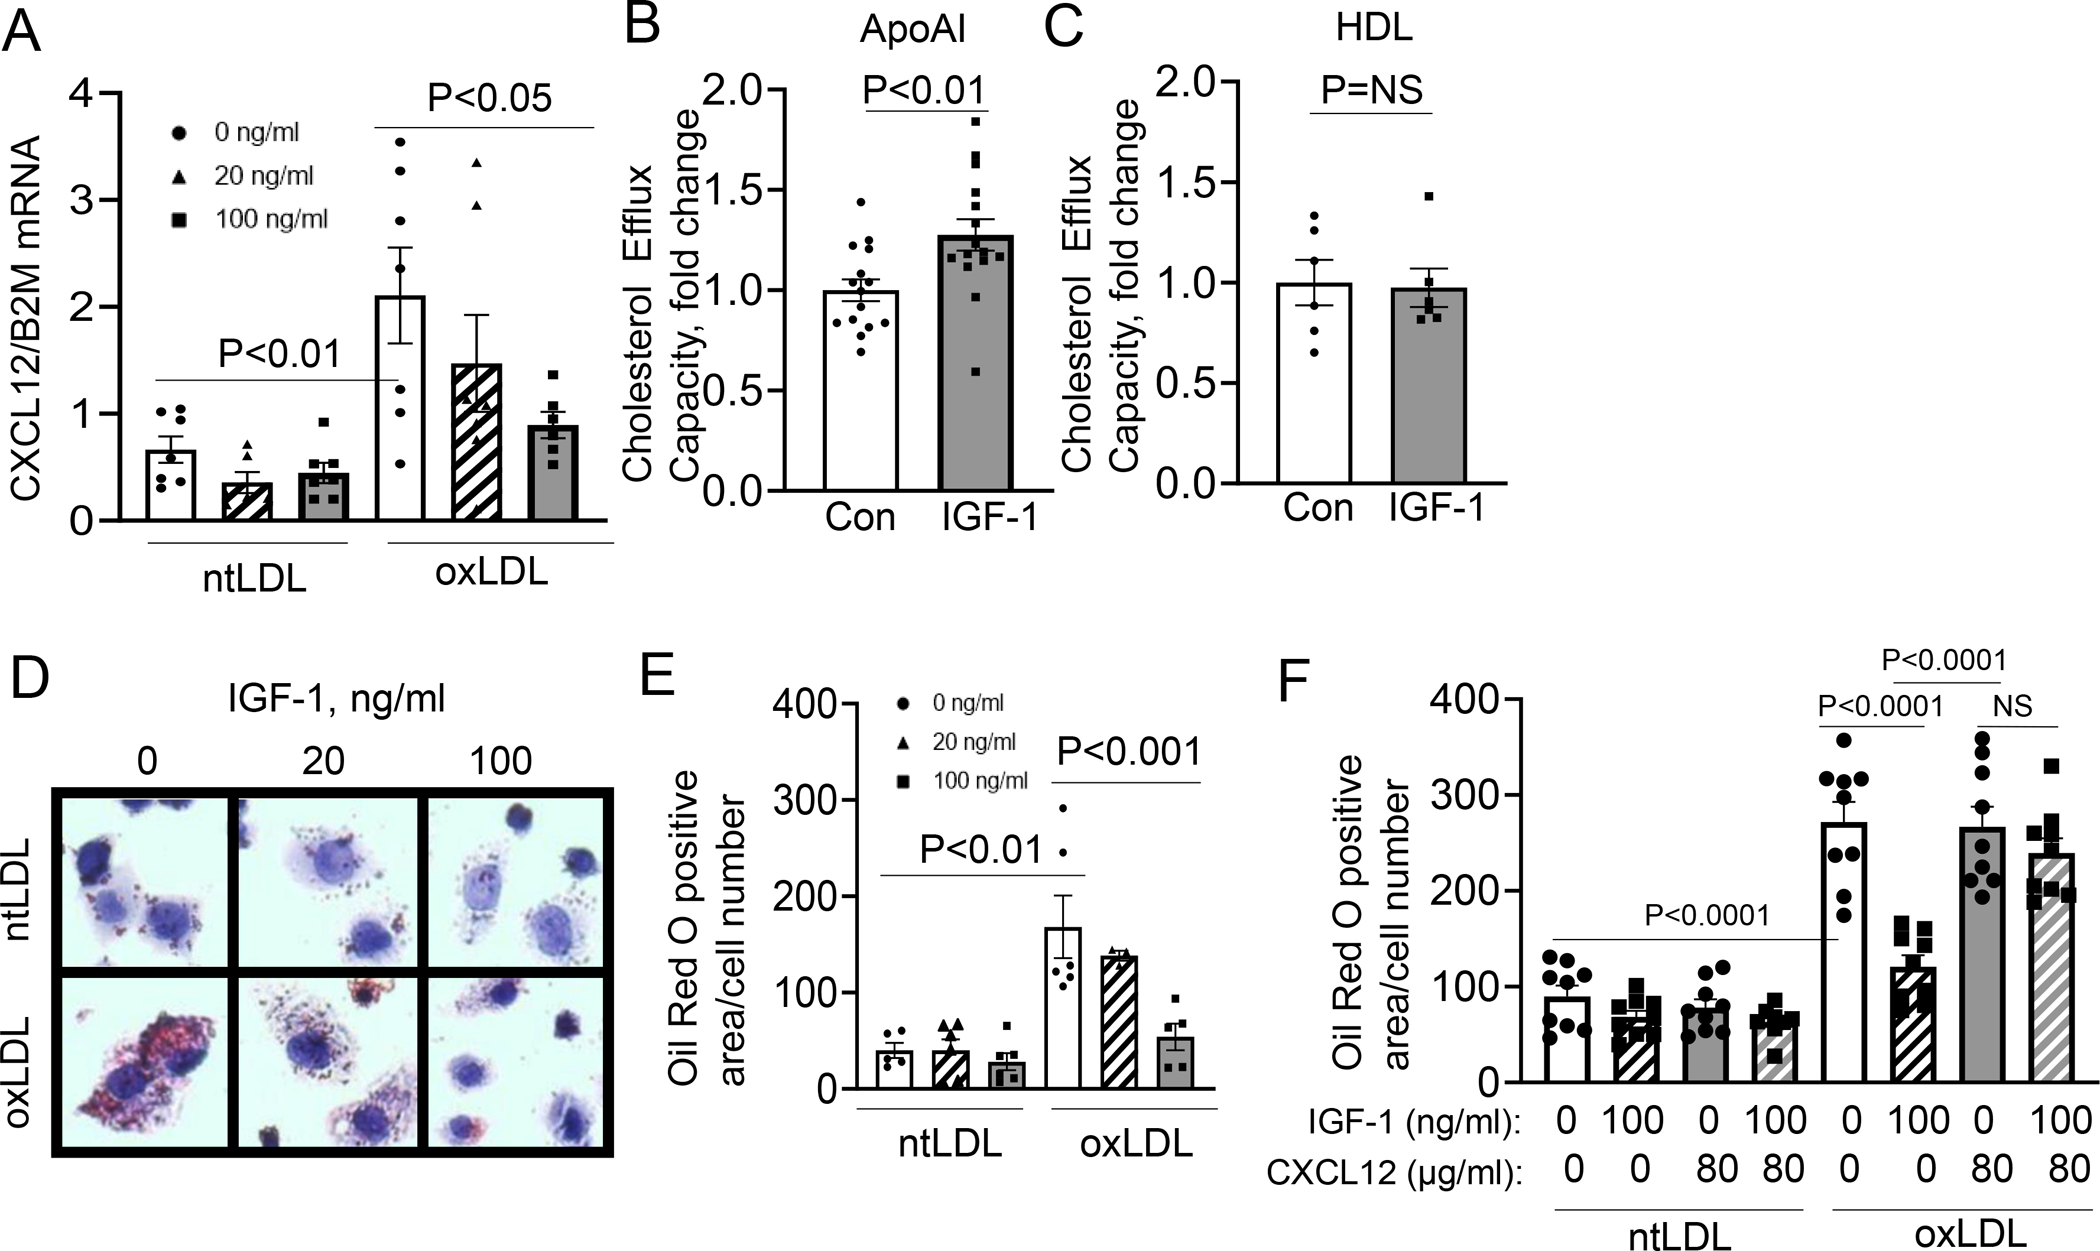
Objective: IGF-1 (insulin-like growth factor 1) exerts pleiotropic effects including promotion of cellular growth, differentiation, survival, and anabolism. We have shown that systemic IGF-1 administration reduced atherosclerosis in Apoe-/- (apolipoprotein E deficient) mice, and this effect was associated with a reduction in lesional macrophages and a decreased number of foam cells in the plaque. Almost all cell types secrete IGF-1, but the effect of macrophage-derived IGF-1 on the pathogenesis of atherosclerosis is poorly understood. We hypothesized that macrophage-derived IGF-1 will reduce atherosclerosis. Approach and Results: We created macrophage-specific IGF-1 overexpressing mice on an Apoe-/- background. Macrophage-specific IGF-1 overexpression reduced plaque macrophages, foam cells, and atherosclerotic burden and promoted features of stable atherosclerotic plaque. Macrophage-specific IGF1 mice had a reduction in monocyte infiltration into plaque, decreased expression of CXCL12 (CXC chemokine ligand 12), and upregulation of ABCA1 (ATP-binding cassette transporter 1), a cholesterol efflux regulator, in atherosclerotic plaque and in peritoneal macrophages. IGF-1 prevented oxidized lipid-induced CXCL12 upregulation and foam cell formation in cultured THP-1 macrophages and increased lipid efflux. We also found an increase in cholesterol efflux in macrophage-specific IGF1-derived peritoneal macrophages.
Conclusions: Macrophage IGF-1 overexpression reduced atherosclerotic burden and increased features of plaque stability, likely via a reduction in CXCL12-mediated monocyte recruitment and an increase in ABCA1-dependent macrophage lipid efflux.
Keywords: atherosclerosis; cytokines; inflammation; intercellular signaling peptides and proteins; lipids.
Figures
Similar articles
-
Insulin-Like Growth Factor-1 Receptor Deficiency in Macrophages Accelerates Atherosclerosis and Induces an Unstable Plaque Phenotype in Apolipoprotein E-Deficient Mice.Circulation. 2016 Jun 7;133(23):2263-78. doi: 10.1161/CIRCULATIONAHA.116.021805. Epub 2016 May 6. Circulation. 2016. PMID: 27154724 Free PMC article.
-
CXCL12 promotes atherosclerosis by downregulating ABCA1 expression via the CXCR4/GSK3β/β-cateninT120/TCF21 pathway.J Lipid Res. 2019 Dec;60(12):2020-2033. doi: 10.1194/jlr.RA119000100. Epub 2019 Oct 29. J Lipid Res. 2019. PMID: 31662443 Free PMC article.
-
Insulin-like growth factor I reduces lipid oxidation and foam cell formation via downregulation of 12/15-lipoxygenase.Atherosclerosis. 2015 Feb;238(2):313-20. doi: 10.1016/j.atherosclerosis.2014.12.024. Epub 2014 Dec 20. Atherosclerosis. 2015. PMID: 25549319 Free PMC article.
-
Aging, atherosclerosis, and IGF-1.J Gerontol A Biol Sci Med Sci. 2012 Jun;67(6):626-39. doi: 10.1093/gerona/gls102. Epub 2012 Apr 5. J Gerontol A Biol Sci Med Sci. 2012. PMID: 22491965 Free PMC article. Review.
-
Atherosclerosis in chronic kidney disease: the role of macrophages.Nat Rev Nephrol. 2011 Jan;7(1):45-54. doi: 10.1038/nrneph.2010.157. Epub 2010 Nov 23. Nat Rev Nephrol. 2011. PMID: 21102540 Free PMC article. Review.
Cited by
-
Mechanism and physical activities in bone-skeletal muscle crosstalk.Front Endocrinol (Lausanne). 2024 Jan 3;14:1287972. doi: 10.3389/fendo.2023.1287972. eCollection 2023. Front Endocrinol (Lausanne). 2024. PMID: 38239981 Free PMC article. Review.
-
Use of blood glucose level for predicting the degree of coronary artery disease and cardiovascular adverse events in diabetic patients with acute coronary syndrome.Am J Transl Res. 2025 Apr 15;17(4):3179-3188. doi: 10.62347/AQXW7292. eCollection 2025. Am J Transl Res. 2025. PMID: 40385062 Free PMC article.
-
Manipulating the tumor immune microenvironment to improve cancer immunotherapy: IGF1R, a promising target.Front Immunol. 2024 Feb 14;15:1356321. doi: 10.3389/fimmu.2024.1356321. eCollection 2024. Front Immunol. 2024. PMID: 38420122 Free PMC article. Review.
-
IGFBPL1 inhibits macrophage lipid accumulation by enhancing the activation of IGR1R/LXRα/ABCG1 pathway.Aging (Albany NY). 2023 Dec 28;15(24):14791-14802. doi: 10.18632/aging.205301. Epub 2023 Dec 28. Aging (Albany NY). 2023. PMID: 38157252 Free PMC article.
-
Insulin-like growth factor 1 reduces coronary atherosclerosis in pigs with familial hypercholesterolemia.JCI Insight. 2023 Feb 22;8(4):e165713. doi: 10.1172/jci.insight.165713. JCI Insight. 2023. PMID: 36602878 Free PMC article.
References
-
- Mozaffarian D, Benjamin EJ, Go AS, Arnett DK, Blaha MJ, Cushman M, Das SR, de Ferranti S, Despres JP, Fullerton HJ, Howard VJ, Huffman MD, Isasi CR, Jimenez MC, Judd SE, Kissela BM, Lichtman JH, Lisabeth LD, Liu S, Mackey RH, Magid DJ, McGuire DK, Mohler ER 3rd, Moy CS, Muntner P, Mussolino ME, Nasir K, Neumar RW, Nichol G, Palaniappan L, Pandey DK, Reeves MJ, Rodriguez CJ, Rosamond W, Sorlie PD, Stein J, Towfighi A, Turan TN, Virani SS, Woo D, Yeh RW, Turner MB, American Heart Association Statistics C and Stroke Statistics S. Heart Disease and Stroke Statistics-2016 Update: A Report From the American Heart Association. Circulation. 2016;133:e38–e360. - PubMed
-
- Ross R Atherosclerosis is an inflammatory disease. American heart journal. 1999;138:S419–20. - PubMed
-
- Gregersen I, Holm S, Dahl TB, Halvorsen B and Aukrust P. A focus on inflammation as a major risk factor for atherosclerotic cardiovascular diseases. Expert Review of Cardiovascular Therapy. 2016;14:391–403. - PubMed
Publication types
MeSH terms
Substances
Grants and funding
LinkOut - more resources
Full Text Sources
Medical
Miscellaneous
