. 2022 Mar;34(2):190-198.
doi: 10.1177/10406387211057859. Epub 2021 Dec 2.

Receptor-binding domain-based immunoassays for serosurveillance differentiate efficiently between SARS-CoV2-exposed and non-exposed farmed mink

Affiliations

Receptor-binding domain-based immunoassays for serosurveillance differentiate efficiently between SARS-CoV2-exposed and non-exposed farmed mink

Jorge Pulido et al. J Vet Diagn Invest. 2022 Mar.

Abstract

During the COVID-19 pandemic, infection of farmed mink has become not only an economic issue but also a widespread public health concern. International agencies have advised the use of strict molecular and serosurveillance methods for monitoring the SARS-CoV2 status on mink farms. We developed 2 ELISAs and a duplex protein microarray immunoassay (MI), all in a double-recognition format (DR), to detect SARS-CoV2 antibodies specific to the receptor-binding domain (RBD) of the spike protein and to the full-length nucleoprotein (N) in mink sera. We collected 264 mink serum samples and 126 oropharyngeal samples from 5 Spanish mink farms. In both of the ELISAs and the MI, RBD performed better than N protein for serologic differentiation of mink from SARS-CoV2-positive and -negative farms. Therefore, RBD was the optimal antigenic target for serosurveillance of mink farms.

Keywords: COVID-19; ELISA; RBD; SARS-CoV2; mink; protein microarray; serosurveillance.


Conflict of interest statement

Declaration of conflicting interests: The authors declared no potential conflicts of interest with respect to the research, authorship, and/or publication of this article.

Figures

Figure 1.
Figure 1.
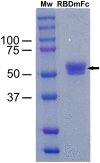
Analysis of purified recombinant RBDmFc by SDS-PAGE and Coomassie staining. Three mg of receptor-binding domain (RBD, 55 kDa; indicated by an arrow), purified from culture supernatant of HEK-293 cells by protein G–based affinity chromatography, were fractionated by 10% SDS-PAGE. Mw = molecular weight markers (in kDa).
Figure 2.
Figure 2.
Cross-reactivity determination by microarray immunoassay between SARS-CoV2–specific Ig and antigens. Specific Ig reactivity (signal intensity) was measured from 2-fold serial printing concentrations of the nucleoprotein (N, 0.2–0.025 mg/mL; on the left of the charts) and receptor-binding domain (RBD, 0.25–0.031 mg/mL; on the right of the charts) by incubating with positive control serum and serial 2-fold dilutions of single antigen detectors. A. Tested N-HRP dilutions: 1:4,000 (light blue), 1:8,000 (orange), 1:16,000 (gray), 1:32,000 (yellow), 1:64,000 (dark blue), 1:128,000 (green). B. Tested RBD-HRP dilutions: 1:250 (light blue), 1:500 (orange), 1:1,000 (gray), 1:2,000 (yellow), 1:4,000 (dark blue), 1:8,000 (green), 1:16,000 (magenta), 1:32,000 (brown).
Figure 3.
Figure 3.
Best conjugated antigen detector dilutions and antigen printing concentrations for our microarray immunoassay (MI). Serial 2-fold dilutions of detector cocktail obtained with a mixture of nucleoprotein (N)-HRP and receptor-binding domain (RBD)-HRP were used for assaying the positive (on the left in the charts) and the negative control serum (on the right in the charts) with a microarray containing 2-fold serial antigen printing concentrations (0.2–0.025 mg/mL for N; 0.25–0.031 mg/mL for RBD). Specific Ig reactivity (signal intensity) to N and RBD are shown in A and B, respectively; tested detector cocktail dilutions: 1:16,000 N-HRP, 1:1,000 RBD-HRP (orange); 1:32,000 N-HRP, 1:2,000 RBD-HRP (gray); 1:64,000 N-HRP, 1:4,000 RBD-HRP (yellow); 1:128,000 N-HRP, 1:8,000 RBD-HRP (dark blue); 1:256,000 N-HRP, 1:16,000 RBD-HRP (green); 1:512,000 N-HRP, 1:32,000 RBD-HRP (magenta).
Figure 4.
Figure 4.
Sensitivity (Se) and specificity (Sp) values of the double-recognition format ELISAs (DR-ELISAs) and the microarray immunoassay (MI). Dot plot diagrams in which each dot represents an individual sample: results obtained for DR-ELISA based on A. nucleoprotein (N) and B. receptor-binding domain (RBD), and for MI based on C. N and D. RBD. The horizontal solid lines are the cutoff values in each assay. The x-axes show the exposed and non-exposed classification of samples according to RT-rtPCR and time of sampling (pre or post COVID-19 pandemic outbreak). Positive = exposed mink from farms 1 and 2. Negative = non-exposed mink from farms 3, 4, and 5. The y-axes show the sample:positive (S:P) ratio or signal intensity obtained in the DR-ELISA or the MI, respectively.

References

    1. Andersen KG, et al.. The proximal origin of SARS-CoV-2. Nat Med 2020;26:450–452. - PMC - PubMed
    1. Bastarache JA, et al.. Accuracy and reproducibility of a multiplex immunoassay platform: a validation study. J Immunol Methods 2011;367:33–39. - PMC - PubMed
    1. Boklund A, et al.. SARS-CoV-2 in Danish mink farms: course of the epidemic and a descriptive analysis of the outbreaks in 2020. Animals (Basel) 2021;11:164. - PMC - PubMed
    1. Chia WN, et al.. Serological differentiation between COVID-19 and SARS infections. Emerg Microbes Infect 2020;9:1497–1505. - PMC - PubMed
    1. Corman VM, et al.. Detection of 2019 novel coronavirus (2019-nCoV) by real-time RT-PCR. Euro Surveill 2020;25:2000045. - PMC - PubMed