. 2021 Dec 1;40(1):378.
doi: 10.1186/s13046-021-02179-z.

BUB1 drives the occurrence and development of bladder cancer by mediating the STAT3 signaling pathway

Affiliations

BUB1 drives the occurrence and development of bladder cancer by mediating the STAT3 signaling pathway

Ning Jiang et al. J Exp Clin Cancer Res. .

Abstract

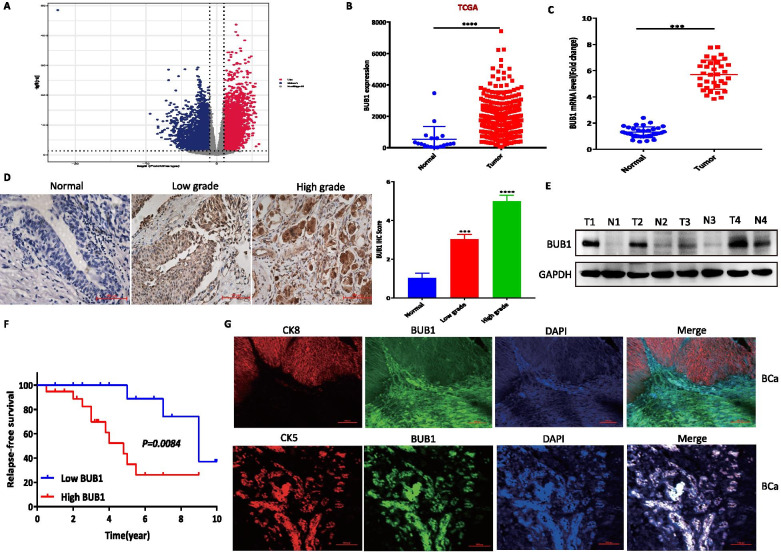
Background: The incidence of bladder urothelial carcinoma (UC), a common malignancy of the urinary tract, is approximately three times higher in men than in women. High expression of the mitotic kinase BUB1 is associated with the occurrence and development of several cancers, although the relationship between BUB1 and bladder tumorigenesis remains unclear.

Methods: Using a microarray approach, we found increased BUB1 expression in human BCa. The association between BUB1 and STAT3 phosphorylation was determined through molecular and cell biological methods. We evaluated the impact of pharmacologic inhibition of BUB1 kinase activity on proliferation and BCa progression in vitro and in vivo.

Results: In this study, we found that BUB1 expression was increased in human bladder cancer (BCa). We further identified through a series of molecular and cell biological approaches that BUB1 interacted directly with STAT3 and mediated the phosphorylation of STAT3 at Ser727. In addition, the findings that pharmacologic inhibition of BUB1 kinase activity significantly suppressed BCa cell proliferation and the progression of bladder cancer in vitro and in vivo were further verified. Finally, we found that the BUB1/STAT3 complex promoted the transcription of STAT3 target genes and that depletion of BUB1 and mutation of the BUB1 kinase domain abrogated this transcriptional activity, further highlighting the critical role of kinase activity in the activation of STAT3 target genes. A pharmacological inhibitor of BUB1 (2OH-BNPP1) was able to significantly inhibit the growth of BCa cell xenografts.

Conclusion: This study showed that the BUB1 kinase drives the progression and proliferation of BCa by regulating the transcriptional activation of STAT3 signaling and may be an attractive candidate for therapeutic targeting in BCa.

Keywords: BUB1; Bladder cancer; Phosphorylation; Proliferation; STAT3.


Conflict of interest statement

The authors declare no potential conflicts of interest.

Figures

Fig. 1
Fig. 1
BUB1 expression was increased in human bladder cancer. A. Volcano plot of differentially expressed genes (DEGs) in TCGA BLCA data. B. Box plots of the relative mRNA expression levels of BUB1 in human bladder cancer samples from TCGA datasets. The boxes show that the expression level of BUB1(n = 19) in normal bladder tissue was lower than that (n = 411) in bladder cancer tissue. P < 0.0001. C. Real-time PCR analysis of BUB1 mRNA levels in tissue derived from 34 paired bladder cancer specimens. P < 0.001. D. Immunohistochemical (IHC) analysis of the BUB1 protein in human normal bladder and bladder cancer clinical samples. Quantification of IHC staining in human normal bladder and bladder cancer clinical samples. E. WB analysis of the BUB1 protein level in human normal bladder (N) and bladder cancer (T) clinical samples. F. Comparison of survival rates in the indicated groups. Low BUB1 expression group, n = 14; high BUB1 expression group, n = 20. Patients with high expression of BUB1 had a significantly worse prognosis than those with low expression of BUB1 (P = 0.0084); n: number of patients. G. Immunofluorescence staining showing the correlation between BUB1 localization and CK5 and CK8 localization in bladder cancer tissue
Fig. 2
Fig. 2
BUB1 was related to JAK-STAT signaling. A. Heatmap of RNA-seq expression data for 5637 cells transfected with si control or si BUB1. B. Gene Ontology annotations of 392 genes involved in biological processes, molecular function and cellular compartments. C. GSEA of RNA-seq data using gene sets from MSigDB revealed that BUB1 target genes were involved in cell cycle signaling and JAK-STAT signaling. D. The correlation between BUB1 and STAT3 based on GEPIA database analysis
Fig. 3
Fig. 3
Molecular Interactions between STAT3 and BUB1. A. Schematic drawing of the domains and motifs of human BUB1 and STAT3. TPR: tetratricopeptide repeat. B. Co-IP and WB analysis of BUB1 and STAT3 proteins in total lysates obtained from T24, EJ and 5637 cells grown under serum-fed conditions. A mixture (1:1:1 ratio) of lysates from T24, EJ and 5637 cells was used in the IgG control sample. C. Co-IP and WB analysis of BUB1 and fragments of STAT3. D. Co-IP and WB analysis of STAT3 fragments and BUB1 in the input sample. E. Co-IP and WB analysis of the BUB1-P300 complex. F. Five thousand six hundred thirty-seven cells were transfected with the BUB1 wild-type vector for 24 h. Alexa Fluor 488 was used to stain BUB1 (green), Cy3 was used to stain STAT3 (red) and DAPI was used to stain cell nuclei (blue) for co-immunofluorescence (co-IF) analysis of the BUB1 and STAT3 proteins. G. Immunofluorescence staining (IF) of STAT3 (red) and BUB1 (green) in normal bladder and BCa tissues. Cell nuclei were visualized by DAPI staining
Fig. 4
Fig. 4
Knockdown of BUB1 Attenuates the STAT3 Transcriptional Program. A. 5637 cell were treated with siBUB1. qRT–PCR analysis was performed to measure the mRNA levels of STAT3–induced target genes. The data are presented as the means ± SDs. B. The protein levels of BUB1, Ser727-STAT3, STAT3, NFATC2, LHX1 and GAPDH were measured by Western blotting in siBUB1-transfected 5637 and T24 cells. C. MTT experiments showed the IC50 value of BUB1 inhibitor 2OH-BNPP1. D. 5637 cell were treated with 10 μM 2OH-BNPP1. qRT–PCR analysis was performed to measure the mRNA levels of STAT3–induced target genes. The data are presented as the means ± SDs. E. The protein levels of BUB1, Ser727-STAT3, STAT3, NFATC2, LHX1 and GAPDH were measured by Western blotting in 10 μM 2OH-BNPP1-treated 5637 cell. F. T24 cells were treated with 10 μM 2OH-BNPP1. qRT–PCR analysis was performed to measure the mRNA levels of STAT3–induced target genes. The data are presented as the means ± SDs. G. The protein levels of BUB1, Ser727-STAT3, STAT3, NFATC2, LHX1 and GAPDH were measured by Western blotting in 10 μM 2OH-BNPP1-treated T24 cells
Fig. 5
Fig. 5
BUB1 Kinase Activity Was Required to Maintain STAT3 Target Gene mRNA Levels. A. STAT3 was purified alone or incubated with equimolar amounts of purified BUB1 in the absence or presence of 10 μM 2OH-BNPP1 and was then subjected to immunoblotting using the indicated antibodies. B. An in vitro kinase assay was performed using purified BUB1 and the indicated STAT3 protein, and immunoblotting was then performed with the indicated antibodies. C 5637 cell were cotransfected with BUB1 and MYC-tagged STAT3 or mutants, and immunoblotting was then performed. D. 5637 cell were transfected with si control or two distinct BUB1 siRNAs. Lysates were immunoprecipitated with the anti-pS727-STAT3 antibody, and immunoblotting was then performed with the anti-STAT3 antibody. Lysates were also subjected to immunoblotting with the anti-BUB1 antibody. E. The protein levels of BUB1, Ser727-STAT3, STAT3, NFATC2, LHX1 and GAPDH were measured by Western blotting in BUB1wt vector-transfected 5637 cell. F. 5637 cell were transfected with the BUB1wt vector or BUB1 KD vector. qRT–PCR analysis was performed to measure the mRNA levels of STAT3–induced target genes. The data are presented as the means ± SDs. G. The protein levels of BUB1, Ser727-STAT3, STAT3, NFATC2, LHX1 and GAPDH were measured by Western blotting in BUB1wt vector- or BUB1 KD vector-transfected 5637 cell. H. STAT3 luciferase activity in 5637 cell after transfection with BUB1wt and shSTAT3. The signal was quantified, and statistical significance was determined by Student’s t-test (**p < 0.01, ***p < 0.001). I. Chromatin prepared from 5637 cell treated with 2OH-BNPP1 was subjected to ChIP using an anti-STAT3-Ser727 antibody, and qPCR was then performed using primers targeting STAT3 or the control (gene desert) region. *p < 0.05, **p < 0.01. J. Chromatin prepared from 5637 cells treated with siBUB1 was subjected to ChIP using an anti-STAT3-Ser727 antibody. K. Chromatin prepared from 5637 cell treated with BUB1wt or KD vectors was subjected to ChIP using an anti-STAT3-Ser727 antibody. L. Western blot analysis of protein expression in 5637 cell after transfection with STAT3wt and shBUB1. Signals were quantified, and statistical significance was determined by Student’s t-test (**p < 0.01, ***p < 0.001). M. Sphere formation assay in STAT3wt vector- and shBUB1 vector-transfected 5637 cell
Fig. 6
Fig. 6
BUB1 regulated the proliferation and invasion of T24 and 5637 bladder cancer cells. A. T24 cells were transfected with sicontrol or siBUB1, and an MTT assay was used to evaluate cell proliferation. B. 5637 cell were transfected with sicontrol or siBUB1, and an MTT assay was used to evaluate cell proliferation. C. 5637 and T24 cells were transfected with control, BUB1 wild-type or BUB1 K821R vector, and Transwell assay was used to evaluate cell invasion ability. D. 5637 and T24 cells were transfected with si control or siBUB1, and Transwell assays were used to detect cell invasion ability. E. 5637 cell were cotransfected with BUB1 siRNA and the CFP-H3 plasmid for 48 h. Live-cell imaging was performed to monitor chromosome segregation during mitosis. The differential interference contrast (DIC) and CFP channels were recorded every 10 min for 16 h. Representative still images are shown. Scale bar 5 μm
Fig. 7
Fig. 7
BUB1 expression was related to the occurrence and development of bladder cancer. A. Flow chart of the method used to establish the mouse model of spontaneous bladder cancer. B. H&E staining of the bladders of mice treated with 0.1% BNN in different stages of disease progression. The first row shows the normal structure of the mouse bladder epithelium; the second row shows the structure of mouse bladder cancer in situ; the third row shows the structure of mouse bladder papillary carcinoma; and the fourth and fifth rows show the structure of mouse invasive bladder cancer invading muscle tissue and adipose tissue. C. Immunohistochemical staining of the bladders of mice treated with 0.1% BNN in different stages of disease. The first row shows the expression of BUB1 in normal mouse bladder epithelium; the second row shows the expression of BUB1 in mouse bladder cancer in situ; the third row shows the expression of BUB1 in mouse bladder papillary carcinoma; and the fourth row shows the expression of BUB1 in mouse invasive bladder cancer
Fig. 8
Fig. 8
BUB1 Inhibitor 2OH-BNPP1 suppressed BCa Tumor Growth. A T24 cell were treated with 2OH-BNPP1 (5 or 10 μM) or vehicle (10% DMSO) for 96 h, and the number of viable cells was determined by an MTT assay. B 5637 cell were treated with 2OH-BNPP1 or vehicle (10% DMSO) for 96 h, and the number of viable cells was determined by an MTT assay. C 5637 cell were treated with 2OH-BNPP1 or vehicle (10% DMSO) for 24 h, and the number of invading cells was determined by an invasion assay. D T24 cell were treated with 2OH-BNPP1 or vehicle (10% DMSO) for 24 h, and the number of invading cells was determined by an invasion assay. E 5637 cell were implanted subcutaneously into male BALB/c mice. When the tumors became palpable, the mice were injected with either vehicle (10% DMSO in PBS) or 2OH-BNPP1 (100 mg/kg of body weight) for 10 days. Tumors were measured with calipers. F Quantitation of Ki-67, p-stat3, NFATC2 and LHX1 expression in 5637 xenograft tumors from each group. Specimens were obtained 10 days post treatment. IHC staining was scored according to the number of cells expressing the indicated proteins, and statistical analysis was performed (nonparametric Kruskal–Wallis test) to determine significance. See also Supplementary Fig. 3. **p < 0.01, *p < 0.05

Similar articles

Cited by

References

    1. Siegel RL, Miller KD, Jemal A. Cancer statistics, 2020. CA Cancer J Clin. 2020;70:7–30. - PubMed
    1. von der Maase H, Sengelov L, Roberts JT, Ricci S, Dogliotti L, Oliver T, Moore MJ, Zimmermann A, Arning M. Long-term survival results of a randomized trial comparing gemcitabine plus cisplatin, with methotrexate, vinblastine, doxorubicin, plus cisplatin in patients with bladder cancer. J Clin Oncol. 2005;23:4602–4608. - PubMed
    1. Sherr CJ. Cancer cell cycles. Science. 1996;274:1672–1677. - PubMed
    1. Liu H, Jia L, Yu H. Phospho-H2A and cohesin specify distinct tension-regulated Sgo1 pools at kinetochores and inner centromeres. Curr Biol. 2013;23:1927–1933. - PubMed
    1. Ding Y, Hubert CG, Herman J, Corrin P, Toledo CM, Skutt-Kakaria K, Vazquez J, Basom R, Zhang B, Risler JK, et al. Cancer-specific requirement for BUB1B/BUBR1 in human brain tumor isolates and genetically transformed cells. Cancer Discov. 2013;3:198–211. - PMC - PubMed

Substances