

A DNA adductome analysis revealed a reduction in the global level of C5-hydroxymethyl-2'-deoxycytidine in the non-tumoral upper urinary tract mucosa of urothelial carcinoma patients
- PMID: 34852853
- PMCID: PMC8638144
- DOI: 10.1186/s41021-021-00228-9
A DNA adductome analysis revealed a reduction in the global level of C5-hydroxymethyl-2'-deoxycytidine in the non-tumoral upper urinary tract mucosa of urothelial carcinoma patients
Abstract
Background: DNA adducts, covalent modifications to DNA due to exposure to specific carcinogens, cause the mispairing of DNA bases, which ultimately results in DNA mutations. DNA methylation in the promoter region, another type of DNA base modification, alters the DNA transcription process, and has been implicated in carcinogenesis in humans due to the down-regulation of tumor suppressor genes. Difficulties are associated with demonstrating the existence of DNA adducts or chemically modified bases in the human urological system. Apart from aristolochic acid-DNA adducts, which cause urothelial carcinoma and endemic nephropathy in a particular geographical area (Balkan), limited information is currently available on DNA adduct profiles in renal cell carcinoma and upper urinary tract urothelial carcinoma, including renal pelvic cancer and ureteral cancer.
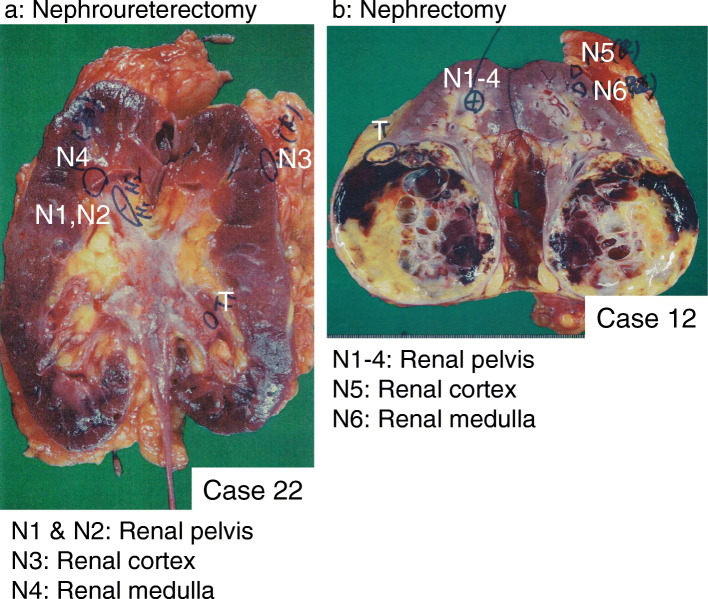
Method: To elucidate the significance of DNA adducts in carcinogenesis in the urothelial system, we investigated 53 DNA adducts in the non-tumoral renal parenchyma and non-tumoral renal pelvis of patients with renal cell carcinoma, upper urinary tract urothelial carcinoma, and other diseases using liquid chromatography coupled with tandem mass spectrometry. A comparative analysis of tissue types, the status of malignancy, and clinical characteristics, including lifestyle factors, was performed.
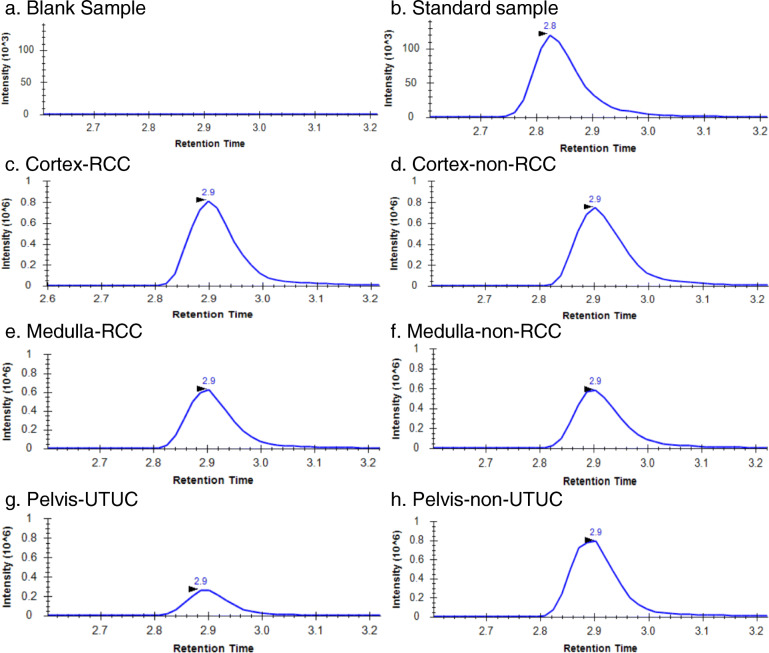
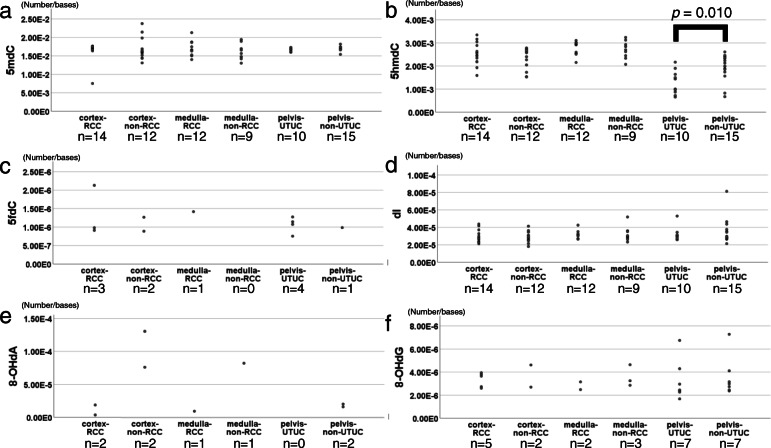
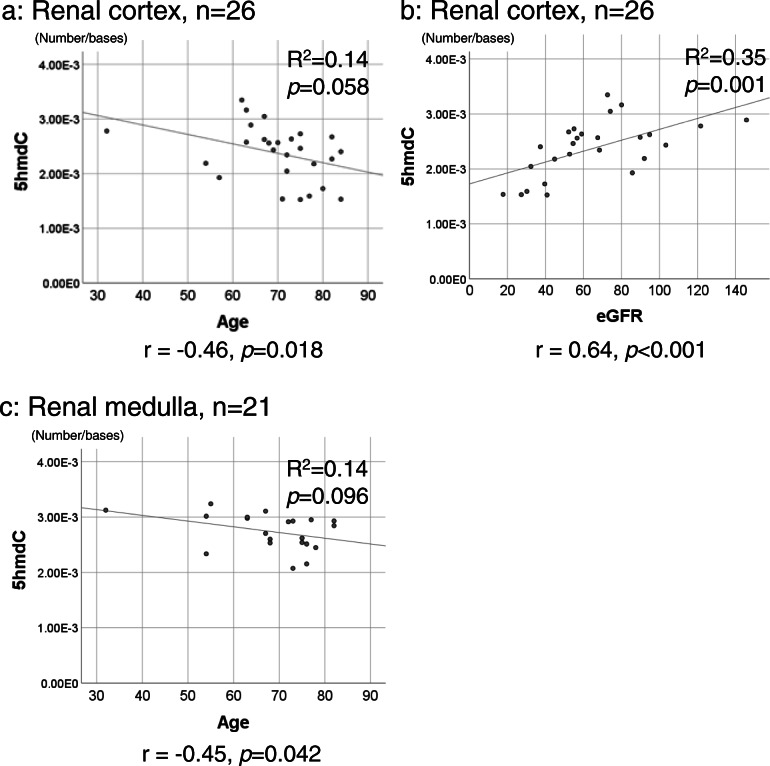
Results: C5-Methyl-2'-deoxycytidine, C5-hydroxymethyl-2'-deoxycytidine (5hmdC), C5-formyl-2'-deoxycytidine, 2'-deoxyinosine, C8-oxo-2'-deoxyadenosine, and C8-oxo-2'-deoxyguanosine (8-OHdG) were detected in the renal parenchyma and renal pelvis. 8-OHdG was more frequently detected in the renal pelvis than in the renal cortex and medulla (p = 0.048 and p = 0.038, respectively). 5hmdC levels were significantly lower in the renal pelvis of urothelial carcinoma patients (n = 10) than in the urothelium of patients without urothelial carcinoma (n = 15) (p = 0.010). Regarding 5hmdC levels in the renal cortex and medulla, Spearman's rank correlation test revealed a negative correlation between age and 5hmdC levels (r = - 0.46, p = 0.018 and r = - 0.45, p = 0.042, respectively).
Conclusions: The present results revealed a reduction of 5hmdC levels in the non-tumoral urinary tract mucosa of patients with upper urinary tract urothelial carcinoma. Therefore, the urothelial cell epithelia of patients with upper urinary tract cancer, even in non-cancerous areas, may be predisposed to urothelial cancer.
Keywords: C5-hydroxymethyl-2′-deoxycytidine; DNA adduct; DNA adductome; DNA adductomics; Oxidative DNA damage; Renal cell carcinoma; Upper urinary tract urothelial carcinoma.
© 2021. The Author(s).
Conflict of interest statement
The authors declare that they have no competing interests.
Figures
Similar articles
-
Screening DNA Damage in the Rat Kidney and Liver by Untargeted DNA Adductomics.Chem Res Toxicol. 2024 Feb 19;37(2):340-360. doi: 10.1021/acs.chemrestox.3c00333. Epub 2024 Jan 9. Chem Res Toxicol. 2024. PMID: 38194517 Free PMC article.
-
Mass spectrometric profiling of DNA adducts in the human stomach associated with damage from environmental factors.Genes Environ. 2021 Apr 9;43(1):12. doi: 10.1186/s41021-021-00186-2. Genes Environ. 2021. PMID: 33836837 Free PMC article.
-
Aristolactam-DNA adducts are a biomarker of environmental exposure to aristolochic acid.Kidney Int. 2012 Mar;81(6):559-67. doi: 10.1038/ki.2011.371. Epub 2011 Nov 9. Kidney Int. 2012. PMID: 22071594 Free PMC article.
-
Geospatial Assessments of DNA Adducts in the Human Stomach: A Model of Field Cancerization.Cancers (Basel). 2021 Jul 24;13(15):3728. doi: 10.3390/cancers13153728. Cancers (Basel). 2021. PMID: 34359626 Free PMC article. Review.
-
Epidemiology of urothelial carcinoma.Int J Urol. 2017 Oct;24(10):730-734. doi: 10.1111/iju.13376. Epub 2017 May 21. Int J Urol. 2017. PMID: 28543959 Review.
Cited by
-
DNA Adductomics: A Narrative Review of Its Development, Applications, and Future.Biomolecules. 2024 Sep 19;14(9):1173. doi: 10.3390/biom14091173. Biomolecules. 2024. PMID: 39334939 Free PMC article. Review.
-
Screening DNA Damage in the Rat Kidney and Liver by Untargeted DNA Adductomics.Chem Res Toxicol. 2024 Feb 19;37(2):340-360. doi: 10.1021/acs.chemrestox.3c00333. Epub 2024 Jan 9. Chem Res Toxicol. 2024. PMID: 38194517 Free PMC article.
-
Aristolochic acid I induces proximal tubule injury through ROS/HMGB1/mt DNA mediated activation of TLRs.J Cell Mol Med. 2022 Aug;26(15):4277-4291. doi: 10.1111/jcmm.17451. Epub 2022 Jun 28. J Cell Mol Med. 2022. PMID: 35765703 Free PMC article.
-
LC-MS based urine untargeted metabolomic analyses to identify and subdivide urothelial cancer.Front Oncol. 2023 May 12;13:1160965. doi: 10.3389/fonc.2023.1160965. eCollection 2023. Front Oncol. 2023. PMID: 37256175 Free PMC article.
References
-
- Weinberg RA. The biology of cancer. 2. Garland science; 2013.
-
- Bearzatto A, Conte D, Frattini M, Zaffaroni N, Andriani F, Balestra D, Tavecchio L, Daidone MG, Sozzi G. p16(INK4A) Hypermethylation detected by fluorescent methylation-specific PCR in plasmas from non-small cell lung cancer. Clin Cancer Res. 2002;8(12):3782–3787. - PubMed
-
- Lee MG, Huh JS, Chung SK, Lee JH, Byun DS, Ryu BK, Kang MJ, Chae KS, Lee SJ, Lee CH, et al. Promoter CpG hypermethylation and downregulation of XAF1 expression in human urogenital malignancies: implication for attenuated p53 response to apoptotic stresses. Oncogene. 2006;25(42):5807–5822. - PubMed
-
- Martinez R, Setien F, Voelter C, Casado S, Quesada MP, Schackert G, Esteller M. CpG island promoter hypermethylation of the pro-apoptotic gene caspase-8 is a common hallmark of relapsed glioblastoma multiforme. Carcinogenesis. 2007;28(6):1264–1268. - PubMed
Grants and funding
LinkOut - more resources
Full Text Sources
Miscellaneous
