

Survival Trends of Right- and Left-Sided Colon Cancer across Four Decades: A Norwegian Population-Based Study
- PMID: 34853022
- PMCID: PMC9398128
- DOI: 10.1158/1055-9965.EPI-21-0555
Survival Trends of Right- and Left-Sided Colon Cancer across Four Decades: A Norwegian Population-Based Study
Abstract
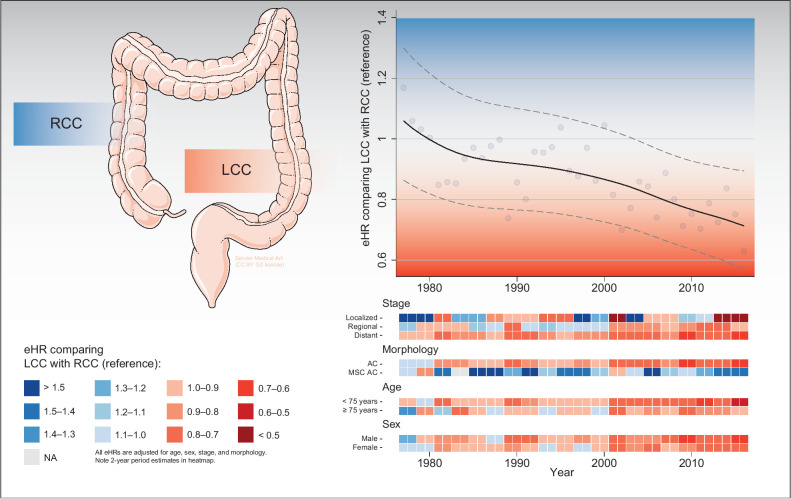
Background: Patients with right-sided colon cancer (RCC) and left-sided colon cancer (LCC) differ clinically and molecularly. The main objective was to investigate stage-stratified survival and recurrence of RCC and LCC across four 10-year periods.
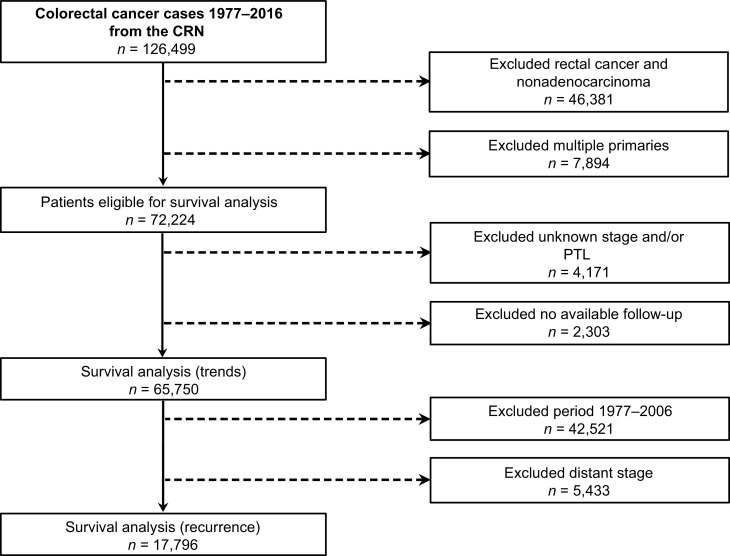
Methods: Patients diagnosed from 1977 to 2016 with colon adenocarcinoma were included from the Cancer Registry of Norway. Primary tumor location (PTL) was defined as RCC if proximal and LCC if distal to the splenic flexure. Multivariable regressions were used to estimate HRs for overall survival (OS), recurrence-free survival (RFS), survival after recurrence (SAR), and excess HRs (eHR) for relative survival (RS).
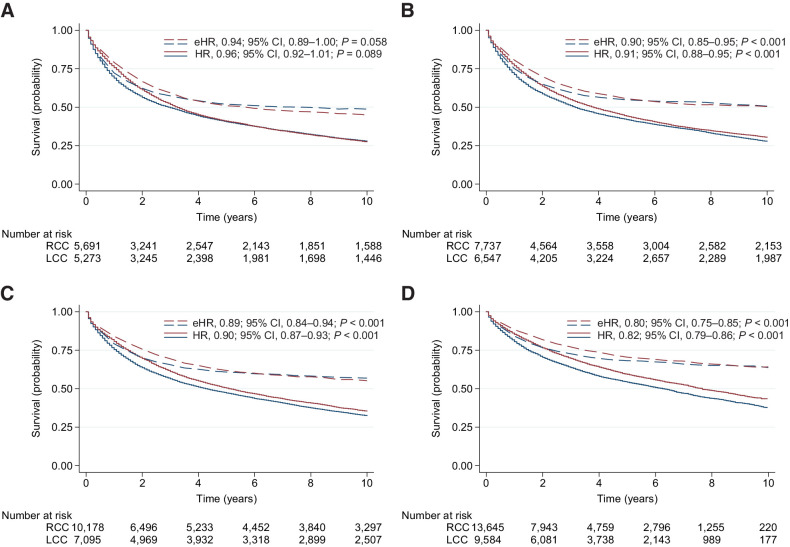
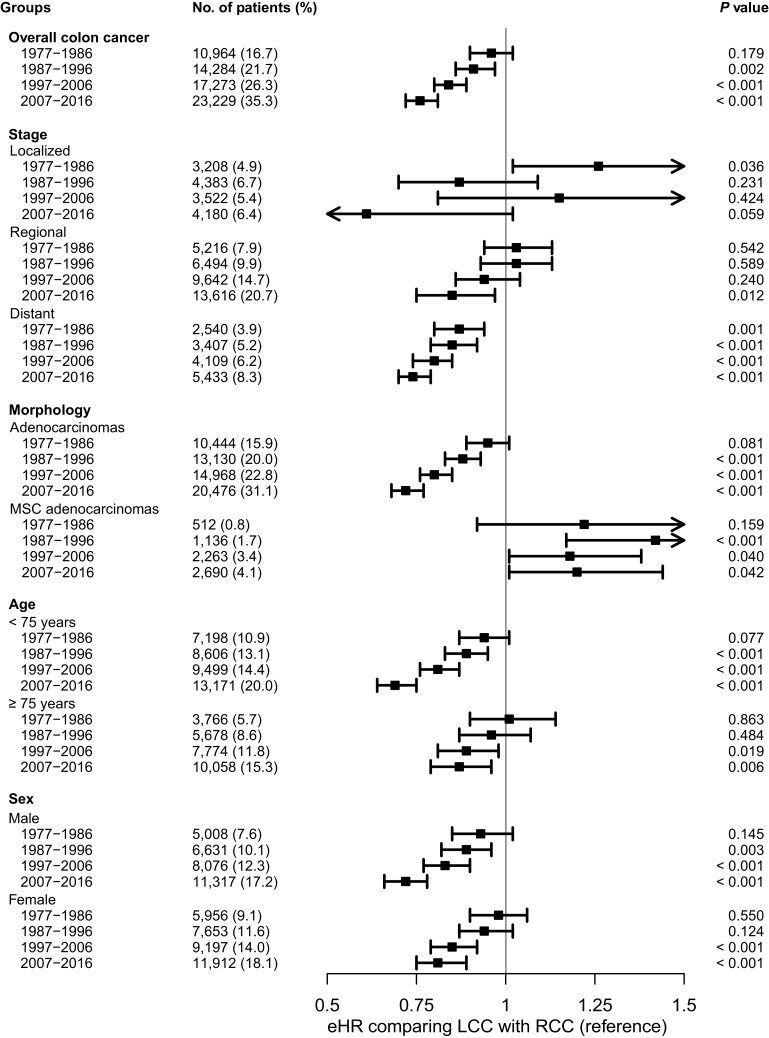
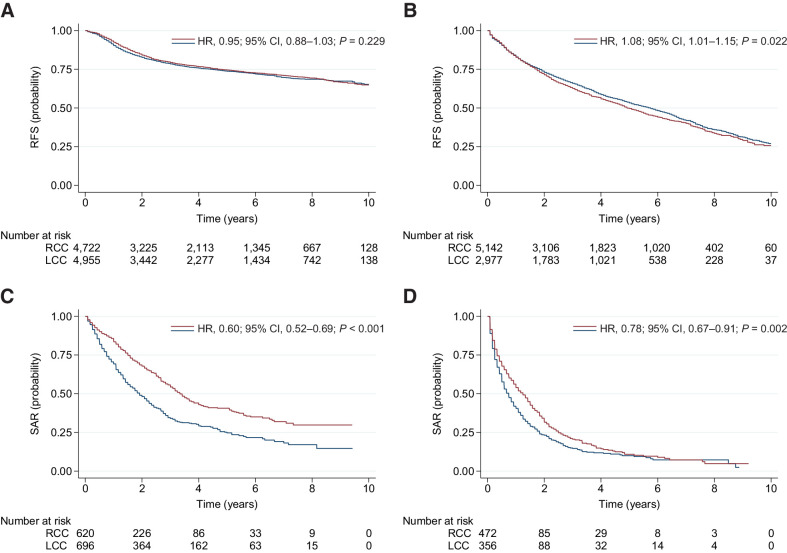
Results: 72,224 patients were eligible for analyses [55.1% (n = 39,769/72,224) had RCC]. In 1977 to 1986, there was no difference between LCC and RCC in OS [HR, 1.01; 95% confidence interval (CI), 0.97-1.06; P = 0.581] or RS (eHR, 0.96; 95% CI, 0.90-1.02; P = 0.179). In 2007 to 2016, LCC had significantly better OS (HR, 0.84; 95% CI, 0.80-0.87; P < 0.001) and RS (eHR, 0.76; 95% CI, 0.72-0.81; P < 0.001) compared with RCC. The gradually diverging and significantly favorable prognosis for LCC was evident for distant disease across all time periods and for regional disease from 2007 onward. There was no difference in RFS between LCC and RCC in patients less than 75 years during 2007 to 2016 (HR, 0.99; 95% CI, 0.91-1.08; P = 0.819); however, SAR was significantly better for LCC (HR, 0.61; 95% CI, 0.53-0.71; P < 0.001).
Conclusions: A gradually diverging and increasingly favorable prognosis was observed for patients with LCC with advanced disease over the past four decades.
Impact: Current PTL survival disparities stress the need for further exploring targetable molecular subgroups across and within different PTLs to further improve patient outcomes.
©2021 The Authors; Published by the American Association for Cancer Research.
Figures
Similar articles
-
The impact of primary tumor sidedness on survival in early-onset colorectal cancer by stage: A National Veterans Affairs retrospective analysis.Cancer Med. 2021 May;10(9):2987-2995. doi: 10.1002/cam4.3757. Epub 2021 Apr 2. Cancer Med. 2021. PMID: 33797856 Free PMC article.
-
The effects of chemotherapy, primary tumor location and histological subtype on the survival of stage III colon cancer patients.BMC Gastroenterol. 2023 Apr 5;23(1):110. doi: 10.1186/s12876-023-02741-3. BMC Gastroenterol. 2023. PMID: 37020295 Free PMC article.
-
[Effects of tumor location and mismatch repair on clinicopathological features and survival for non-metastatic colon cancer: A retrospective, single center, cohort study].Zhonghua Wei Chang Wai Ke Za Zhi. 2024 Jun 25;27(6):591-599. doi: 10.3760/cma.j.cn441530-20231019-00140. Zhonghua Wei Chang Wai Ke Za Zhi. 2024. PMID: 38901992 Chinese.
-
Prognostic value of primary tumor location in colorectal cancer: an updated meta-analysis.Clin Exp Med. 2023 Dec;23(8):4369-4383. doi: 10.1007/s10238-023-01120-2. Epub 2023 Jul 5. Clin Exp Med. 2023. PMID: 37405571 Review.
-
Differences in clinical features and oncologic outcomes between metastatic right and left colon cancer.J BUON. 2018 Dec;23(7):11-18. J BUON. 2018. PMID: 30722106 Review.
Cited by
-
Survival trends for left and right sided colon cancer using population-based SEER database: A forty-five-year analysis from 1975 to 2019.Cancer Med. 2024 Apr;13(8):e7145. doi: 10.1002/cam4.7145. Cancer Med. 2024. PMID: 38651190 Free PMC article.
-
Influence of Sex and Age on Site of Onset, Morphology, and Site of Metastasis in Colorectal Cancer: A Population-Based Study on Data from Four Italian Cancer Registries.Cancers (Basel). 2023 Jan 28;15(3):803. doi: 10.3390/cancers15030803. Cancers (Basel). 2023. PMID: 36765761 Free PMC article.
-
Impact of Primary Tumor Location on Demographics, Resectability, Outcomes, and Quality of Life in Finnish Metastatic Colorectal Cancer Patients (Subgroup Analysis of the RAXO Study).Cancers (Basel). 2024 Mar 5;16(5):1052. doi: 10.3390/cancers16051052. Cancers (Basel). 2024. PMID: 38473410 Free PMC article.
-
Best Evidence for Each Surgical Step in Minimally Invasive Right Hemicolectomy: A Systematic Review.Ann Surg Open. 2023 Oct 5;4(4):e343. doi: 10.1097/AS9.0000000000000343. eCollection 2023 Dec. Ann Surg Open. 2023. PMID: 38144490 Free PMC article. Review.
References
-
- Bray F, Ferlay J, Soerjomataram I, Siegel RL, Torre LA, Jemal A. Global cancer statistics 2018: GLOBOCAN estimates of incidence and mortality worldwide for 36 cancers in 185 countries. CA Cancer J Clin 2018;68:394–424. - PubMed
-
- Lee MS, Menter DG, Kopetz S. Right versus left colon cancer biology: integrating the consensus molecular subtypes. J Natl Compr Canc Netw 2017;15:411–9. - PubMed
-
- Li Y, Feng Y, Dai W, Li Q, Cai S, Peng J. Prognostic effect of tumor sidedness in colorectal cancer: a SEER-based analysis. Clin Colorectal Cancer 2019;18:e104–e16. - PubMed
Publication types
MeSH terms
LinkOut - more resources
Full Text Sources
Miscellaneous
