. 2022 Feb 15;82(4):648-664.
doi: 10.1158/0008-5472.CAN-21-1705.

Multiomics Analysis of Spatially Distinct Stromal Cells Reveals Tumor-Induced O-Glycosylation of the CDK4-pRB Axis in Fibroblasts at the Invasive Tumor Edge

Affiliations

Multiomics Analysis of Spatially Distinct Stromal Cells Reveals Tumor-Induced O-Glycosylation of the CDK4-pRB Axis in Fibroblasts at the Invasive Tumor Edge

Gina Bouchard et al. Cancer Res. .

Abstract

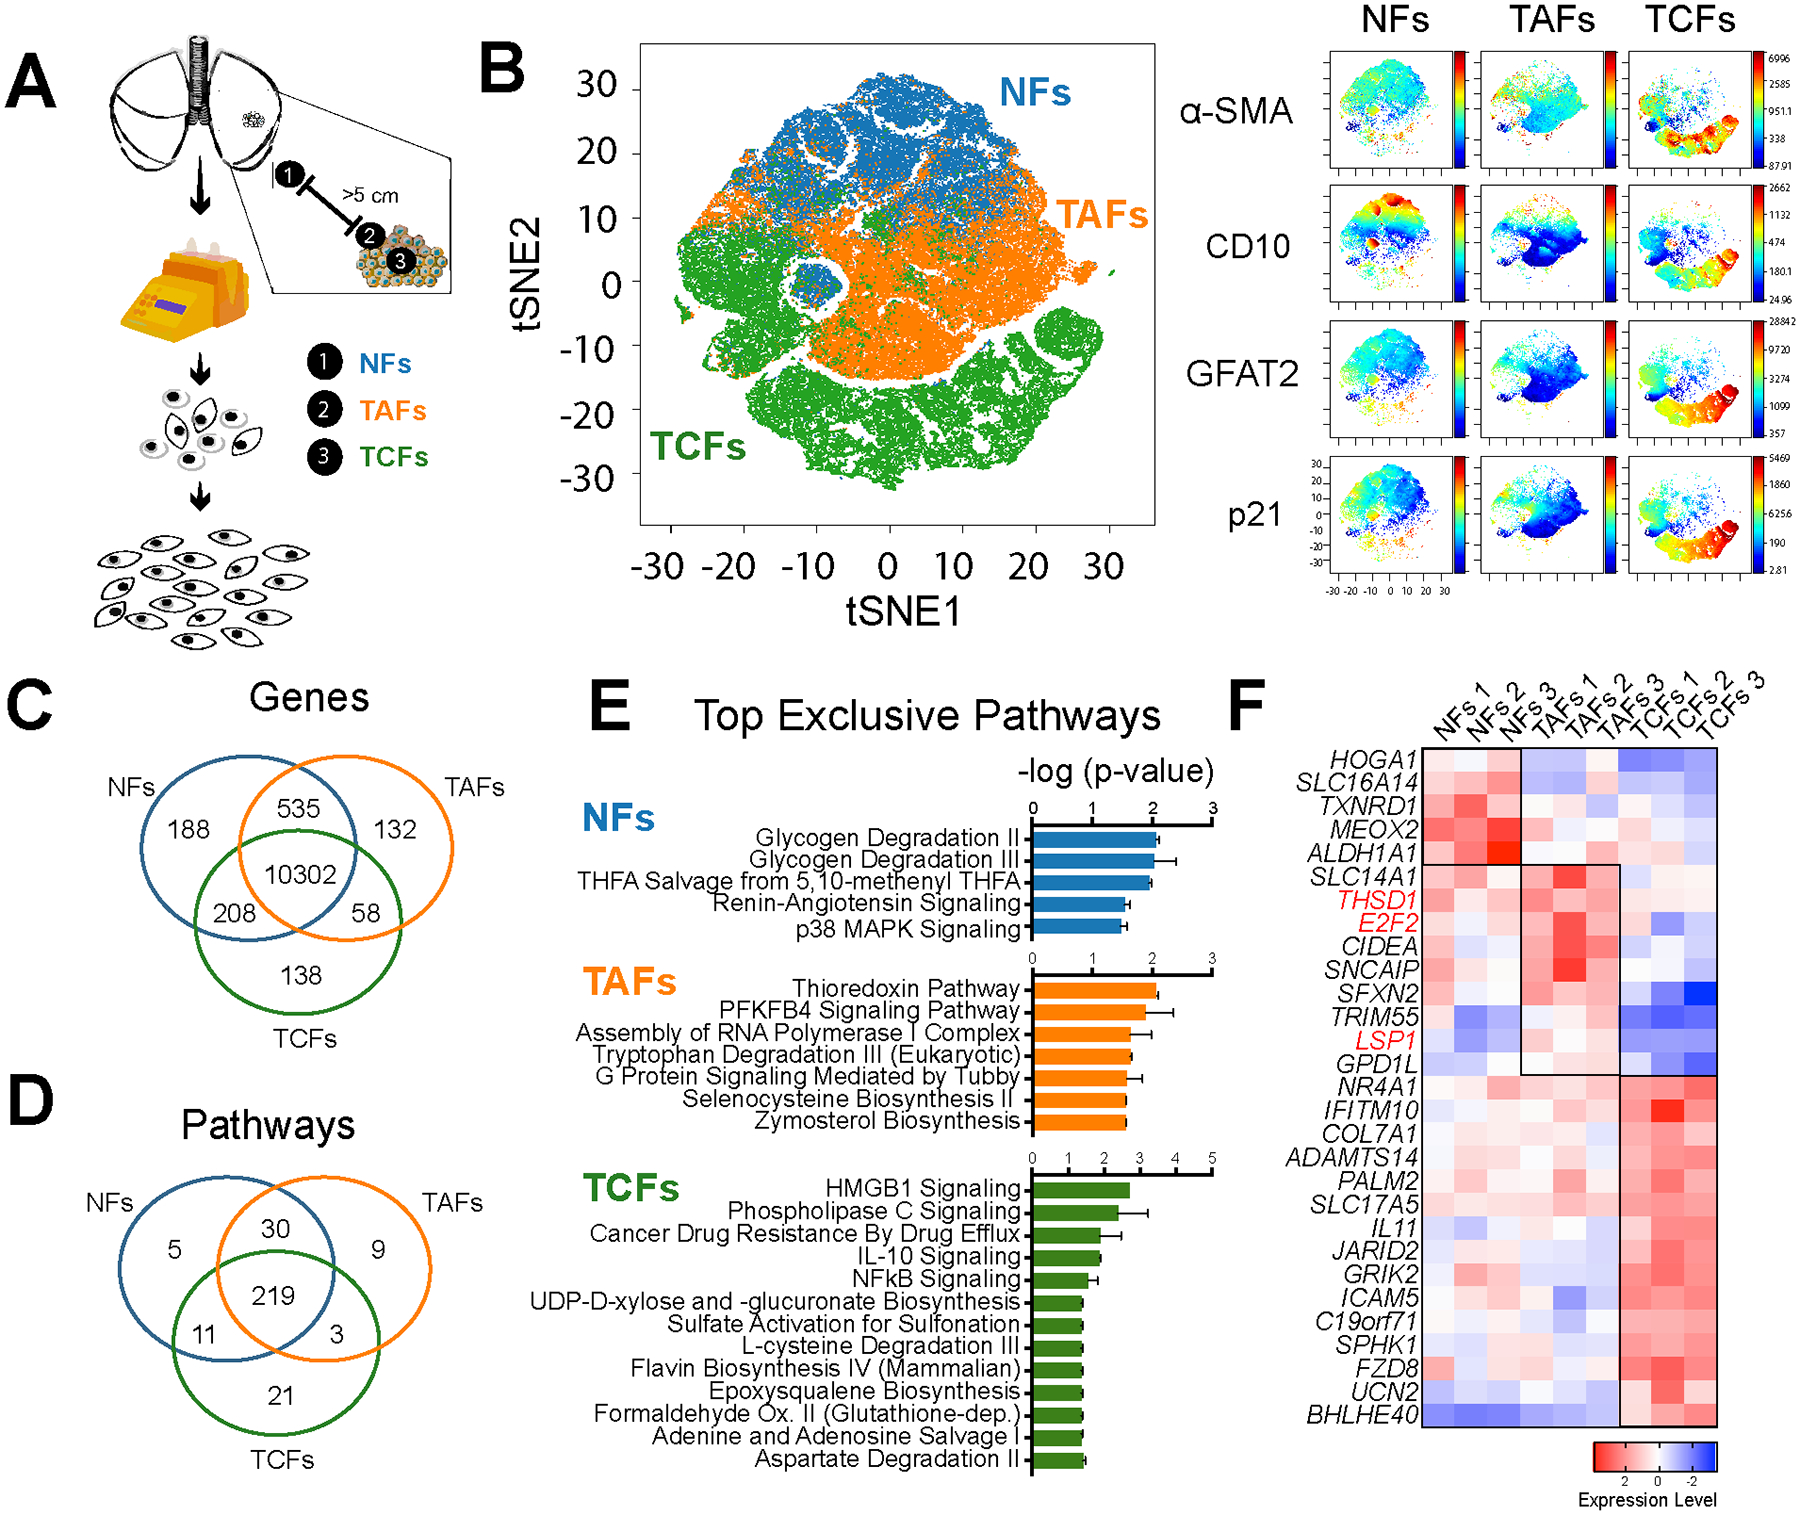
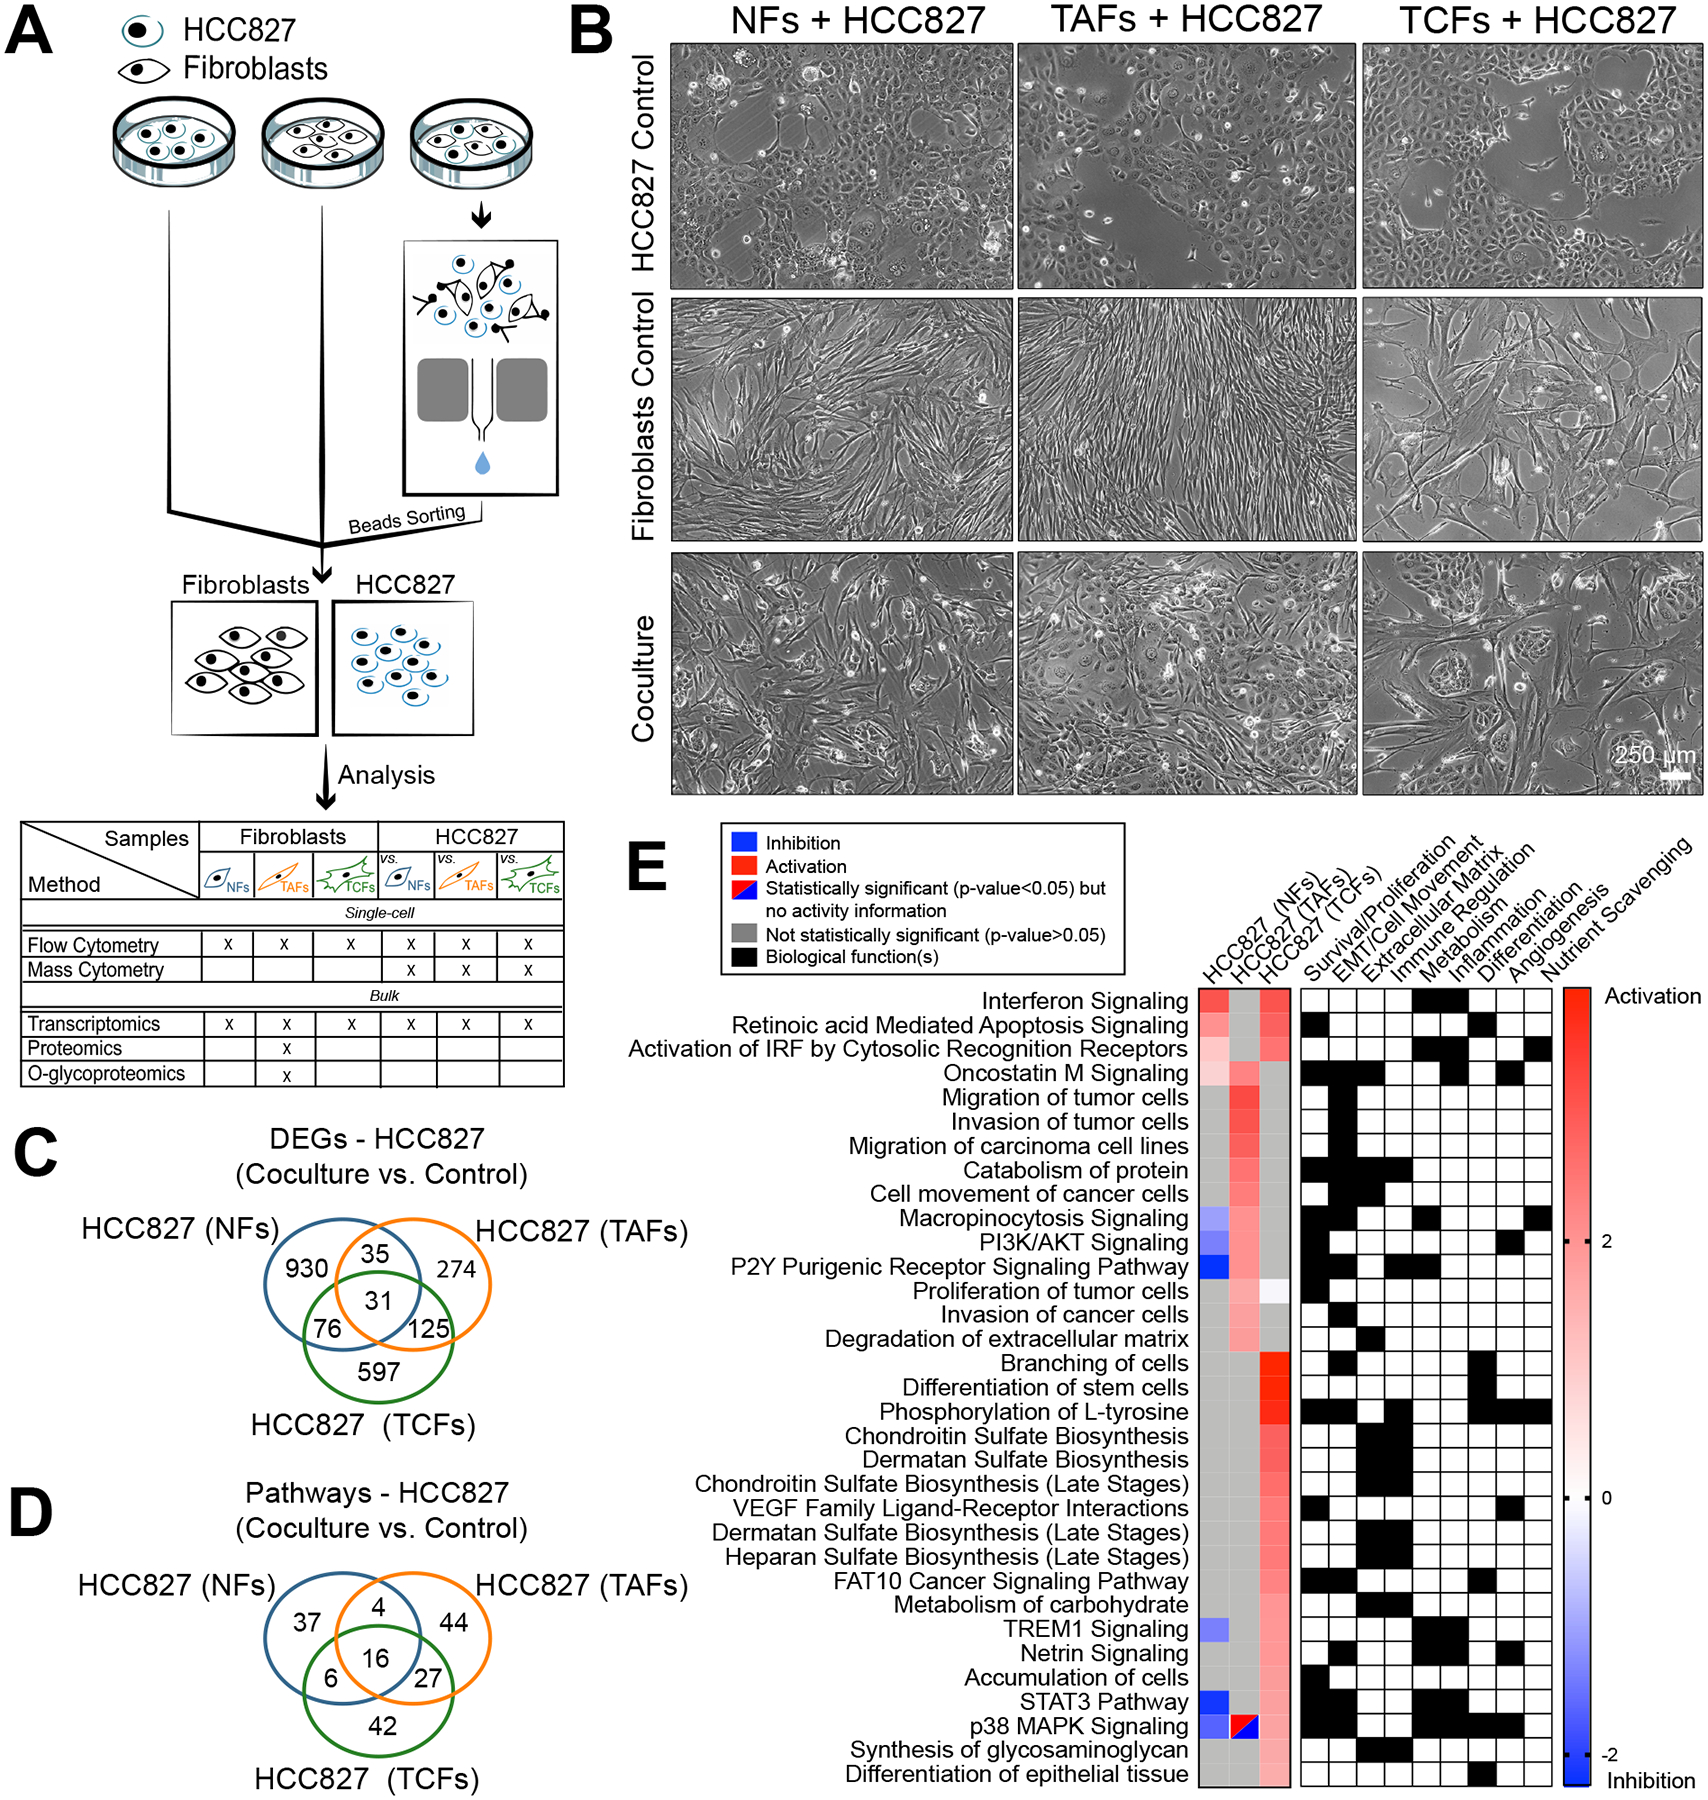
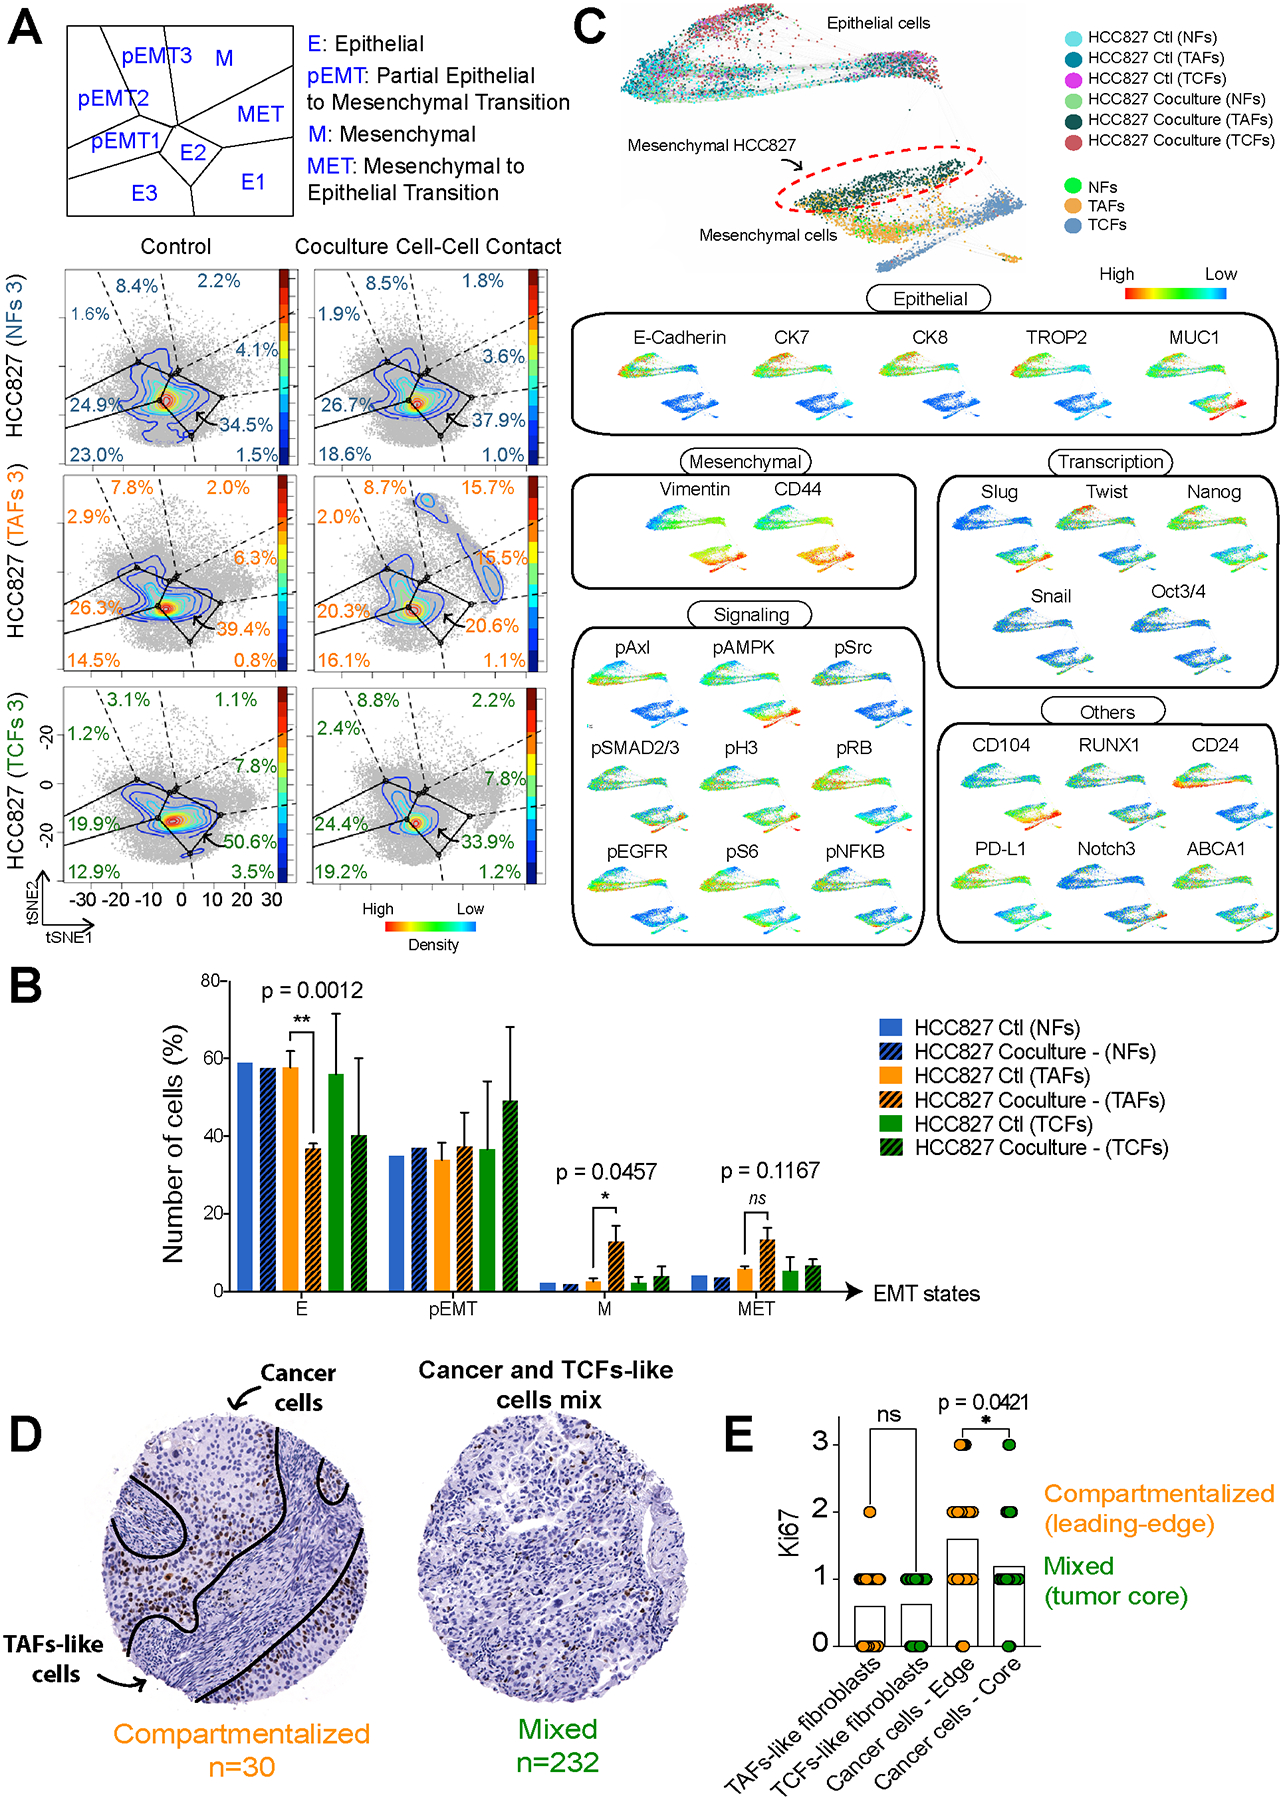
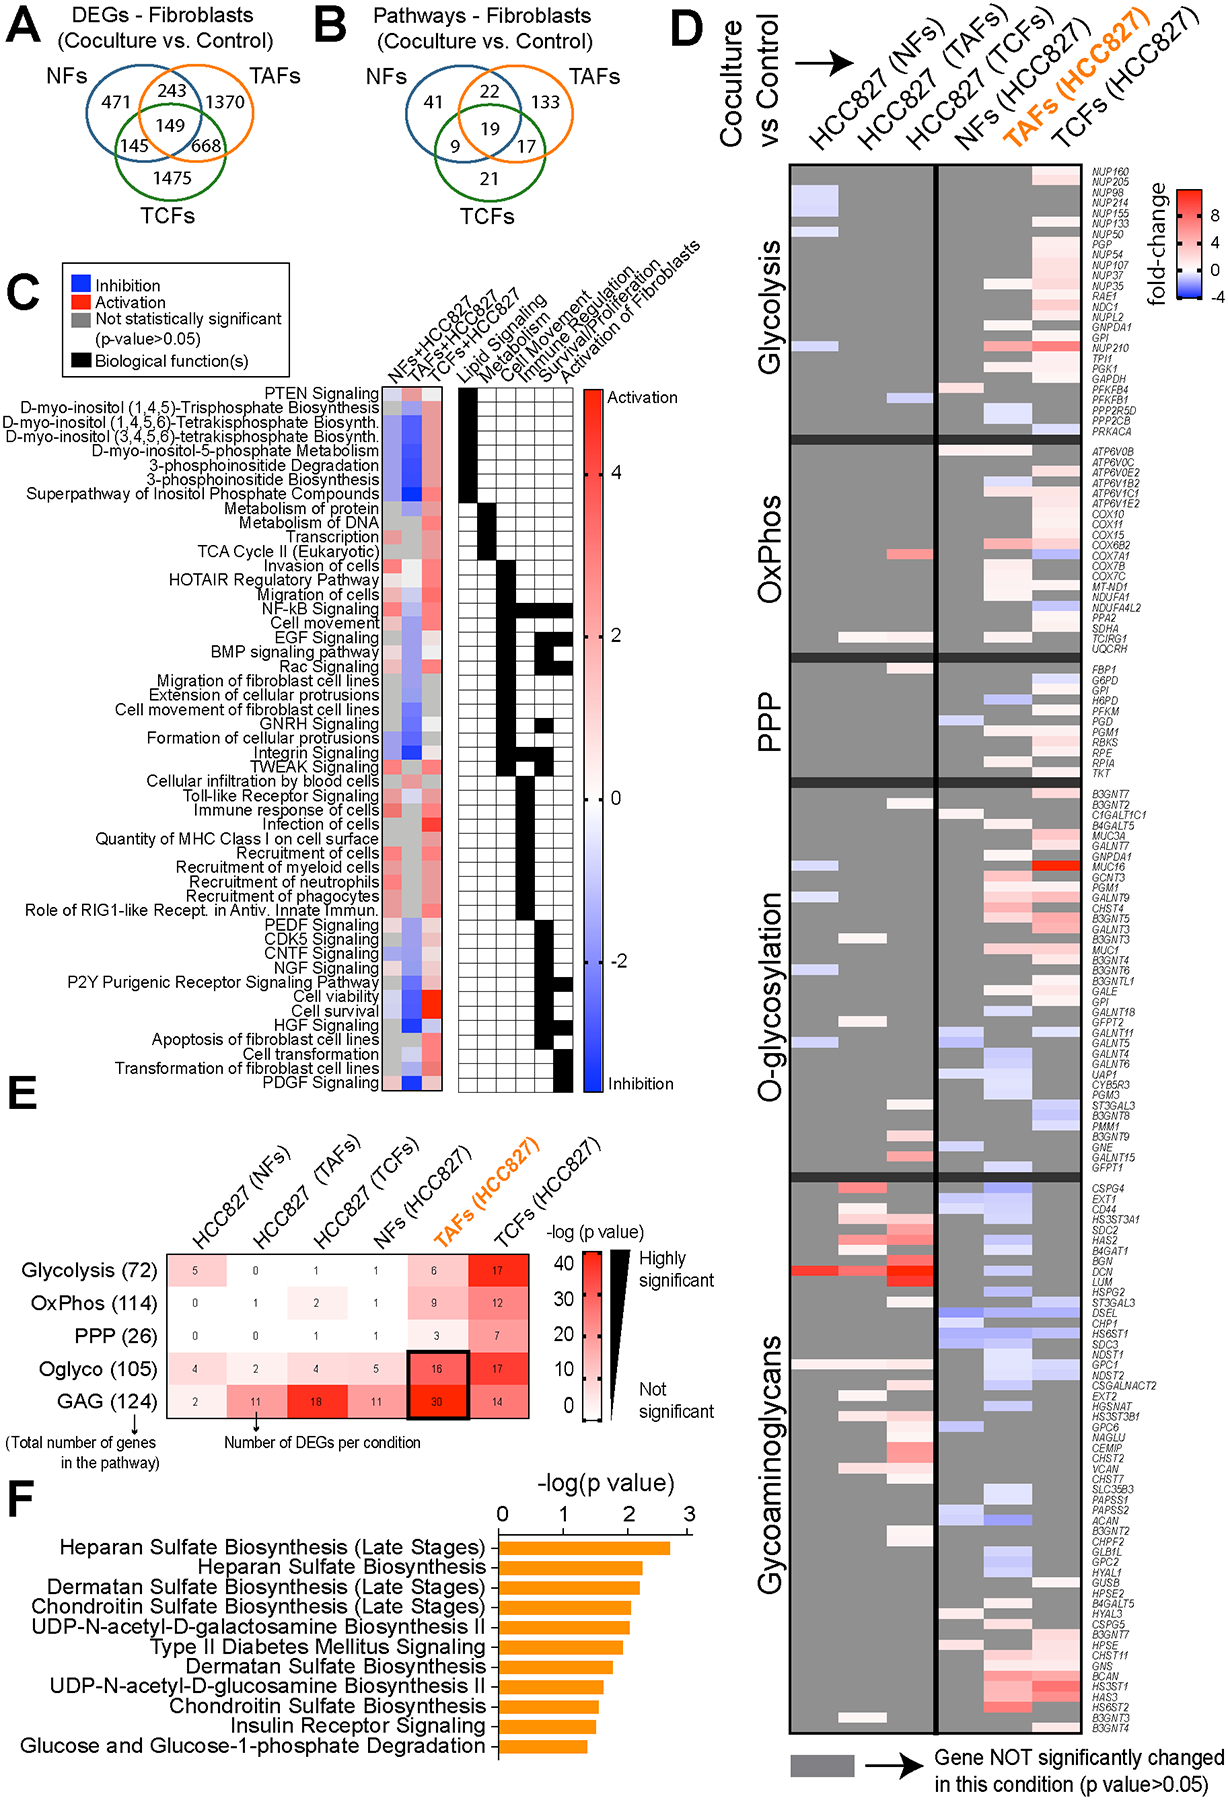
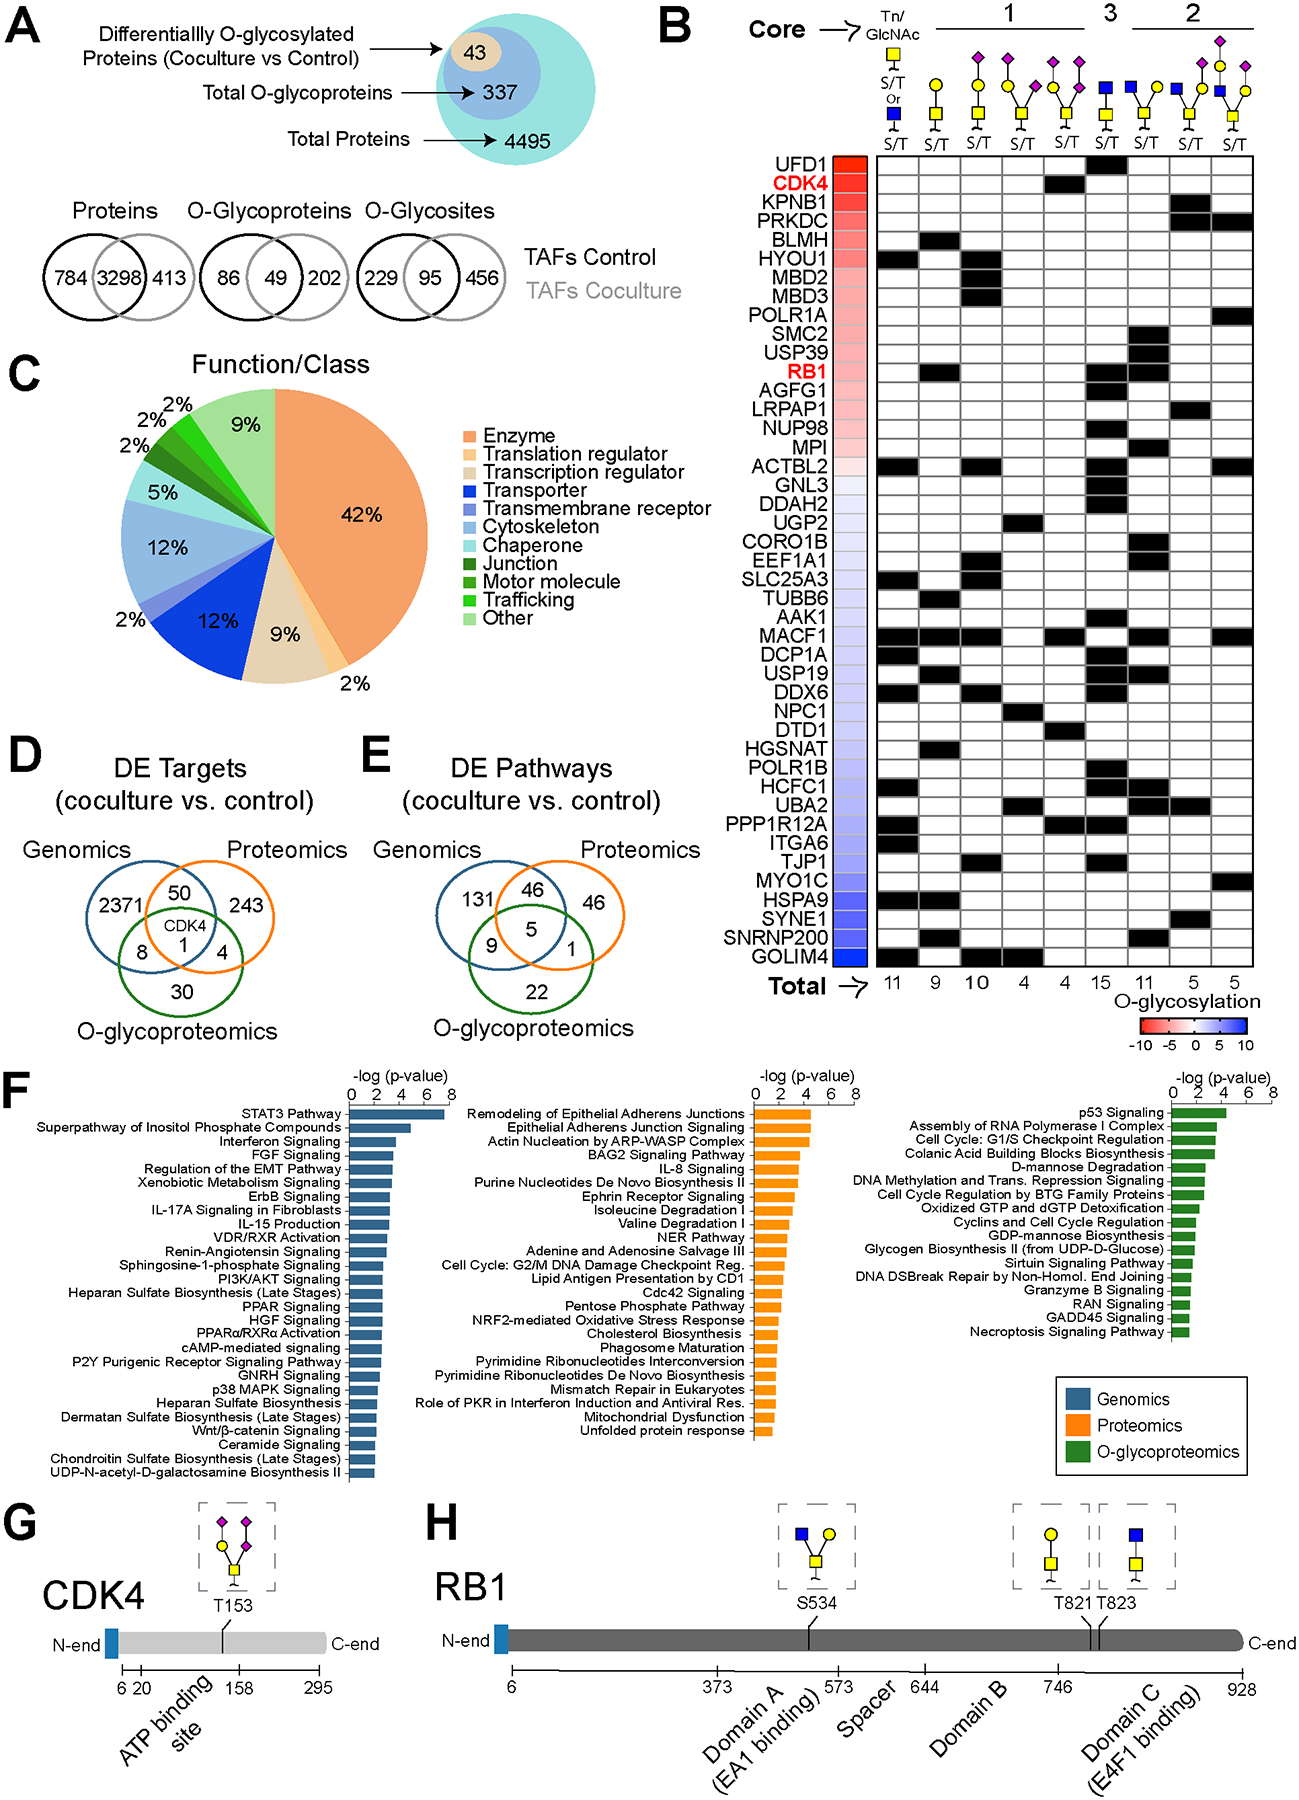
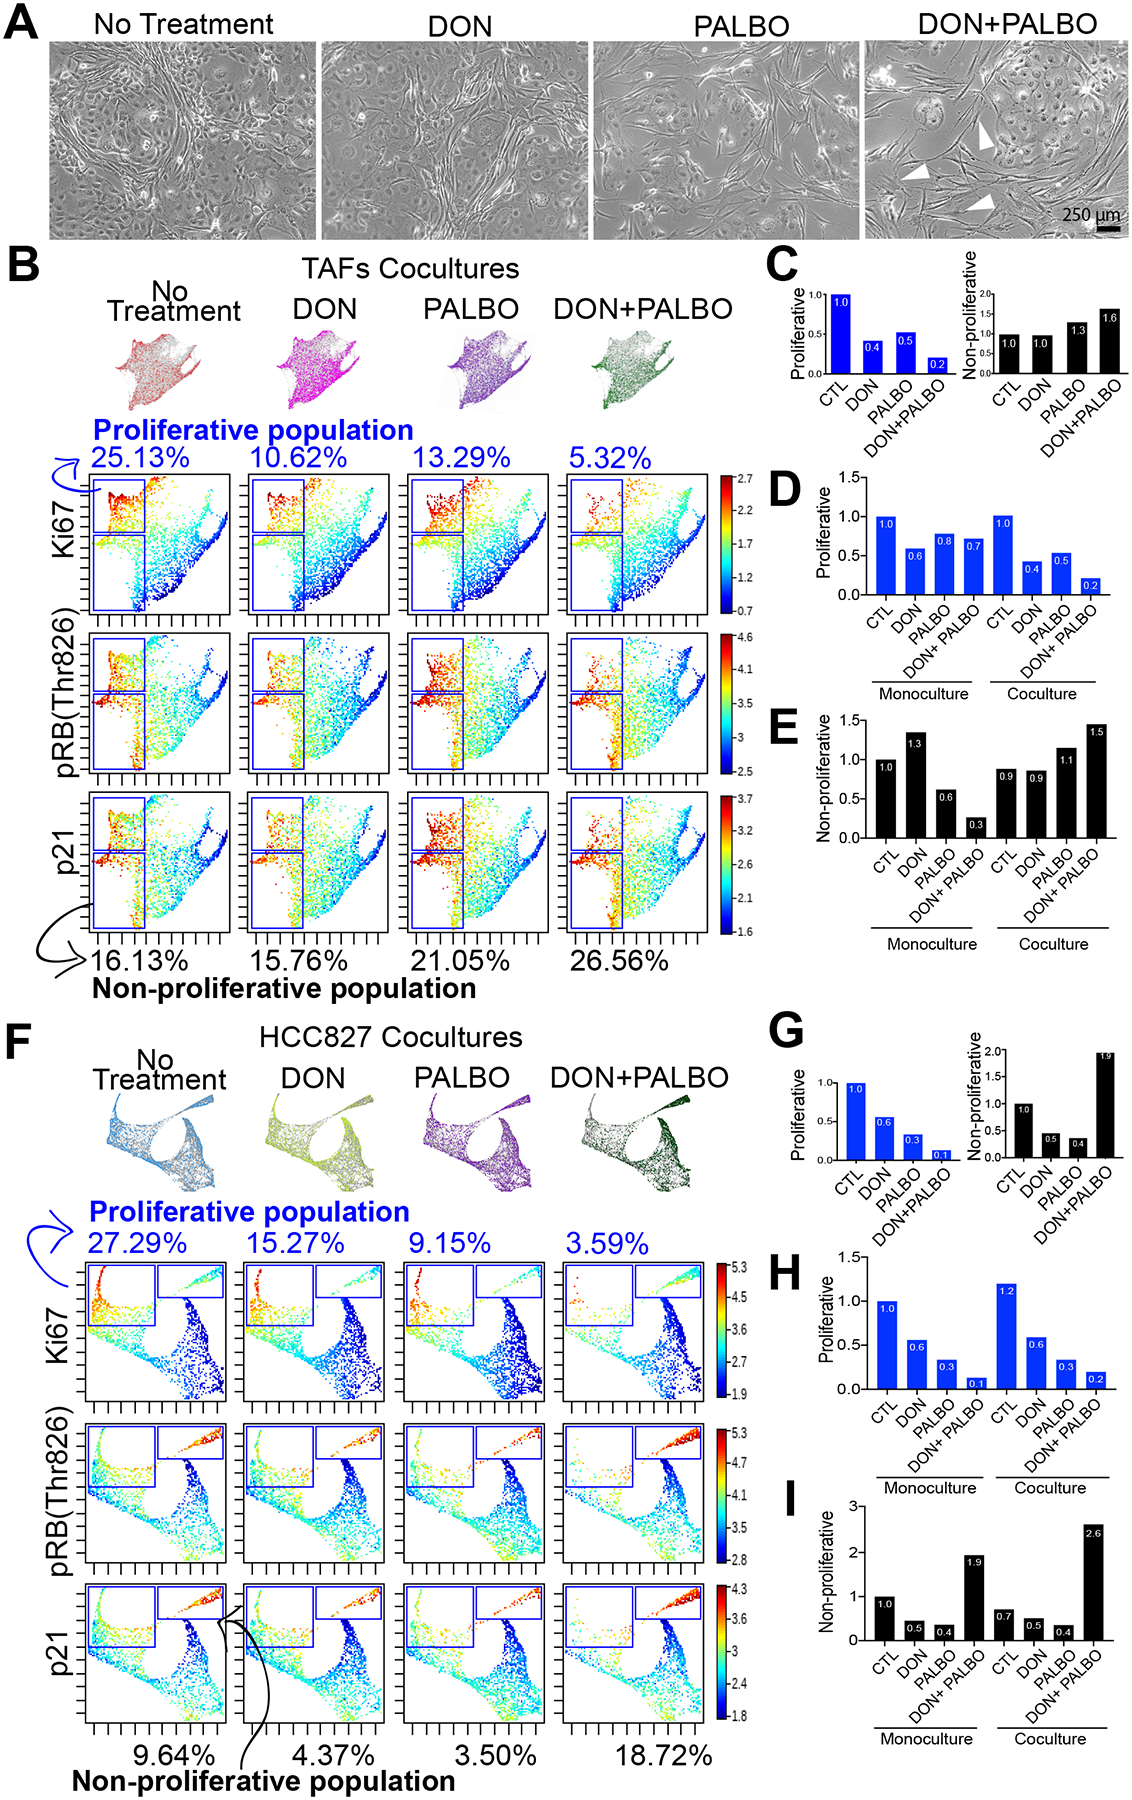
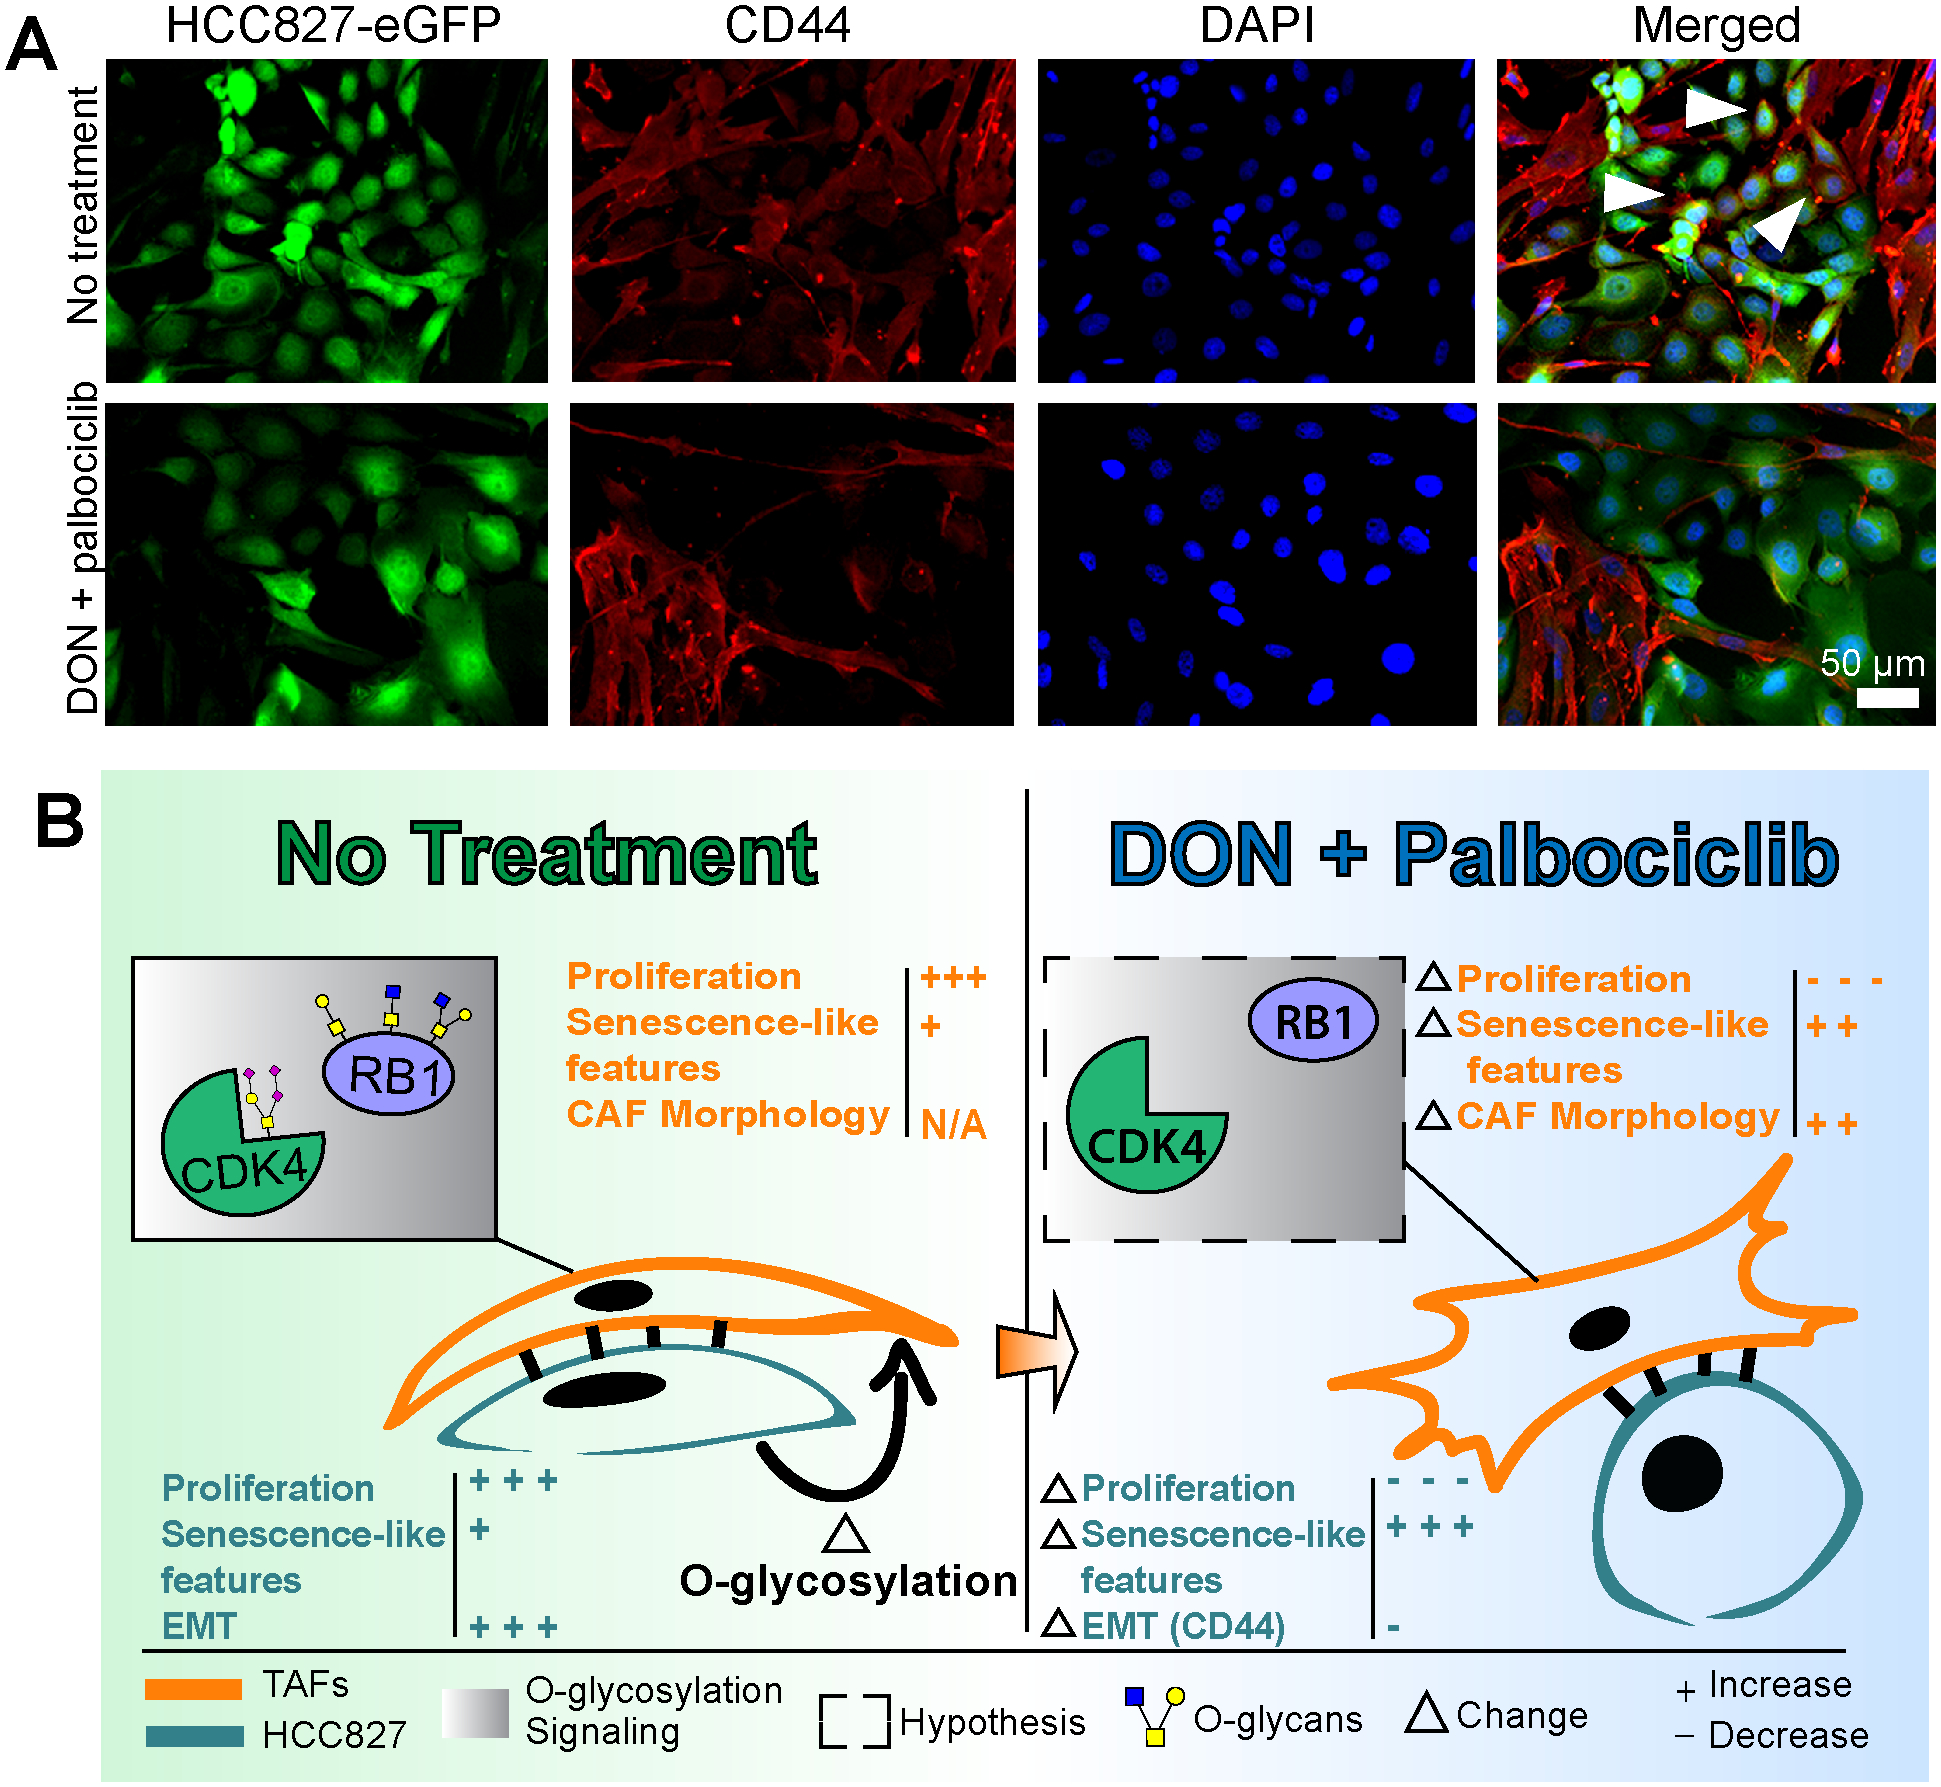
The invasive leading edge represents a potential gateway for tumor metastasis. The role of fibroblasts from the tumor edge in promoting cancer invasion and metastasis has not been comprehensively elucidated. We hypothesize that cross-talk between tumor and stromal cells within the tumor microenvironment results in activation of key biological pathways depending on their position in the tumor (edge vs. core). Here we highlight phenotypic differences between tumor-adjacent-fibroblasts (TAF) from the invasive edge and tumor core fibroblasts from the tumor core, established from human lung adenocarcinomas. A multiomics approach that includes genomics, proteomics, and O-glycoproteomics was used to characterize cross-talk between TAFs and cancer cells. These analyses showed that O-glycosylation, an essential posttranslational modification resulting from sugar metabolism, alters key biological pathways including the cyclin-dependent kinase 4 (CDK4) and phosphorylated retinoblastoma protein axis in the stroma and indirectly modulates proinvasive features of cancer cells. In summary, the O-glycoproteome represents a new consideration for important biological processes involved in tumor-stroma cross-talk and a potential avenue to improve the anticancer efficacy of CDK4 inhibitors.

Significance: A multiomics analysis of spatially distinct fibroblasts establishes the importance of the stromal O-glycoproteome in tumor-stroma interactions at the leading edge and provides potential strategies to improve cancer treatment. See related commentary by De Wever, p. 537.


Conflict of interest statement

Competing interests

The authors declare no competing interests.

Figures

Figure 1.
Figure 1.. Analysis of LUAD fibroblasts derived from different tumor regions.
A, Fibroblast expansion workflow of LUAD fresh specimens. B, Phase contrast microscopy images of NFs, TAFs and TCFs. Specimen 2 is displayed here. C, Representative viSNE analysis of NFs, TAFs and TCFs, using α-SMA, FSP1, GFAT2, CD10, p21 and vimentin as clustering markers. Other biological replicates are available in Supplementary Fig. S1C. Venn diagram showing the gene overlap measured by RNAseq (TPM >1 in all biological replicates of each subtype). D, Venn diagram showing pathway overlap (E) and bar graph (F), showing the top exclusive pathways in NFs (n=3), TAFs (n=3) and TCFs (n=3), analyzed with Ingenuity Pathway Analysis software. G, Heatmap showing relative normalized gene expression of top DEGs in NFs, TAFs and TCFs.
Figure 2.
Figure 2.. RNAseq analysis of HCC827 after coculture with NFs, TAFs and TCFs.
A, Coculture, cell separation and downstream analysis workflow. B, Phase contrast microscopy images of NFs, TAFs and TCFs cocultures from specimen 2 with HCC827 lung adenocarcinoma cell line. Biological replicates are available at Supplementary Fig. S2A. C, Venn diagram showing the gene overlap between HCC827 cocultures with NFs (n=3), TAFs (n=3) and TCFs (n=3) compared to their monoculture control measured by RNAseq (p < 0.05, fold-change > 0.5). Venn diagram showing the pathways overlap and (D), heatmap showing the main pathways/biological functions differences between HCC827 cocultures with NFs (n=3), TAFs (n=3) and TCFs (n=3) compared to their monoculture control (E) analyzed with the IPA software.
Figure 3.
Figure 3.. CyTOF analysis of HCC827 after coculture with NFs, TAFs and TCFs.
Projections of the HCC827 monoculture controls and matched cocultures after cell-cell contact with NFs, TAFs and TCFs onto the EMT–MET PHENOSTAMP phenotypic map (A) and bar graph quantification (B) of the number of cells in each region of the map. C, Single-cell force-directed layout colored by protein expression of indicated markers of HCC827 cocultures with NFs, TAFs and TCFs using X-shift clustering (arcsinh transformed data of specimen 3). See Supplementary Fig. S3C for expression scale bars and S3D and S3E for biological replicates. D, IHC representative examples of LUAD specimens from the lung TMA showing compartmentalized and mixed samples and (E) Ki67 quantification of fibroblasts and cancer cells.
Figure 4.
Figure 4.. Gene expression analysis of NFs, TAFs and TCFs after coculture with HCC827 lung adenocarcinoma cancer cells.
A, Venn diagram showing the gene overlap between NFs (n=3), TAFs (n=3) and TCFs (n=3) cocultures with HCC827 compared to their monoculture control measured by RNAseq analysis (p < 0.05, fold-change > 0.5). Venn diagram showing pathway overlap (B), heatmap showing the main pathways/biological functions differences analyzed with the IPA software (C) and heatmap showing the fold-change of DEGs in the main glucose metabolic pathways between NFs (n=3), TAFs (n=3) and TCFs (n=3) cocultures with HCC827, (D) and heatmap showcasing the number of overlap genes between DEGs in each condition and within each metabolic pathway (E). Color of heatmap represents -log(p-value) of the gene overlap calculated using a hypergeometric test. The numbers in parentheses show the total number of genes from each MSigDB gene set and tile numbers show the number of DEGs for each condition. See p values at Supplementary Fig. S4G. F, Bar graph showing exclusive pathways related to glycans biosynthesis enriched in TAFs cocultures compared to their monoculture control and analyzed with the IPA software.
Figure 5.
Figure 5.. Crosstalk with HCC827 alters the TAFs O-glycoproteome.
A, Venn diagram showing proteins, O-glycoproteins and O-glycosites found in TAFs monocultures and cocultures analyzed by mass spectrometry. B, Pie charts showing the main classes of the differentially O-glycosylated proteins after coculture identified by mass spectrometry. C, Heat map and summary table of the differentially O-glycosylated proteins and glycan heterogeneity after coculture with HCC827. Venn Diagram showing the overlap of targets (D) and the DE pathways identified in TAFs cocultures (relative to control monoculture) (E) using different methods of analysis. F, Bar graph highlighting a sample of the top enriched pathways in TAFs cocultures at the genomic, proteomic and O-glycoproteomic levels. CDK4 (G) and RB1 (H) protein domains and O-glycan positions.
Figure 6.
Figure 6.. O-glycosylation of the CDK4-Rb axis in TAFs modulates Palbociclib efficacy.
A, Phase-contrast microcopy of TAFs:HCC827 cocultures treated with 10 μM DON, 1 μM palbociclib or a combination of both. White arrowheads show examples of TAFs that have gained an activated TCFs-like morphology. B, Force-directed layout of TAFs cocultures showing proliferative (upper gate) and non-proliferative (lower gate) TAFs and (C) bar graph quantification of percentage ratios relative to non-treated cocultures. Bar graph quantification showing all conditions of TAFs mono- and cocultures relative to untreated monoculture for (D) proliferative and (E) non-proliferative TAFs. Force-directed layout of HCC827 cocultures showing proliferative (left gate) and non-proliferative (right gate) cancer cells (F) and bar graph quantification of percentage ratios relative to non-treated cocultures. G, Bar graph quantification showing all conditions of HCC827 mono- and cocultures relative to non-treated monoculture for (H) proliferative and (I) non-proliferative cancer cells. Results are from two independent experiments with biological replicates combined (TAFs from specimens 1 and 3).
Figure 7.
Figure 7.. Decreased O-glycosylation with DON treatment indirectly prevents EMT in HCC827.
A, Immunofluorescence staining of HCC827-eGFP:TAFs coculture showing a decrease of the mesenchymal marker CD44 in cancer cells after treatment with DON and palbociclib. Cancer cells are represented by green pseudo color. TAFs are represented by red pseudo color only. CD44+ cancer cells are represented by co-staining with green and red pseudo colors. White arrowheads represent examples of CD44+ cancer cells. B, Summary figure of the main findings of the study showing that EMT in HCC827 and O-glycosylation of the CDK4-pRB axis in the stroma are induced in TAFs:HCC827 cocultures; this is prevented with the combination treatment of DON and palbociclib.

Comment in

References

    1. Deryugina EI, Kiosses WB, Jolla L, Facility MC, Jolla L. Intratumoral Cancer Cell Intravasation can occur Independent of Invasion into the Adjacent Stroma. Cell Rep. 2017;19:601–16. - PMC - PubMed
    1. Kalluri R The biology and function of fibroblasts in cancer. Nat Publ Gr. 2016;16. - PubMed
    1. Ishii G, Ochiai A, Neri S. Phenotypic and functional heterogeneity of cancer-associated fibroblast within the tumor microenvironment. Adv Drug Deliv Rev. Elsevier B.V; 2016;99:186–96. - PubMed
    1. Bu L, Baba H, Yoshida N, Miyake K, Yasuda T, Uchihara T, et al. Biological heterogeneity and versatility of cancer-associated fibroblasts in the tumor microenvironment. Oncogene. Springer US; 2019; - PubMed
    1. Özdemir BC, Pentcheva-Hoang T, Carstens JL, Zheng X, Wu CC, Simpson TR, et al. Depletion of carcinoma-associated fibroblasts and fibrosis induces immunosuppression and accelerates pancreas cancer with reduced survival. Cancer Cell. 2014;25:719–34. - PMC - PubMed

Publication types

MeSH terms