. 2022 Jan 15;82(2):334-345.
doi: 10.1158/0008-5472.CAN-21-2843. Epub 2021 Dec 1.

Prostate Cancer Risk Stratification via Nondestructive 3D Pathology with Deep Learning-Assisted Gland Analysis

Affiliations

Prostate Cancer Risk Stratification via Nondestructive 3D Pathology with Deep Learning-Assisted Gland Analysis

Weisi Xie et al. Cancer Res. .

Abstract

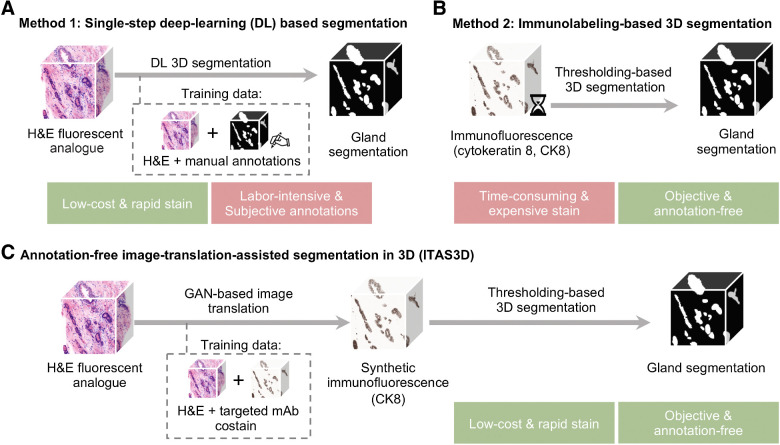
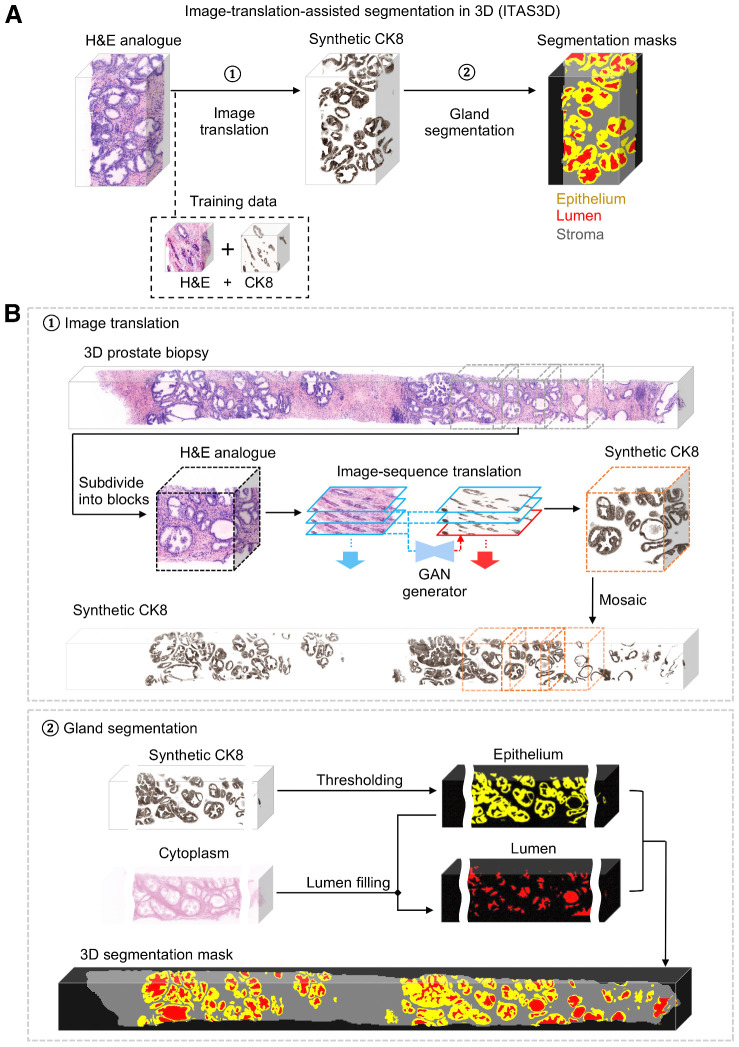
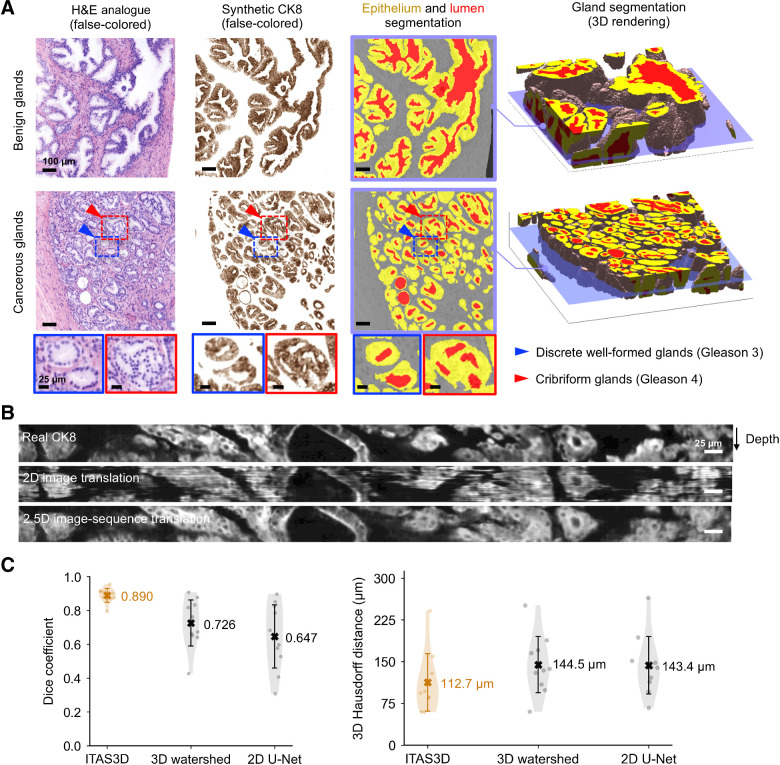
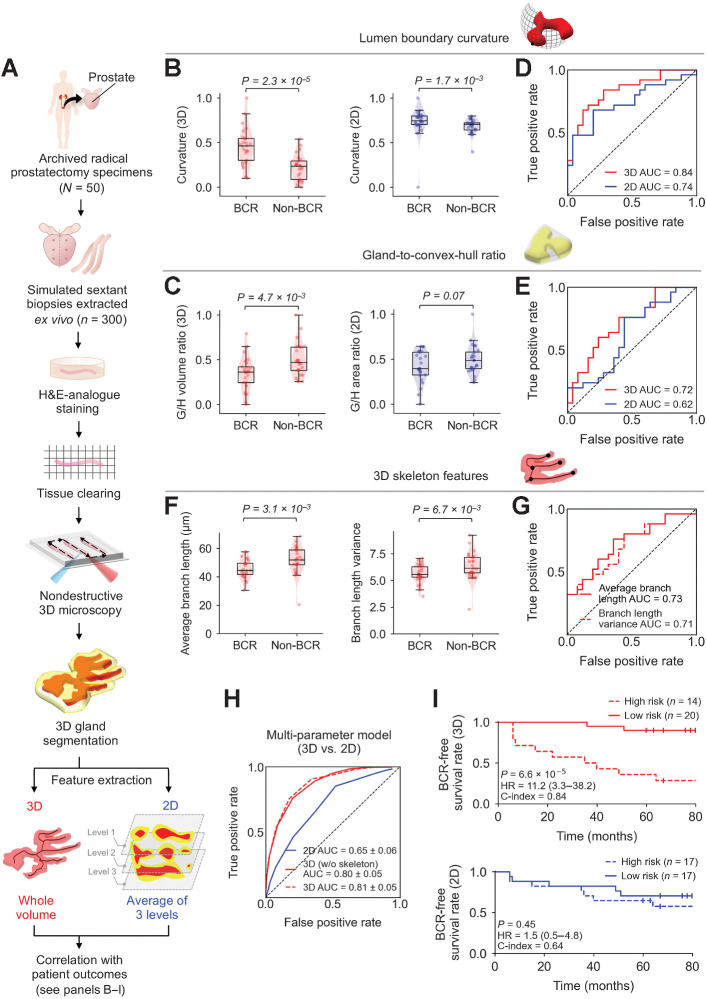
Prostate cancer treatment planning is largely dependent upon examination of core-needle biopsies. The microscopic architecture of the prostate glands forms the basis for prognostic grading by pathologists. Interpretation of these convoluted three-dimensional (3D) glandular structures via visual inspection of a limited number of two-dimensional (2D) histology sections is often unreliable, which contributes to the under- and overtreatment of patients. To improve risk assessment and treatment decisions, we have developed a workflow for nondestructive 3D pathology and computational analysis of whole prostate biopsies labeled with a rapid and inexpensive fluorescent analogue of standard hematoxylin and eosin (H&E) staining. This analysis is based on interpretable glandular features and is facilitated by the development of image translation-assisted segmentation in 3D (ITAS3D). ITAS3D is a generalizable deep learning-based strategy that enables tissue microstructures to be volumetrically segmented in an annotation-free and objective (biomarker-based) manner without requiring immunolabeling. As a preliminary demonstration of the translational value of a computational 3D versus a computational 2D pathology approach, we imaged 300 ex vivo biopsies extracted from 50 archived radical prostatectomy specimens, of which, 118 biopsies contained cancer. The 3D glandular features in cancer biopsies were superior to corresponding 2D features for risk stratification of patients with low- to intermediate-risk prostate cancer based on their clinical biochemical recurrence outcomes. The results of this study support the use of computational 3D pathology for guiding the clinical management of prostate cancer. SIGNIFICANCE: An end-to-end pipeline for deep learning-assisted computational 3D histology analysis of whole prostate biopsies shows that nondestructive 3D pathology has the potential to enable superior prognostic stratification of patients with prostate cancer.


Figures

Figure 1. General methods for 3D gland segmentation. A, A single-step DL segmentation model can be trained with imaging datasets of tissues labeled with a fluorescent analogue of H&E paired with manually annotated ground-truth segmentation masks. While H&E analogue staining is low-cost and rapid, manual annotations are labor-intensive (especially in 3D) and based on subjective human judgements. B, By immunolabeling a tissue microstructure with high specificity, 3D segmentations can be achieved with traditional CV methods without the need for manual annotations. While this is an objective segmentation method based on a chemical biomarker, immunolabeling large intact specimens is expensive and time-consuming due to the slow diffusion of antibodies in thick tissues. C, With ITAS3D, H&E-analogue datasets are computationally transformed in appearance to mimic immunofluorescence datasets, which enables the synthetically labeled tissue structures to be segmented with traditional CV methods. The image-sequence translation model is trained with a GAN based on paired H&E-analogue and immunofluorescence datasets. ITAS3D is rapid and low-cost (in terms of staining) as well as annotation-free and objective (i.e., biomarker-based).
Figure 1.
General methods for 3D gland segmentation. A, A single-step DL segmentation model can be trained with imaging datasets of tissues labeled with a fluorescent analogue of H&E paired with manually annotated ground-truth segmentation masks. While H&E analogue staining is low-cost and rapid, manual annotations are labor-intensive (especially in 3D) and based on subjective human judgements. B, By immunolabeling a tissue microstructure with high specificity, 3D segmentations can be achieved with traditional CV methods without the need for manual annotations. While this is an objective segmentation method based on a chemical biomarker, immunolabeling large intact specimens is expensive and time-consuming due to the slow diffusion of antibodies in thick tissues. C, With ITAS3D, H&E-analogue datasets are computationally transformed in appearance to mimic immunofluorescence datasets, which enables the synthetically labeled tissue structures to be segmented with traditional CV methods. The image-sequence translation model is trained with a GAN based on paired H&E-analogue and immunofluorescence datasets. ITAS3D is rapid and low-cost (in terms of staining) as well as annotation-free and objective (i.e., biomarker-based).
Figure 2. ITAS3D: a two-step pipeline for annotation-free 3D segmentation of prostate glands. A, In step 1, a 3D microscopy dataset of a specimen, stained with a rapid and inexpensive fluorescent analogue of H&E, is converted into a synthetic CK8 immunofluorescence dataset by using an image-sequence translation model that is trained with paired H&E analogue and real-CK8 immunofluorescence datasets (tri-labeled tissues). The CK8 biomarker, which is utilized in standard-of-care genitourinary pathology practice, is ubiquitously expressed by the luminal epithelial cells of all prostate glands. In step 2, traditional computer-vision algorithms are applied to the synthetic-CK8 datasets for semantic segmentation of the gland epithelium, lumen, and surrounding stromal regions. B, In step 1, a 3D prostate biopsy is subdivided into overlapping blocks that are each regarded as depth-wise sequences of 2D images. A GAN-trained generator performs image translation sequentially on each 2D level of an image block. The image translation at each level is based on the H&E analogue input at that level while leveraging the H&E analogue and CK8 images from two previous levels to enforce spatial continuity between levels (i.e., a “2.5D” translation method). The synthetic-CK8 image-block outputs are then mosaicked to generate a 3D CK8 dataset of the whole biopsy to assist with gland segmentation. In step 2, the epithelial cell layer (epithelium) is segmented from the synthetic-CK8 dataset with a thresholding-based algorithm. Gland lumen spaces are segmented by filling in the regions enclosed by the epithelia with refinements based on the cytoplasm channel (eosin fluorescence). See Supplementary Methods for details.
Figure 2.
ITAS3D: a two-step pipeline for annotation-free 3D segmentation of prostate glands. A, In step 1, a 3D microscopy dataset of a specimen, stained with a rapid and inexpensive fluorescent analogue of H&E, is converted into a synthetic CK8 immunofluorescence dataset by using an image-sequence translation model that is trained with paired H&E analogue and real-CK8 immunofluorescence datasets (tri-labeled tissues). The CK8 biomarker, which is utilized in standard-of-care genitourinary pathology practice, is ubiquitously expressed by the luminal epithelial cells of all prostate glands. In step 2, traditional computer-vision algorithms are applied to the synthetic-CK8 datasets for semantic segmentation of the gland epithelium, lumen, and surrounding stromal regions. B, In step 1, a 3D prostate biopsy is subdivided into overlapping blocks that are each regarded as depth-wise sequences of 2D images. A GAN-trained generator performs image translation sequentially on each 2D level of an image block. The image translation at each level is based on the H&E analogue input at that level while leveraging the H&E analogue and CK8 images from two previous levels to enforce spatial continuity between levels (i.e., a “2.5D” translation method). The synthetic-CK8 image-block outputs are then mosaicked to generate a 3D CK8 dataset of the whole biopsy to assist with gland segmentation. In step 2, the epithelial cell layer (epithelium) is segmented from the synthetic-CK8 dataset with a thresholding-based algorithm. Gland lumen spaces are segmented by filling in the regions enclosed by the epithelia with refinements based on the cytoplasm channel (eosin fluorescence). See Supplementary Methods for details.
Figure 3. Segmentation results with ITAS3D. A, 2D cross-sections are shown (from left to right) of false-colored H&E analogue images, synthetic-CK8 IHC images generated by image-sequence translation, and gland-segmentation masks based on the synthetic-CK8 images (yellow, epithelium; red, lumen; gray, stroma). The example images are from large 3D datasets containing benign glands (first row) and cancerous glands (second row). Zoom-in views show small discrete well-formed glands (Gleason pattern 3, blue box) and cribriform glands (Gleason pattern 4, red box) in the cancerous region. Three-dimensional renderings of gland segmentations for a benign and cancerous region are shown on the far right. Scale bar, 100 μm. B, Side views of the image sequences (with the depth direction oriented down) of real- and synthetic-CK8 immunofluorescence images. The 2.5D image translation results exhibit substantially improved depth-wise continuity compared with the 2D image translation results. Scale bar, 25 μm. C, For quantitative benchmarking, Dice coefficients (larger is better) and 3D Hausdorff distances (smaller is better) are plotted for ITAS3D-based gland segmentations along with two benchmark methods (3D watershed and 2D U-net), as calculated from 10 randomly selected test regions. Violin plots are shown with mean values denoted by a center cross and SDs denoted by error bars. For the 3D Hausdorff distance, the vertical axis denotes physical distance (in microns) within the tissue.
Figure 3.
Segmentation results with ITAS3D. A, 2D cross-sections are shown (from left to right) of false-colored H&E analogue images, synthetic-CK8 IHC images generated by image-sequence translation, and gland-segmentation masks based on the synthetic-CK8 images (yellow, epithelium; red, lumen; gray, stroma). The example images are from large 3D datasets containing benign glands (first row) and cancerous glands (second row). Zoom-in views show small discrete well-formed glands (Gleason pattern 3, blue box) and cribriform glands (Gleason pattern 4, red box) in the cancerous region. Three-dimensional renderings of gland segmentations for a benign and cancerous region are shown on the far right. Scale bar, 100 μm. B, Side views of the image sequences (with the depth direction oriented down) of real- and synthetic-CK8 immunofluorescence images. The 2.5D image translation results exhibit substantially improved depth-wise continuity compared with the 2D image translation results. Scale bar, 25 μm. C, For quantitative benchmarking, Dice coefficients (larger is better) and 3D Hausdorff distances (smaller is better) are plotted for ITAS3D-based gland segmentations along with two benchmark methods (3D watershed and 2D U-net), as calculated from 10 randomly selected test regions. Violin plots are shown with mean values denoted by a center cross and SDs denoted by error bars. For the 3D Hausdorff distance, the vertical axis denotes physical distance (in microns) within the tissue.
Figure 4. Clinical study comparing the performance of 3D versus 2D glandular features for risk stratification. A, Archived (FFPE) RP specimens were obtained from a well-curated cohort of 50 patients, from which, 300 simulated (ex vivo) needle biopsies were extracted (6 biopsies per case, per sextant-biopsy protocol). The biopsies were labeled with a fluorescent analogue of H&E staining, optically cleared to render the tissues transparent to light, and then comprehensively imaged in 3D with OTLS microscopy. Prostate glands were computationally segmented from the resultant 3D biopsy images using the ITAS3D pipeline. Three-dimensional glandular features were extracted from tissue volumes containing prostate cancer. Two-dimensional glandular features were extracted from three levels per volume and averaged. B and C, Violin and box plots are shown for two examples of 3D glandular features, along with analogous 2D features, for cases in which BCR was observed within 5 years of RP (“BCR”) and for cases with no BCR within 5 years of RP (“non-BCR”). For both sets of example features, “lumen boundary curvature” in B and “gland-to-convex hull ratio” (G/H) in C, the 3D version of the feature shows improved stratification between BCR and non-BCR groups. D and E, ROC curves also show improved risk stratification with the 3D features versus corresponding 2D features, with considerably higher AUC values. F, Violin and box plots are shown of representative gland-skeleton features (average branch length and branch length variance), which can only be accurately derived from the 3D pathology datasets, showing significant stratification between BCR and non-BCR groups. G, ROC curves are shown, along with AUC values, for average branch length and branch length variance. H, ROC curves are shown of various multiparameter models, including those trained with 2D glandular features, 3D glandular features excluding skeleton features, and 3D glandular features including skeleton features. I, KM curves are shown for BCR-free survival, showing that a multiparameter model based on 3D glandular features is better able to stratify patients into low-risk and high-risk groups with significantly different recurrence trajectories (P = 6.6 × 10⁻⁵, HR = 11.2, C-index = 0.84).
Figure 4.
Clinical study comparing the performance of 3D versus 2D glandular features for risk stratification. A, Archived (FFPE) RP specimens were obtained from a well-curated cohort of 50 patients, from which, 300 simulated (ex vivo) needle biopsies were extracted (6 biopsies per case, per sextant-biopsy protocol). The biopsies were labeled with a fluorescent analogue of H&E staining, optically cleared to render the tissues transparent to light, and then comprehensively imaged in 3D with OTLS microscopy. Prostate glands were computationally segmented from the resultant 3D biopsy images using the ITAS3D pipeline. Three-dimensional glandular features were extracted from tissue volumes containing prostate cancer. Two-dimensional glandular features were extracted from three levels per volume and averaged. B and C, Violin and box plots are shown for two examples of 3D glandular features, along with analogous 2D features, for cases in which BCR was observed within 5 years of RP (“BCR”) and for cases with no BCR within 5 years of RP (“non-BCR”). For both sets of example features, “lumen boundary curvature” in B and “gland-to-convex hull ratio” (G/H) in C, the 3D version of the feature shows improved stratification between BCR and non-BCR groups. D and E, ROC curves also show improved risk stratification with the 3D features versus corresponding 2D features, with considerably higher AUC values. F, Violin and box plots are shown of representative gland-skeleton features (average branch length and branch length variance), which can only be accurately derived from the 3D pathology datasets, showing significant stratification between BCR and non-BCR groups. G, ROC curves are shown, along with AUC values, for average branch length and branch length variance. H, ROC curves are shown of various multiparameter models, including those trained with 2D glandular features, 3D glandular features excluding skeleton features, and 3D glandular features including skeleton features. I, KM curves are shown for BCR-free survival, showing that a multiparameter model based on 3D glandular features is better able to stratify patients into low-risk and high-risk groups with significantly different recurrence trajectories (P = 6.6 × 10⁻⁵, HR = 11.2, C-index = 0.84).

References

    1. Siegel RL, Miller KD, Fuchs HE, Jemal A. Cancer statistics, 2021. CA Cancer J Clin 2021;71:7–33. - PubMed
    1. Epstein JI. A new contemporary prostate cancer grading system. Ann Pathol 2015;35:474–6. - PubMed
    1. Ozkan TA, Eruyar AT, Cebeci OO, Memik O, Ozcan L, Kuskonmaz I. Interobserver variability in Gleason histological grading of prostate cancer. Scand J Urol 2016;50:420–4. - PubMed
    1. Shah RB, Leandro G, Romerocaces G, Bentley J, Yoon J, Mendrinos S, et al. Improvement of diagnostic agreement among pathologists in resolving an “atypical glands suspicious for cancer” diagnosis in prostate biopsies using a novel “Disease-Focused Diagnostic Review” quality improvement process. Hum Pathol 2016;56:155–62. - PubMed
    1. Kane CJ, Eggener SE, Shindel AW, Andriole GL. Variability in outcomes for patients with intermediate-risk prostate cancer (Gleason Score 7, International Society of Urological Pathology Gleason Group 2–3) and implications for risk stratification: A systematic review. Eur Urol Focus 2017;3:487–97. - PubMed

Publication types