. 2022 Mar 1;12(3):792-811.
doi: 10.1158/2159-8290.CD-20-1459.

KAT6A and ENL Form an Epigenetic Transcriptional Control Module to Drive Critical Leukemogenic Gene-Expression Programs

Affiliations

KAT6A and ENL Form an Epigenetic Transcriptional Control Module to Drive Critical Leukemogenic Gene-Expression Programs

Fangxue Yan et al. Cancer Discov. .

Abstract

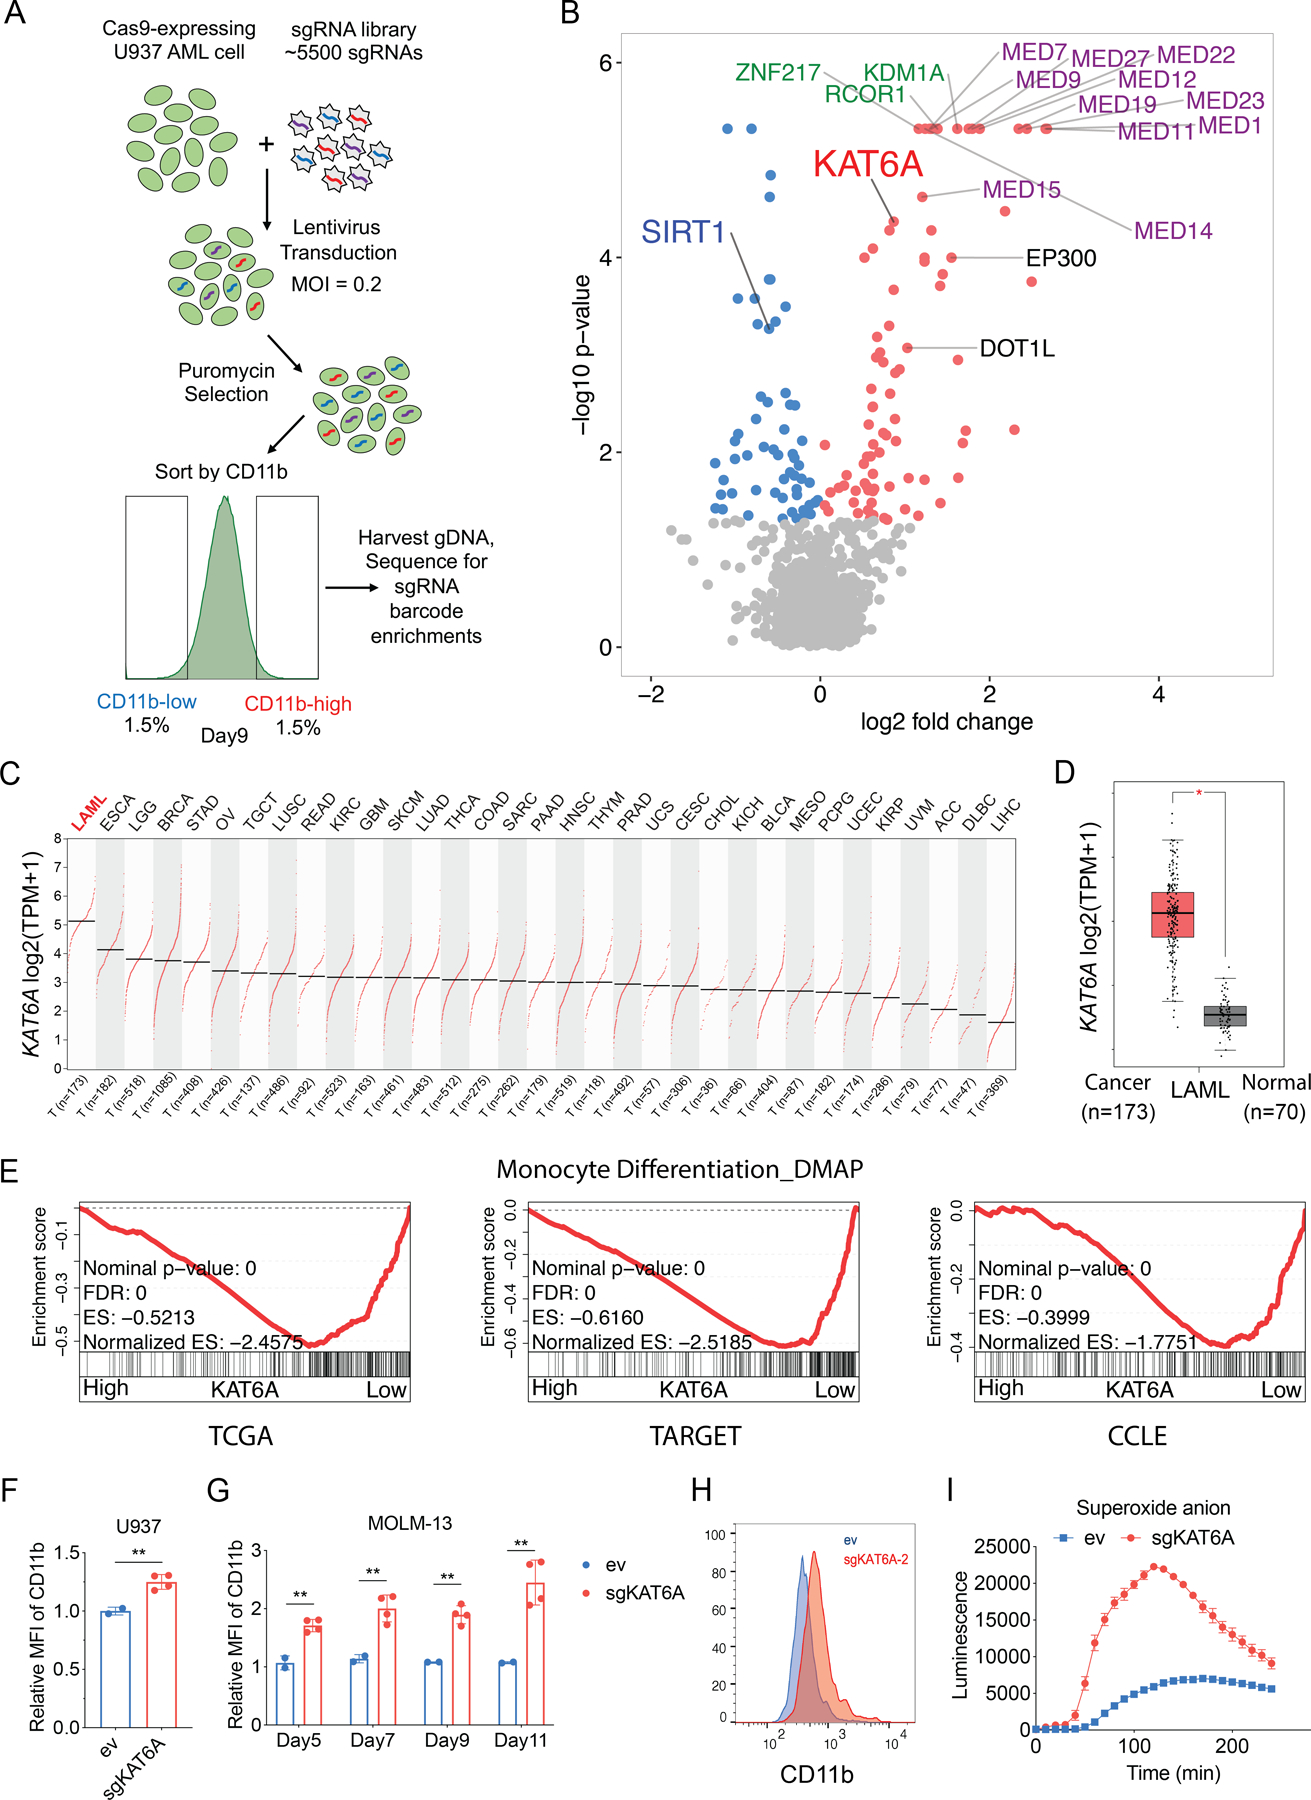
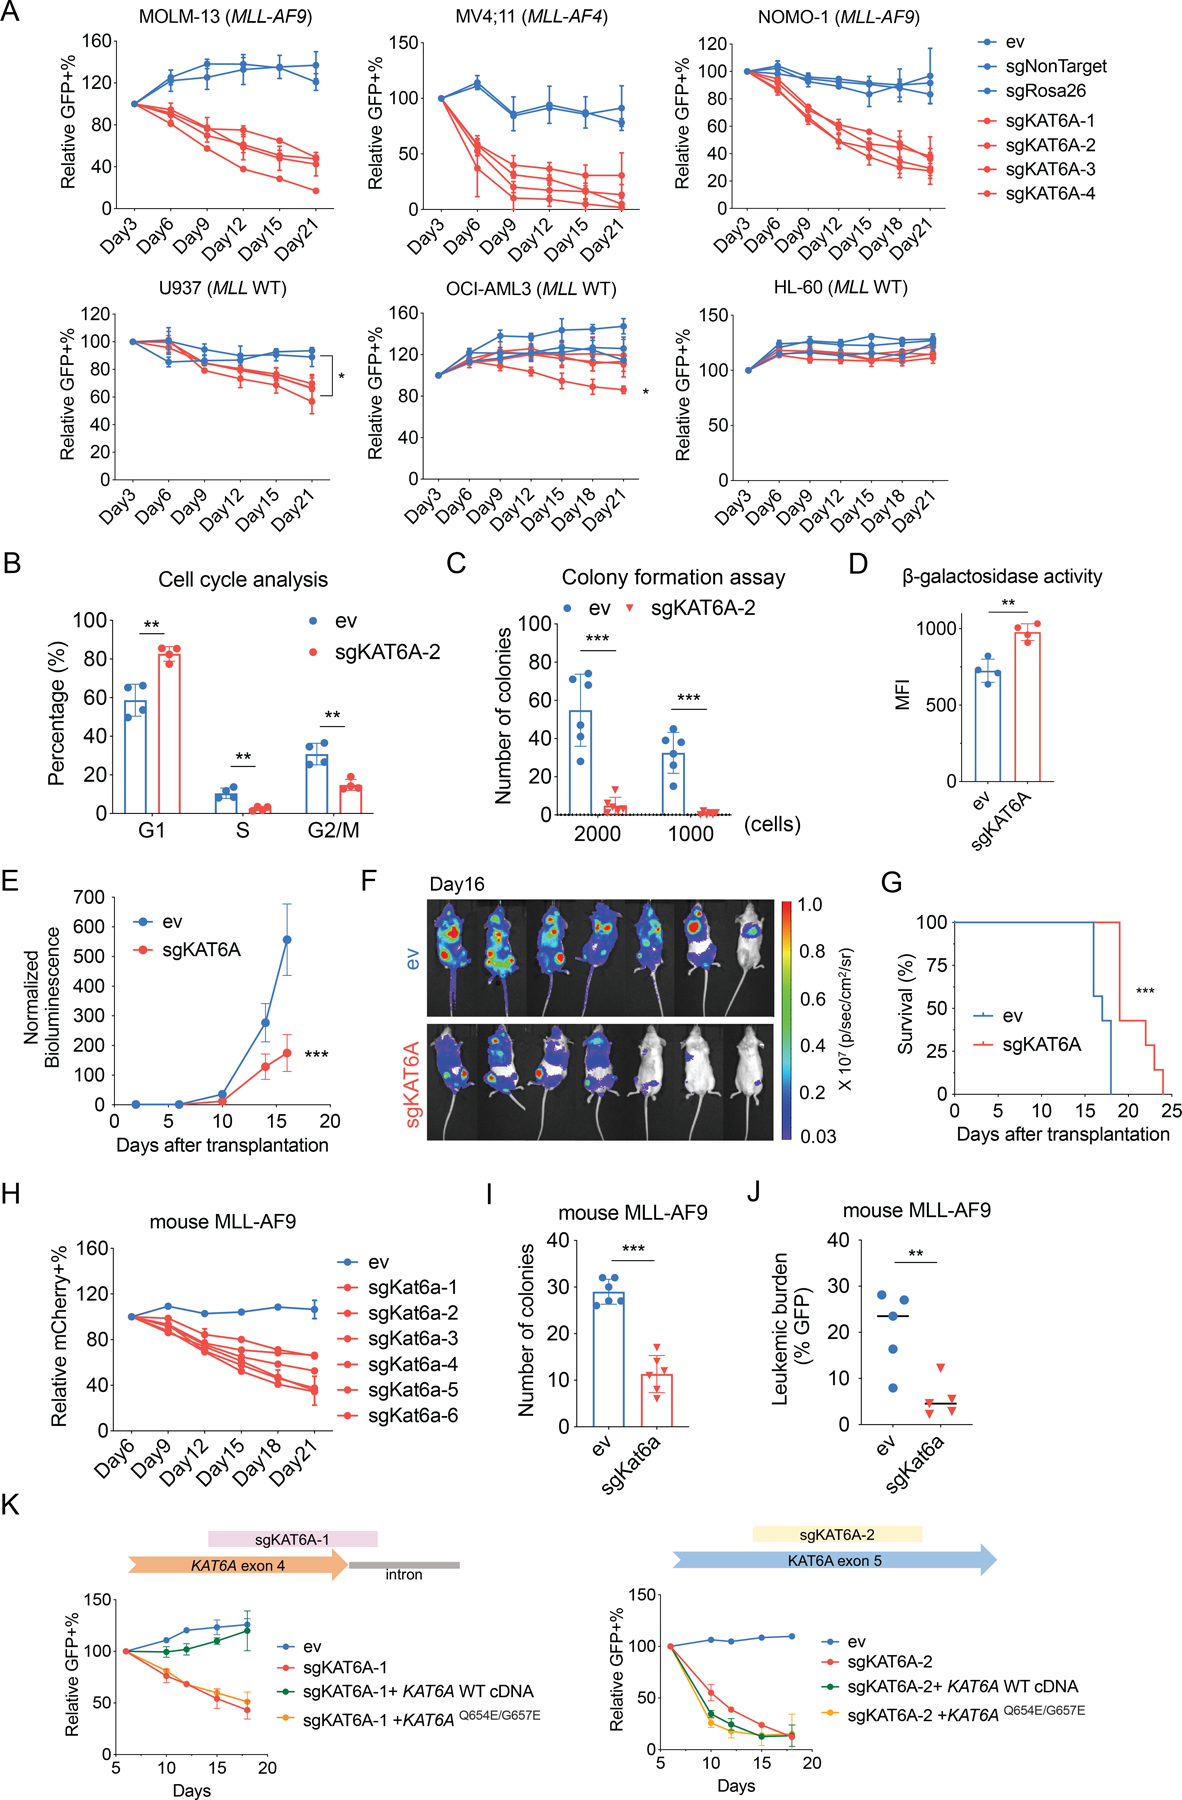
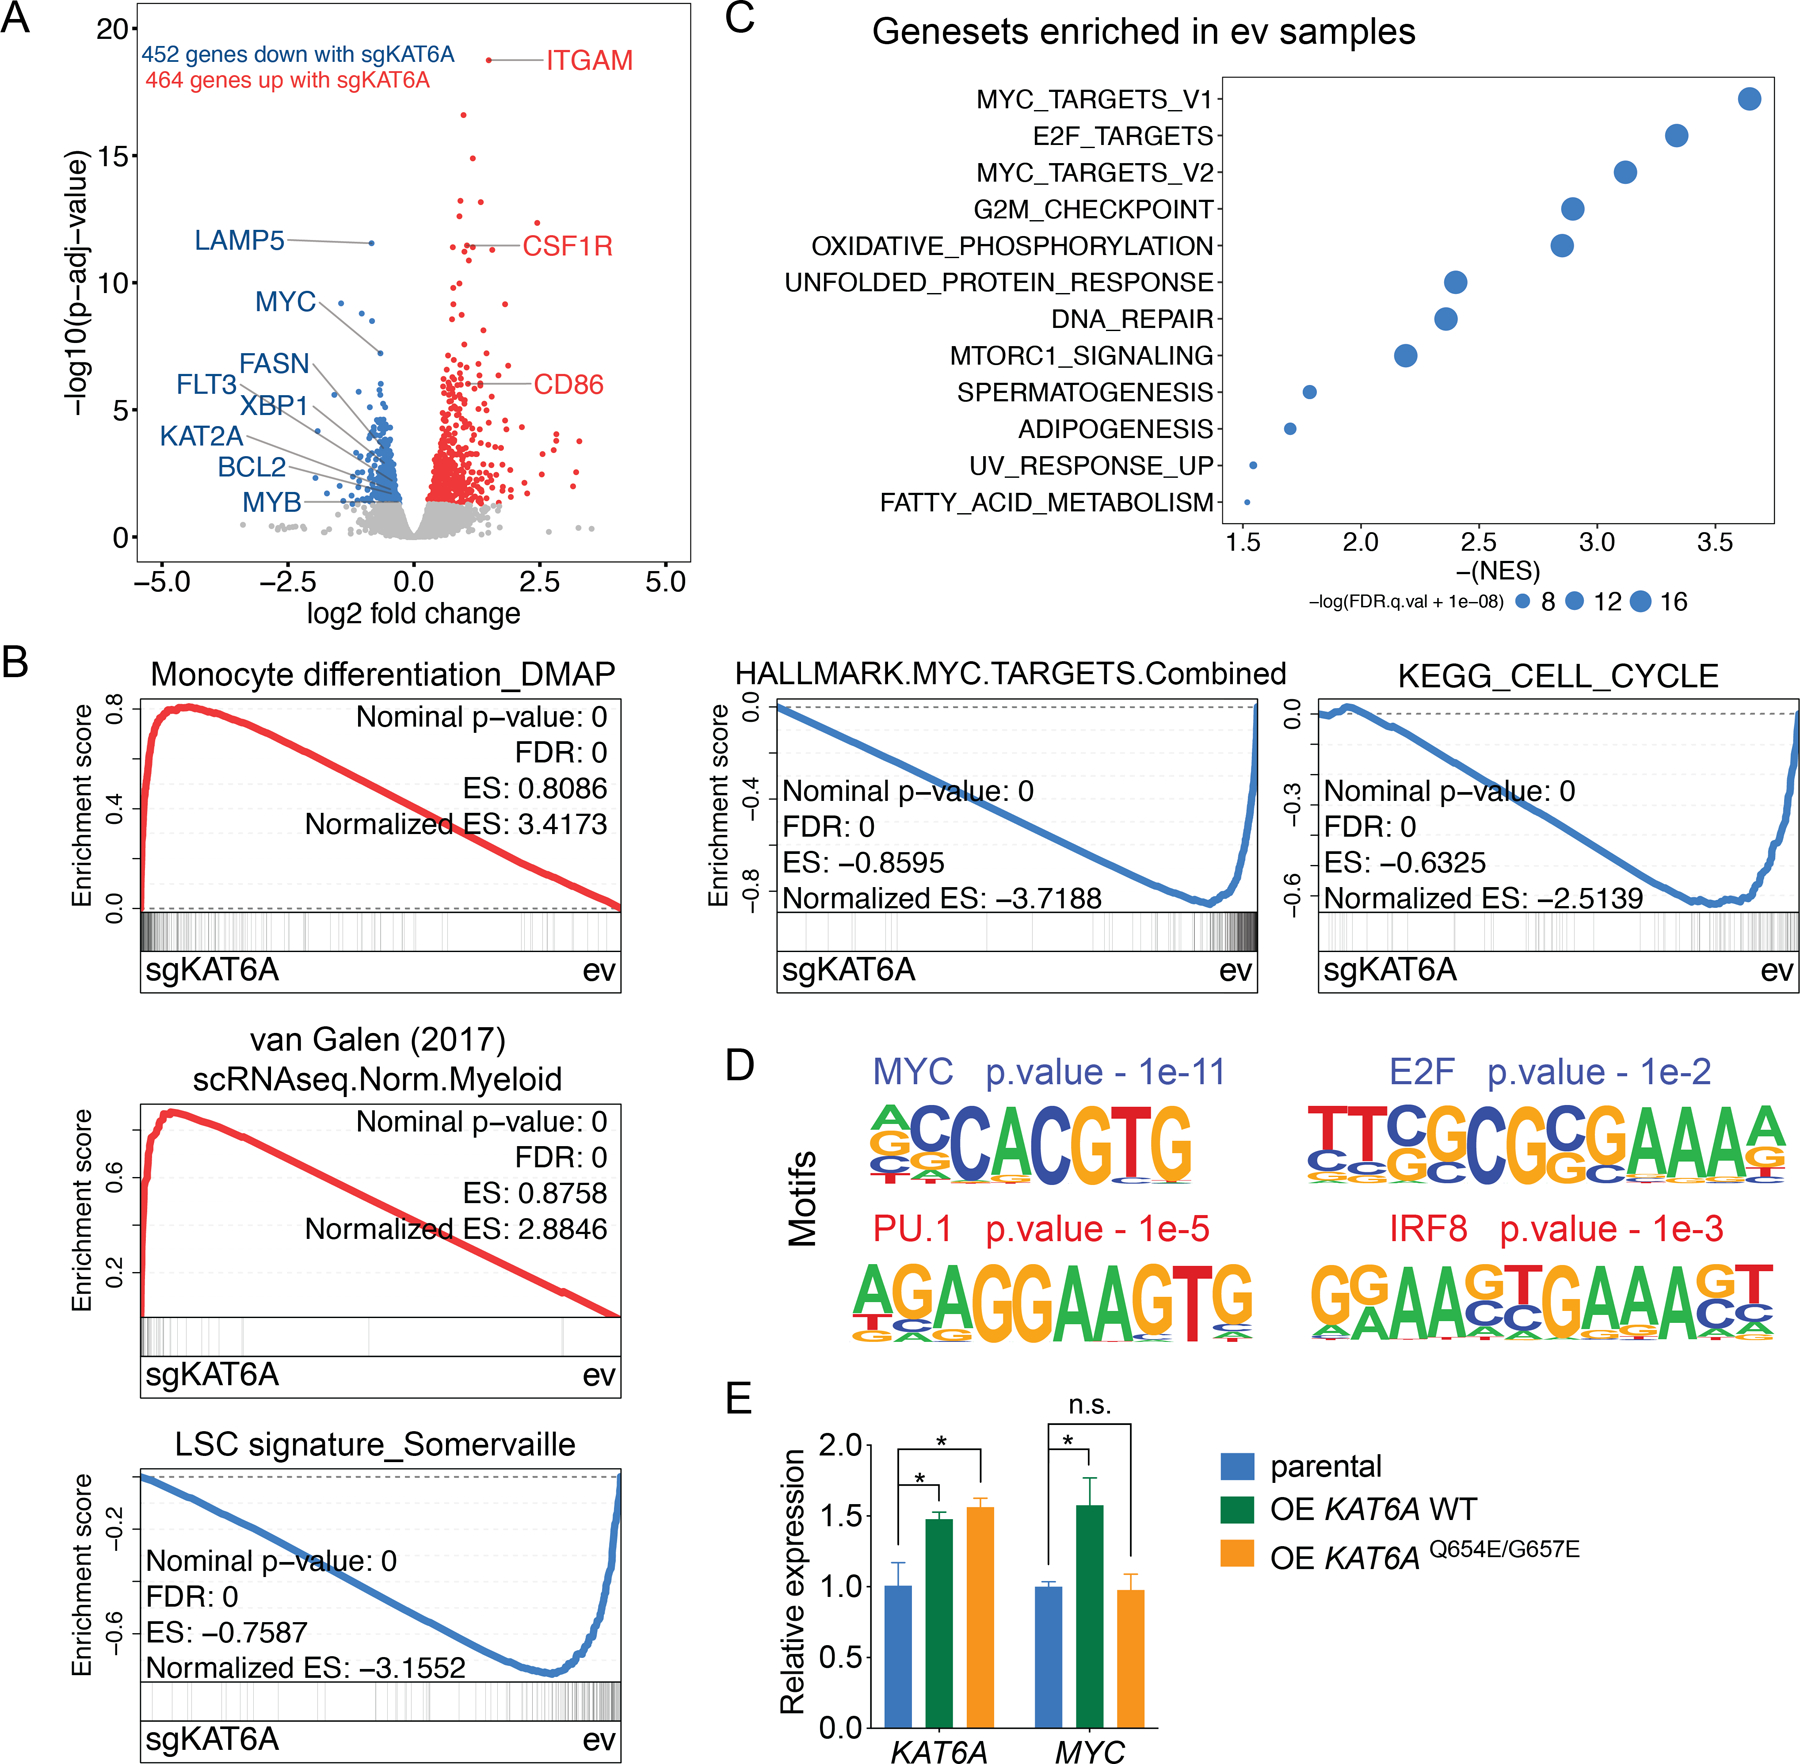
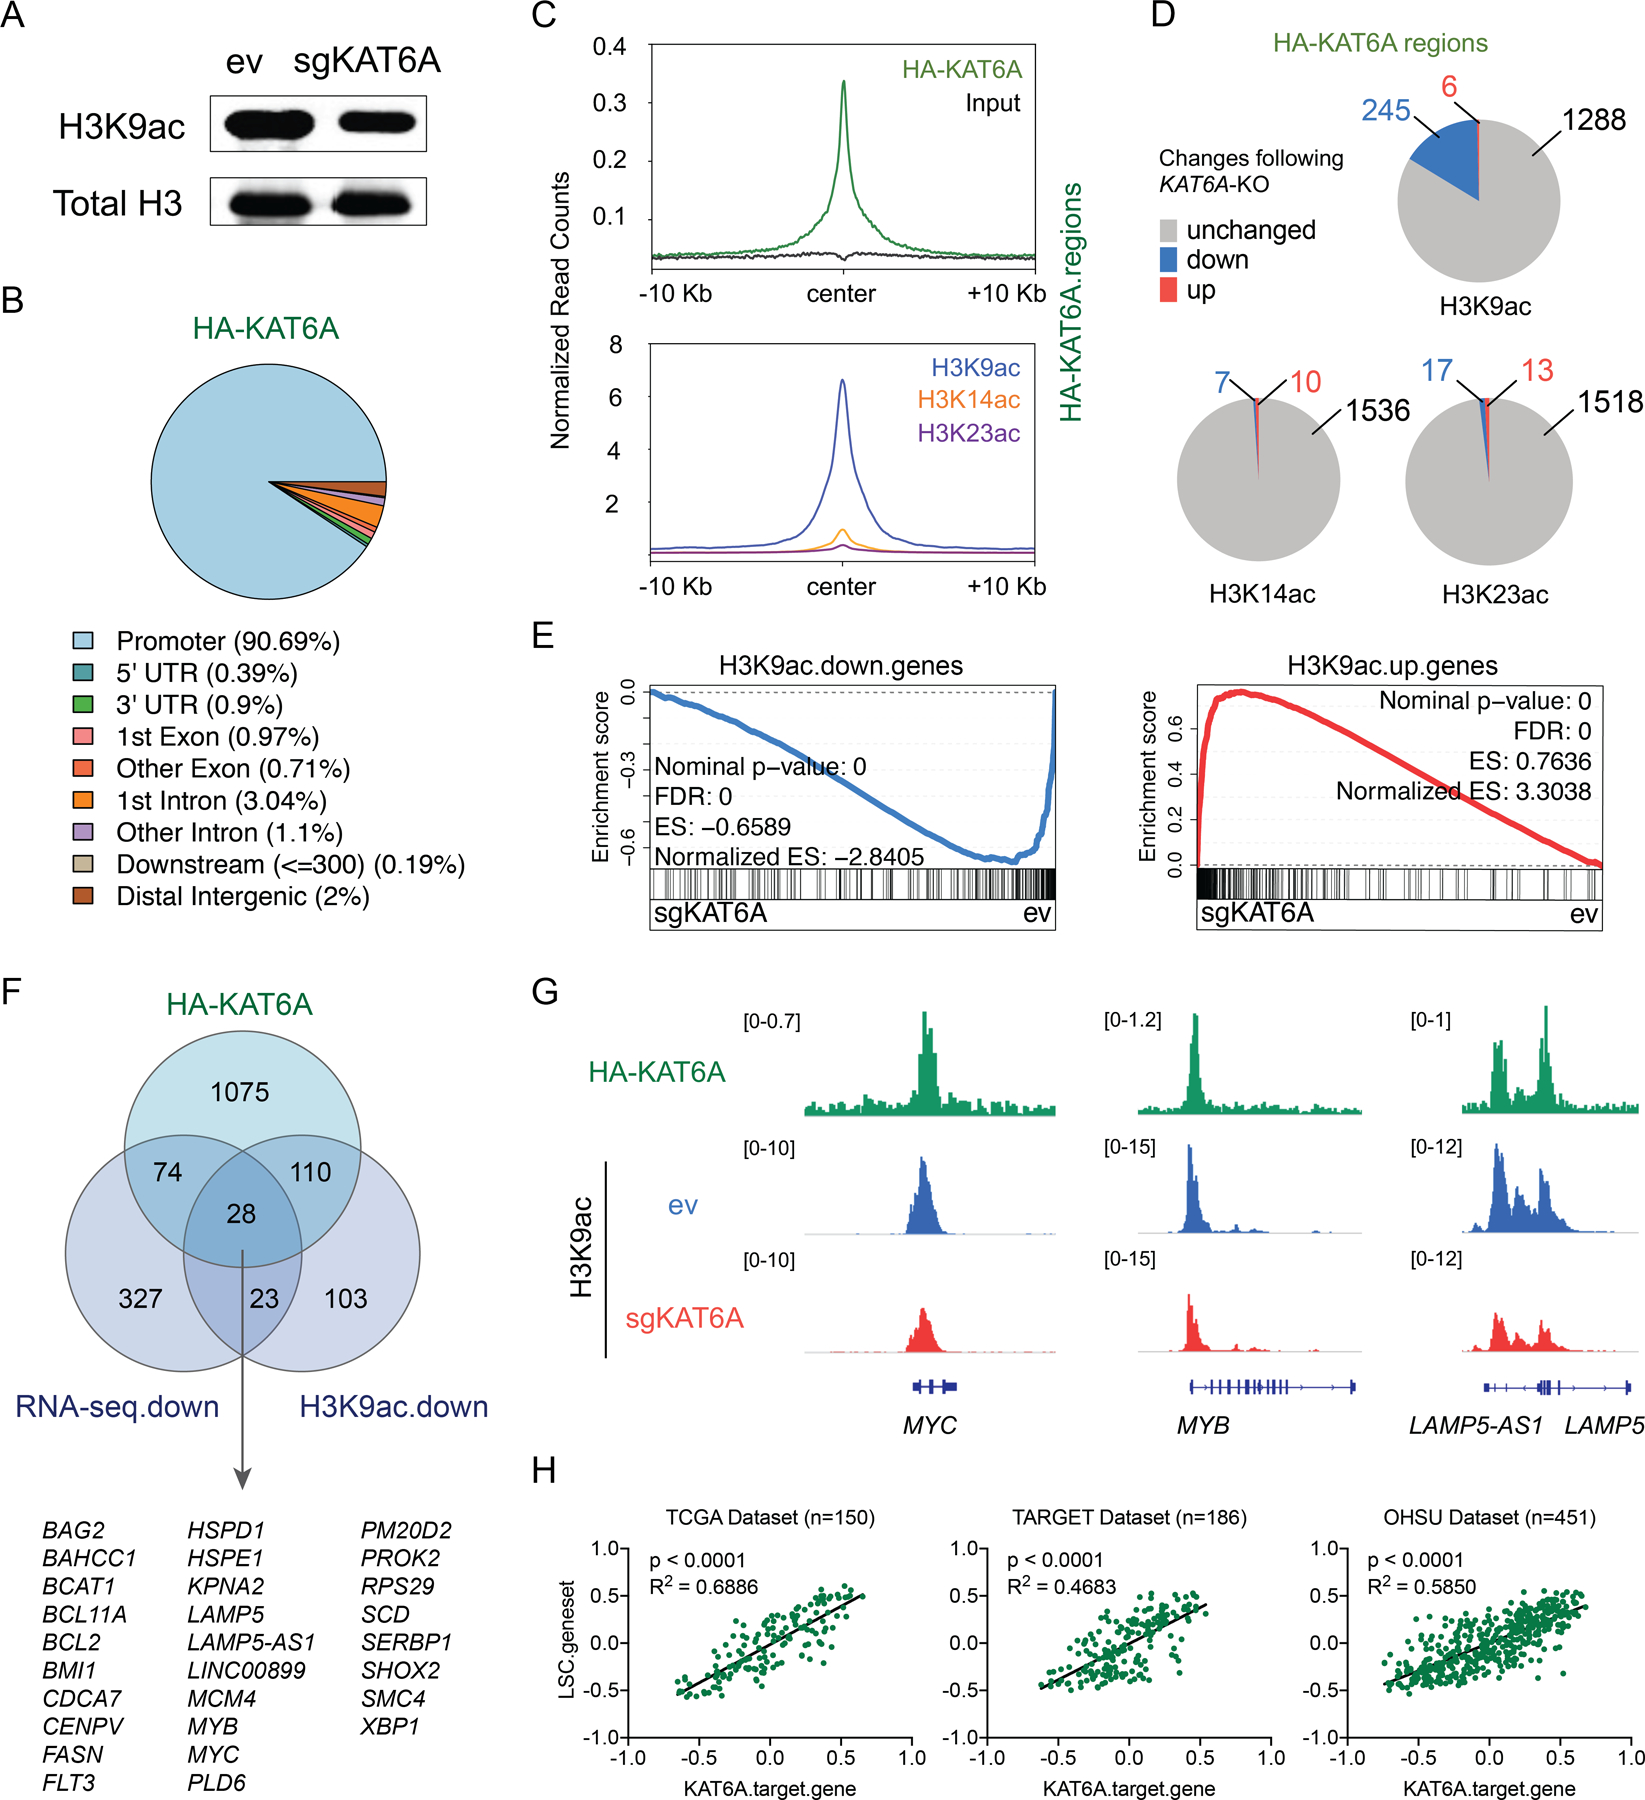
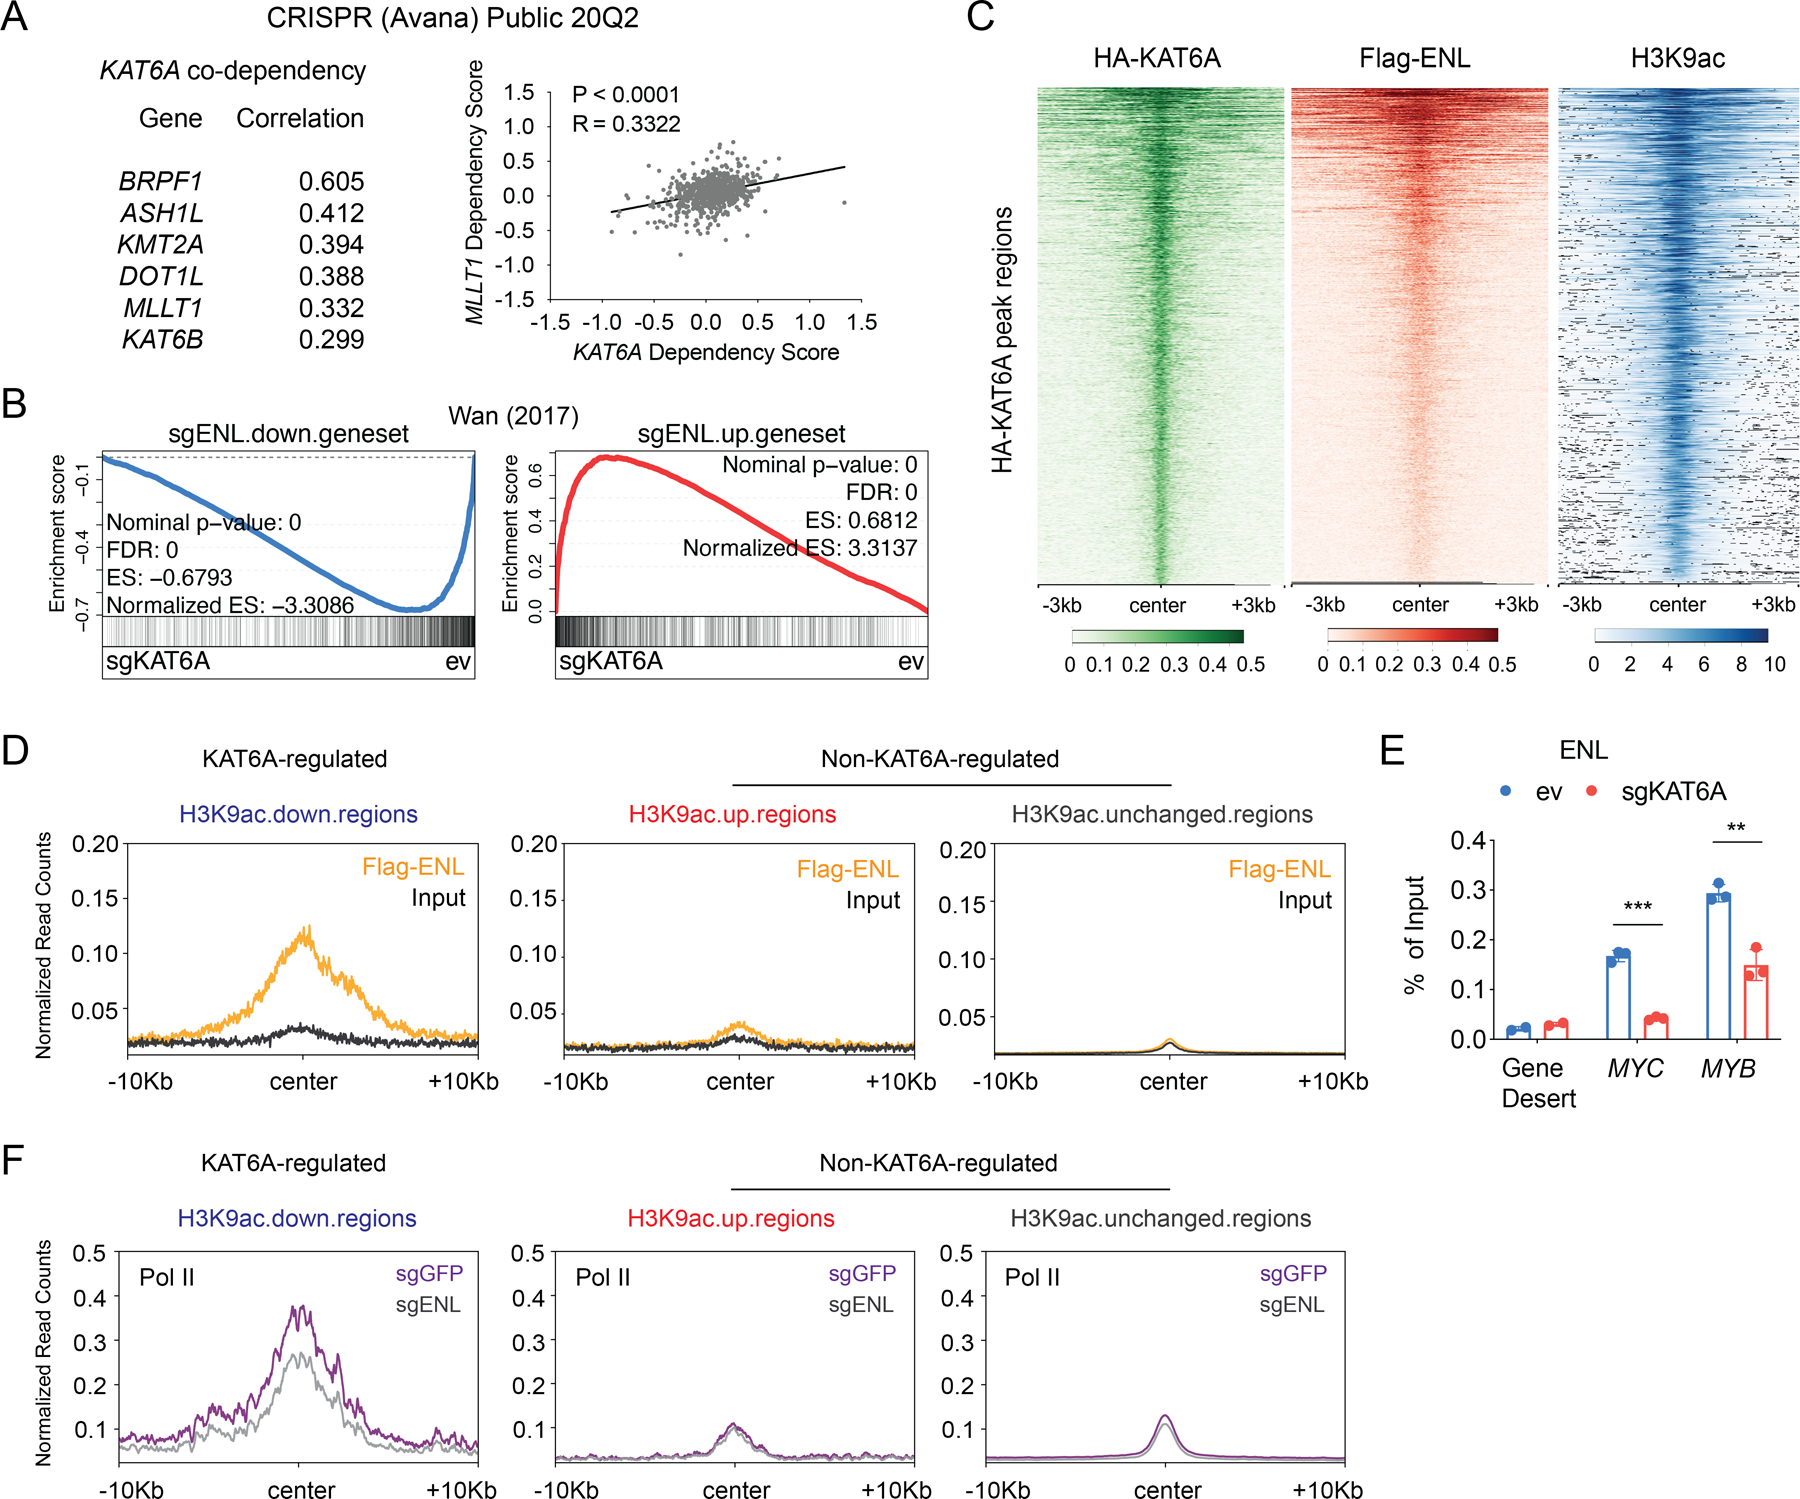
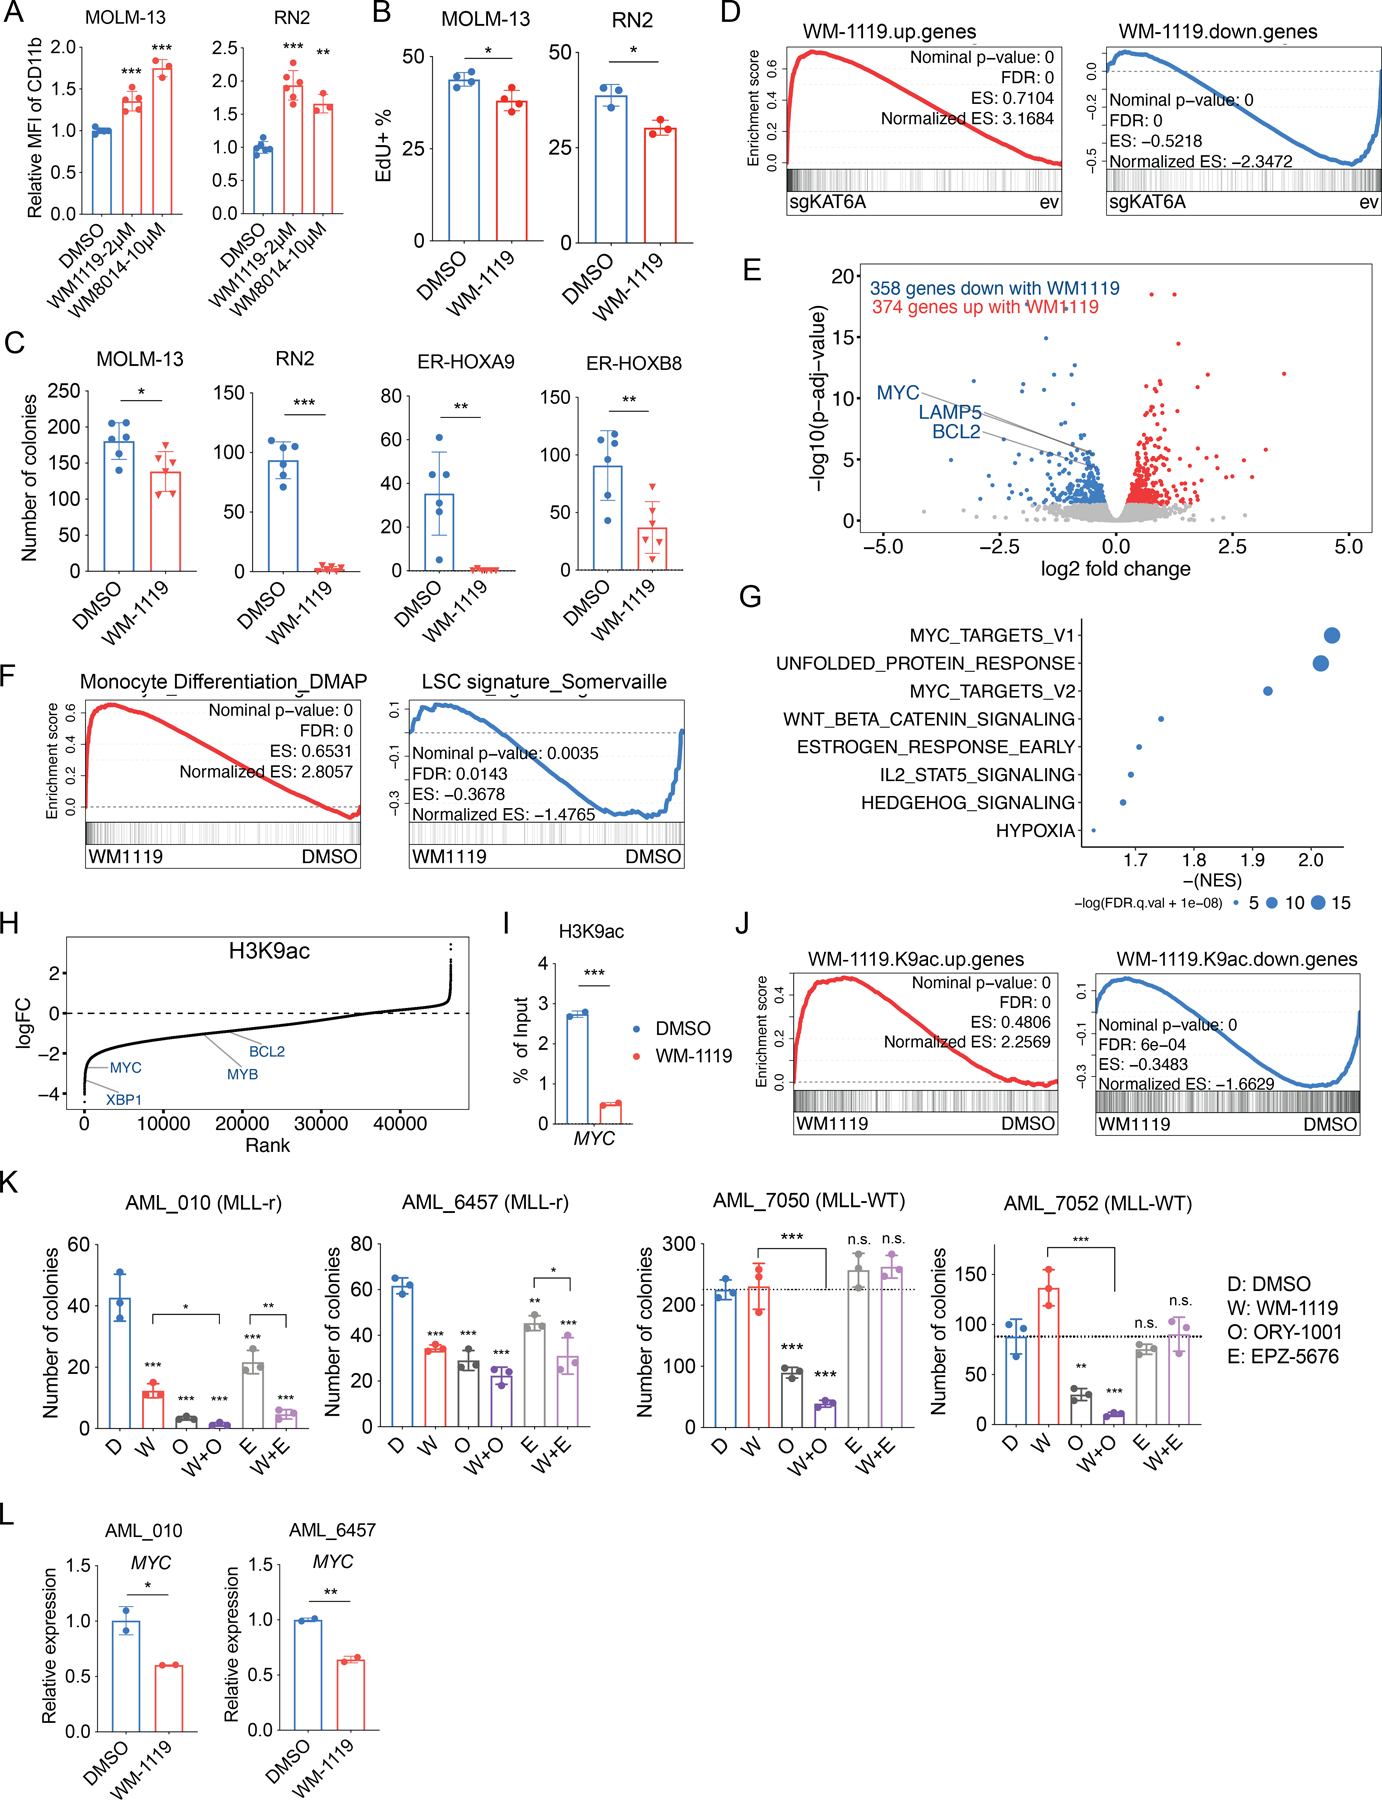
Epigenetic programs are dysregulated in acute myeloid leukemia (AML) and help enforce an oncogenic state of differentiation arrest. To identify key epigenetic regulators of AML cell fate, we performed a differentiation-focused CRISPR screen in AML cells. This screen identified the histone acetyltransferase KAT6A as a novel regulator of myeloid differentiation that drives critical leukemogenic gene-expression programs. We show that KAT6A is the initiator of a newly described transcriptional control module in which KAT6A-catalyzed promoter H3K9ac is bound by the acetyl-lysine reader ENL, which in turn cooperates with a network of chromatin factors to induce transcriptional elongation. Inhibition of KAT6A has strong anti-AML phenotypes in vitro and in vivo, suggesting that KAT6A small-molecule inhibitors could be of high therapeutic interest for mono-therapy or combinatorial differentiation-based treatment of AML.

Significance: AML is a poor-prognosis disease characterized by differentiation blockade. Through a cell-fate CRISPR screen, we identified KAT6A as a novel regulator of AML cell differentiation. Mechanistically, KAT6A cooperates with ENL in a "writer-reader" epigenetic transcriptional control module. These results uncover a new epigenetic dependency and therapeutic opportunity in AML. This article is highlighted in the In This Issue feature, p. 587.


Conflict of interest statement

Conflict of Interest: Neil Palmisiano is a consultant for Takeda, Abbvie, and Foundation one, and receives research funding from Abbvie and Genentech. Liling Wan is a consultant of Bridge Medicines. David B. Sykes is a co-founder and holds equity in Clear Creek Bio, is a consultant and holds equity in SAFI Biosolutions, and is a consultant for Keros Therapeutics. Other authors declare that they have no competing financial interests.

Figures

Figure 1.
Figure 1.. CRISPR-Cas9 screen identifies KAT6A as a differentiation regulator in AML.
A, Schematic outline of CRISPR-Cas9 screen. MOI, multiplicity of infection; gDNA, genomic DNA. B, Volcano plot showing the top hits enriched in CD11b-low (blue) or CD11b-high (red) populations, with p-value < 0.05. Several top hits in Mediator complex (purple) and LSD1-CoREST complex (green) are highlighted. C, KAT6A expression levels in cancer types from TCGA, using the GEPIA online server. TPM, transcripts per million. T: tumor/cancer. D, Box plot comparing KAT6A expression levels between AML samples (from TCGA dataset) and matched normal samples (from TCGA and GTEx projects), using the GEPIA online server. E, Leading edge plot showing the enrichment of a monocyte differentiation gene set based on Gene Set Enrichment Analysis (GSEA) of KAT6A high-expressing (top 20%) and KAT6A low-expressing (bottom 20%) AML samples from TCGA (left), TARGET (center), and CCLE (right) datasets. FDR, false discovery rate. ES, enrichment score. F, Surface expression of CD11b after lentiviral transduction of empty vector (ev) and sgRNAs targeting KAT6A (sgKAT6A-1 and sgKAT6A-2) in U937 cells on Day 9 (n=2–4 in each group). MFI, mean fluorescence intensity. G, Surface expression of CD11b after lentiviral transduction of empty vector (ev) and sgRNAs targeting KAT6A (sgKAT6A-1 and sgKAT6A-2) in MOLM-13 cells on indicated days (n=2–4 each group). H, Representative flow cytometry histogram of surface CD11b expression in MOLM-13 cells on Day 9. I, Functional change in myeloid differentiation in MOLM-13 cells as measured by superoxide anion production. Statistical differences were calculated using unpaired Student’s t-test (D and F) and Multiple t-test (G). All error bars represent mean ± s.d (standard deviation), and p<0.05 was considered statistically significant, * indicates p<0.05, ** p<0.01, and *** p< 0.001. See also Figure S1.
Figure 2.
Figure 2.. KAT6A is required for AML growth in vitro and in vivo.
A, Negative-selection competition assay showing the percentage of GFP+ ev or sgKAT6A-transduced cells over time, normalized to Day3 (n=2–3 each group). B, Cell cycle analysis after 7 days of ev or sgKAT6A-2 transduction in MOLM-13 cells (n=4 each group). C, Count of colonies formed by 2000 or 1000 MOLM-13 cells after ev or sgKAT6A-2 transduction (n=6 each group). D, Senescence-associated β-galactosidase activity in MOLM-13 cells measured by flow cytometry (n=4 each group). MFI, mean fluorescence intensity. E, Quantification of bioluminescence of mice transplanted with ev or sgKAT6A MOLM-13-luc cells over time, normalized to Day2 (n=7 each group). F, Bioluminescent images of mice transplanted with ev or sgKAT6A MOLM-13-luc cells on Day16 (n=7 each group). G, Kaplan-Meier survival plot of mice transplanted with ev or sgKAT6A MOLM-13-luc cells (n=7 each group). H, Negative-selection competition assay showing the percentage of mCherry+ ev or sgKat6a-transduced cells over time, normalized to Day6 (n=2 each group). I, Count of colonies formed by 1000 mouse MLL-AF9 cells after ev or sgKat6a-6 transduction (n=6 each group). J, Leukemia burden quantified by the ratio of GFP+ mouse MLL-AF9 cells in the bone marrow of mice 3 weeks post transplantation (n=5 each group). K, Negative-selection competition assay in MOLM-13 cells showing the percentage of GFP+ ev or sgKAT6A-transduced cells normalized to Day 6, following overexpression of indicated KAT6A cDNA constructs. Statistical differences were calculated using two-way ANOVA with multiple comparisons (A and E), Multiple t-test (B and C), unpaired Student’s t-test (D, I, and J), and log-rank test (G). Error bars in (E) represent mean ± s.e.m. (standard error of mean), and error bars in all other panels represent mean ± s.d. p<0.05 was considered statistically significant, * indicates p<0.05, ** p<0.01, and *** p< 0.001. See also Figure S2.
Figure 3.
Figure 3.. Loss of KAT6A disrupts MYC-related transcriptional programs.
A, Volcano plot showing the differentially expressed genes between ev and sgKAT6A-2 transduced MOLM-13 cells 5 days post viral transduction. Genes with p.adj< 0.05 are highlighted (blue: genes down-regulated in sgKAT6A cells, red: genes up-regulated in sgKAT6A cells). B, Leading edge plot showing the enrichment of indicated gene sets based on GSEA (blue: gene set enriched in ev cells, red: gene set enriched in sgKAT6A cells). C, Top enriched hallmark gene sets in ev cells based on GSEA (top). Representative leading-edge plots of combined hallmark MYC target (V1+V2) gene set (bottom-left), and KEGG cell cycle gene set (bottom-right). D, Top transcription factor motifs enriched in transcription start site (TSS) regions (−1Kb to +300bp) of sgKAT6A down-regulated genes (blue) and sgKAT6A up-regulated genes (red). E, mRNA expression of KAT6A and MYC in parental MOLM-13 cells or with indicated constructs. OE, overexpression. Statistical differences were calculated using one-way ANOVA with multiple comparisons (E). All error bars represent mean ± s.d. and p<0.05 was considered statistically significant, * indicates p<0.05, n.s. not significant. See also Figure S3.
Figure 4.
Figure 4.. KAT6A regulates H3K9ac on key leukemogenic genes.
A, Western blot of H3K9ac and total H3 in ev and sgKAT6A-2 transduced MOLM-13 cells 5 days post viral transduction. B, Pie chart showing genomic annotations of HA-KAT6A ChIP-seq peaks. C, Distribution of normalized ChIP-seq reads for HA-KAT6A (up) and indicated histone marks (bottom) centered on HA-KAT6A peaks. D, Pie charts showing changes (p<0.05) of histone acetylation marks at genomic regions where HA-KAT6A intersects with histone acetylation marks. E, Leading edge plot showing the enrichment of genes associated with H3K9ac down-regulated or up-regulated regions based on GSEA of ev and sgKAT6A samples. F, Venn diagram showing the overlap of HA-KAT6A bound genes, genes downregulated with sgKAT6A (p.adj<0.05) and genes associated with H3K9ac down-regulated regions (p<0.05). G, Genome tracks showing HA-KAT6A and H3K9ac ChIP-seq occupancy at indicated gene loci. H, Pearson’s correlation of sample-wise KAT6A target gene set enrichment scores and LSC gene set enrichment scores calculated by Gene Set Variation Analysis (GSVA). Each dot represents one sample from TCGA, TARGET, or OHSU datasets. See also Figure S4.
Figure 5.
Figure 5.. The H3K9ac reader ENL is a downstream effector of KAT6A.
A, Cancer dependency map (DepMap) CRISPR Public 20Q2 dataset showing the top co-dependent genes with KAT6A and their Pearson’s correlation scores (left). Correlation of KAT6A and MLLT1 (ENL) dependency scores are presented (right). Each dot represents a cell line. B, Leading edge plot showing the enrichment of genes down-regulated or up-regulated by sgENL in MOLM-13 cells (data from GSE80774) based on GSEA of ev and sgKAT6A samples. C, Heatmaps showing ChIP-seq signals of HA-KAT6A, Flag-ENL (data from GSE80779), and H3K9ac centered on HA-KAT6A peaks in MOLM-13 cells. D, Distribution of normalized ChIP-seq reads for Flag-ENL in MOLM-13 cells (data from GSE80779) centered on H3K9ac down-regulated, up-regulated, or unchanged regions. E, ChIP-qPCR of ENL at gene desert, MYC (TSS+1Kb) and MYB (TSS+2Kb) loci after 5 days of ev and sgKAT6A-2 transduction in MOLM-13 cells. F, Distribution of normalized ChIP-seq reads for RNA Pol II with sgGFP or sgENL in MOLM-13 cells (data from GSE80779) centered on H3K9ac down-regulated, up-regulated, or unchanged regions. Statistical differences were calculated using Multiple t-test (E). All error bars represent mean ± s.d. and p<0.05 was considered statistically significant, * indicates p<0.05, ** p<0.01, and *** p< 0.001. See also Figure S5.
Figure 6.
Figure 6.. Treatment with WM-1119 inhibits KAT6A-mediated transcriptional program and AML growth.
A, Surface expression of CD11b after 4 days treatment of indicated chemicals in MOLM-13 and RN2 cells (n=3–6 each group). B, Percentage of EdU+ cells after 4 days treatment of DMSO or WM-1119 in MOLM-13 and RN2 cells (n=4 each group). C, Count of colonies formed by 1000 cells with DMSO or WM-1119 treatment. (n=6 each group). D, Leading edge plot showing the enrichment of genes up-regulated or down-regulated with 4 days treatment of WM-1119 based on GSEA of ev and sgKAT6A MOLM-13 cells. E, Volcano plot showing the differentially expressed genes between DMSO and WM-1119 treated MOLM-13 cells. Genes with p.adj< 0.05 are highlighted (blue: genes down-regulated with WM-1119, red: genes up-regulated with WM-1119). F, Leading edge plot showing the enrichment of indicated gene sets based on GSEA of DMSO and WM-1119 treated MOLM-13 cells. G, Top enriched hallmark gene sets in DMSO treated MOLM-13 cells based on GSEA. H, Waterfall plot of changes in H3K9ac ChIP-seq signal at the indicated proximal genes after 4 days of WM-1119 treatment in MOLM-13 cells. logFC, log fold change. I, ChIP-qPCR of H3K9ac at a gene desert or the MYC locus after 4 days treatment of DMSO or WM-1119 in MOLM-13 cells. J, Leading edge plot showing the enrichment of genes associated with H3K9ac up-regulated or down-regulated regions following WM-1119 treatment, based on GSEA of RNA-seq data from DMSO and WM-1119 treated MOLM-13 cells. K, Count of colonies formed by primary human AML cells after indicated chemical treatment (n=3 technical replicate each group). L, mRNA expression of MYC after 3 days of WM-1119 treatment in primary human AML cells. Statistical differences were calculated using one-way ANOVA with multiple comparisons (A and K), and unpaired Student’s t-test (B, C, I and L). All error bars represent mean ± s.d. and p<0.05 was considered statistically significant, * indicates p<0.05, ** p<0.01, and *** p< 0.001. Treatment with WM-1119 are 4μM, if not indicated otherwise. See also Figure S6.

Similar articles

Cited by

References

    1. Döhner H, Weisdorf DJ, Bloomfield CD. Acute myeloid leukemia. N. Engl. J. Med 2015;373:1136–52. - PubMed
    1. Siegel RL, Miller KD, Jemal A. Cancer statistics, 2020. CA. Cancer J. Clin 2020;70:7–30. - PubMed
    1. Dombret H, Gardin C. An update of current treatments for adult acute myeloid leukemia. Blood 2016;127:53–61. - PMC - PubMed
    1. De Thé H Differentiation therapy revisited. Nat. Rev. Cancer 2018;18:117–27. - PubMed
    1. Papaemmanuil E, Gerstung M, Bullinger L, Gaidzik VI, Paschka P, Roberts ND, et al. Genomic Classification and Prognosis in Acute Myeloid Leukemia. N. Engl. J. Med 2016;374:2209–21. - PMC - PubMed

Publication types