. 2022 Jan 26;42(4):643-656.
doi: 10.1523/JNEUROSCI.0592-21.2021. Epub 2021 Dec 1.

Respiration, Heartbeat, and Conscious Tactile Perception

Affiliations

Respiration, Heartbeat, and Conscious Tactile Perception

Martin Grund et al. J Neurosci. .

Abstract

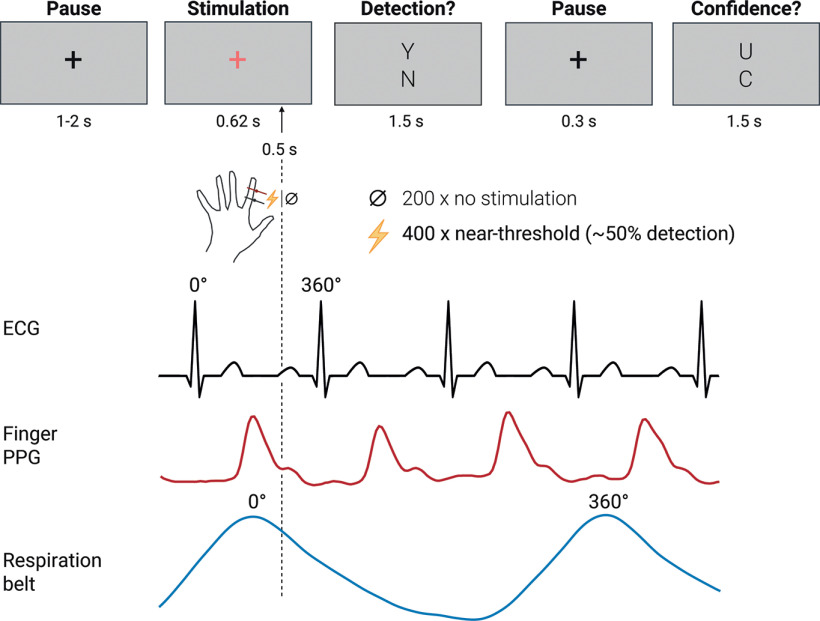
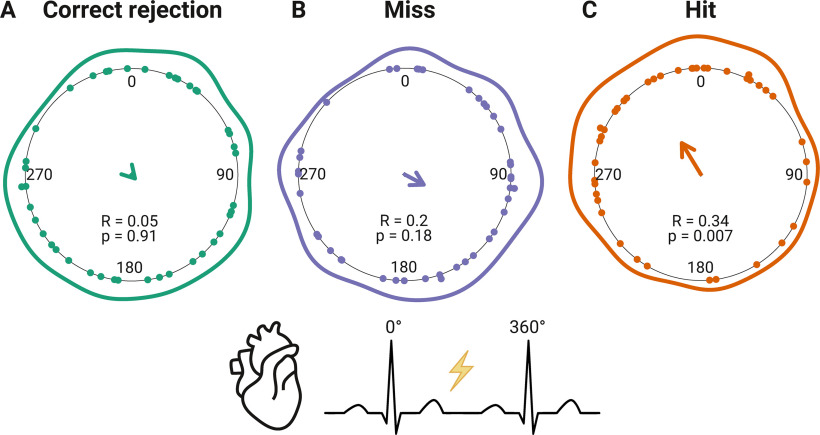
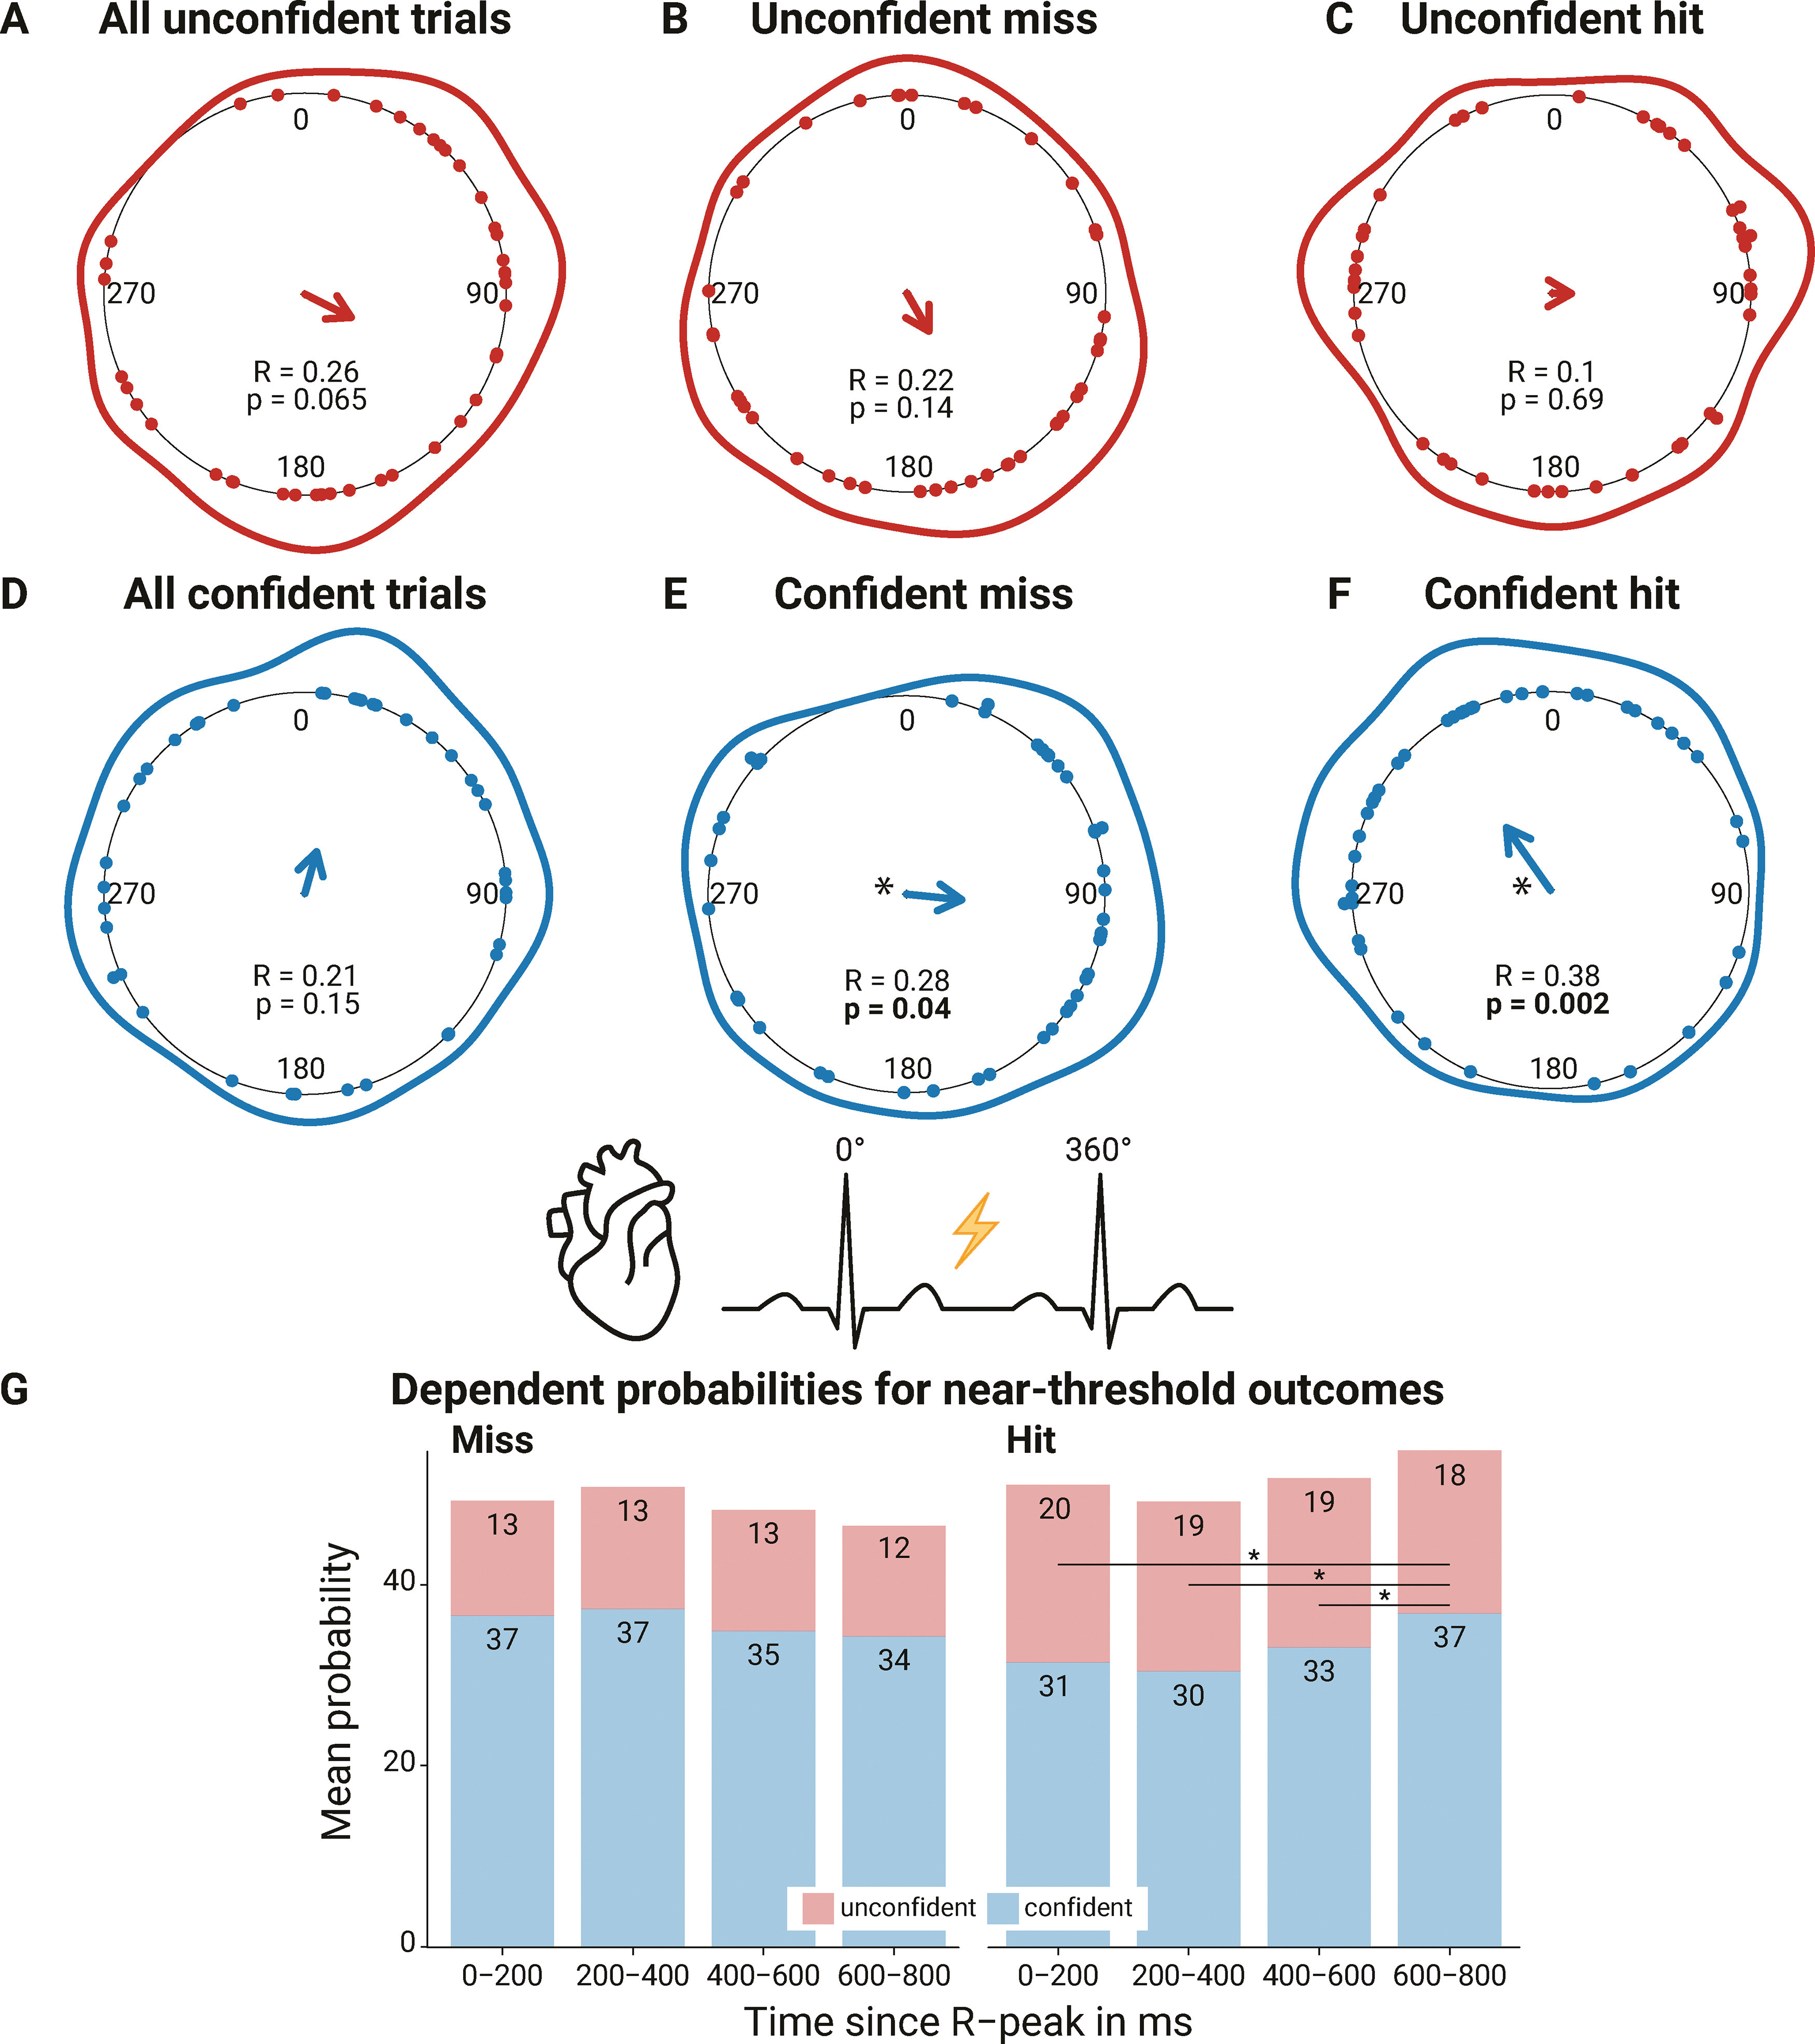
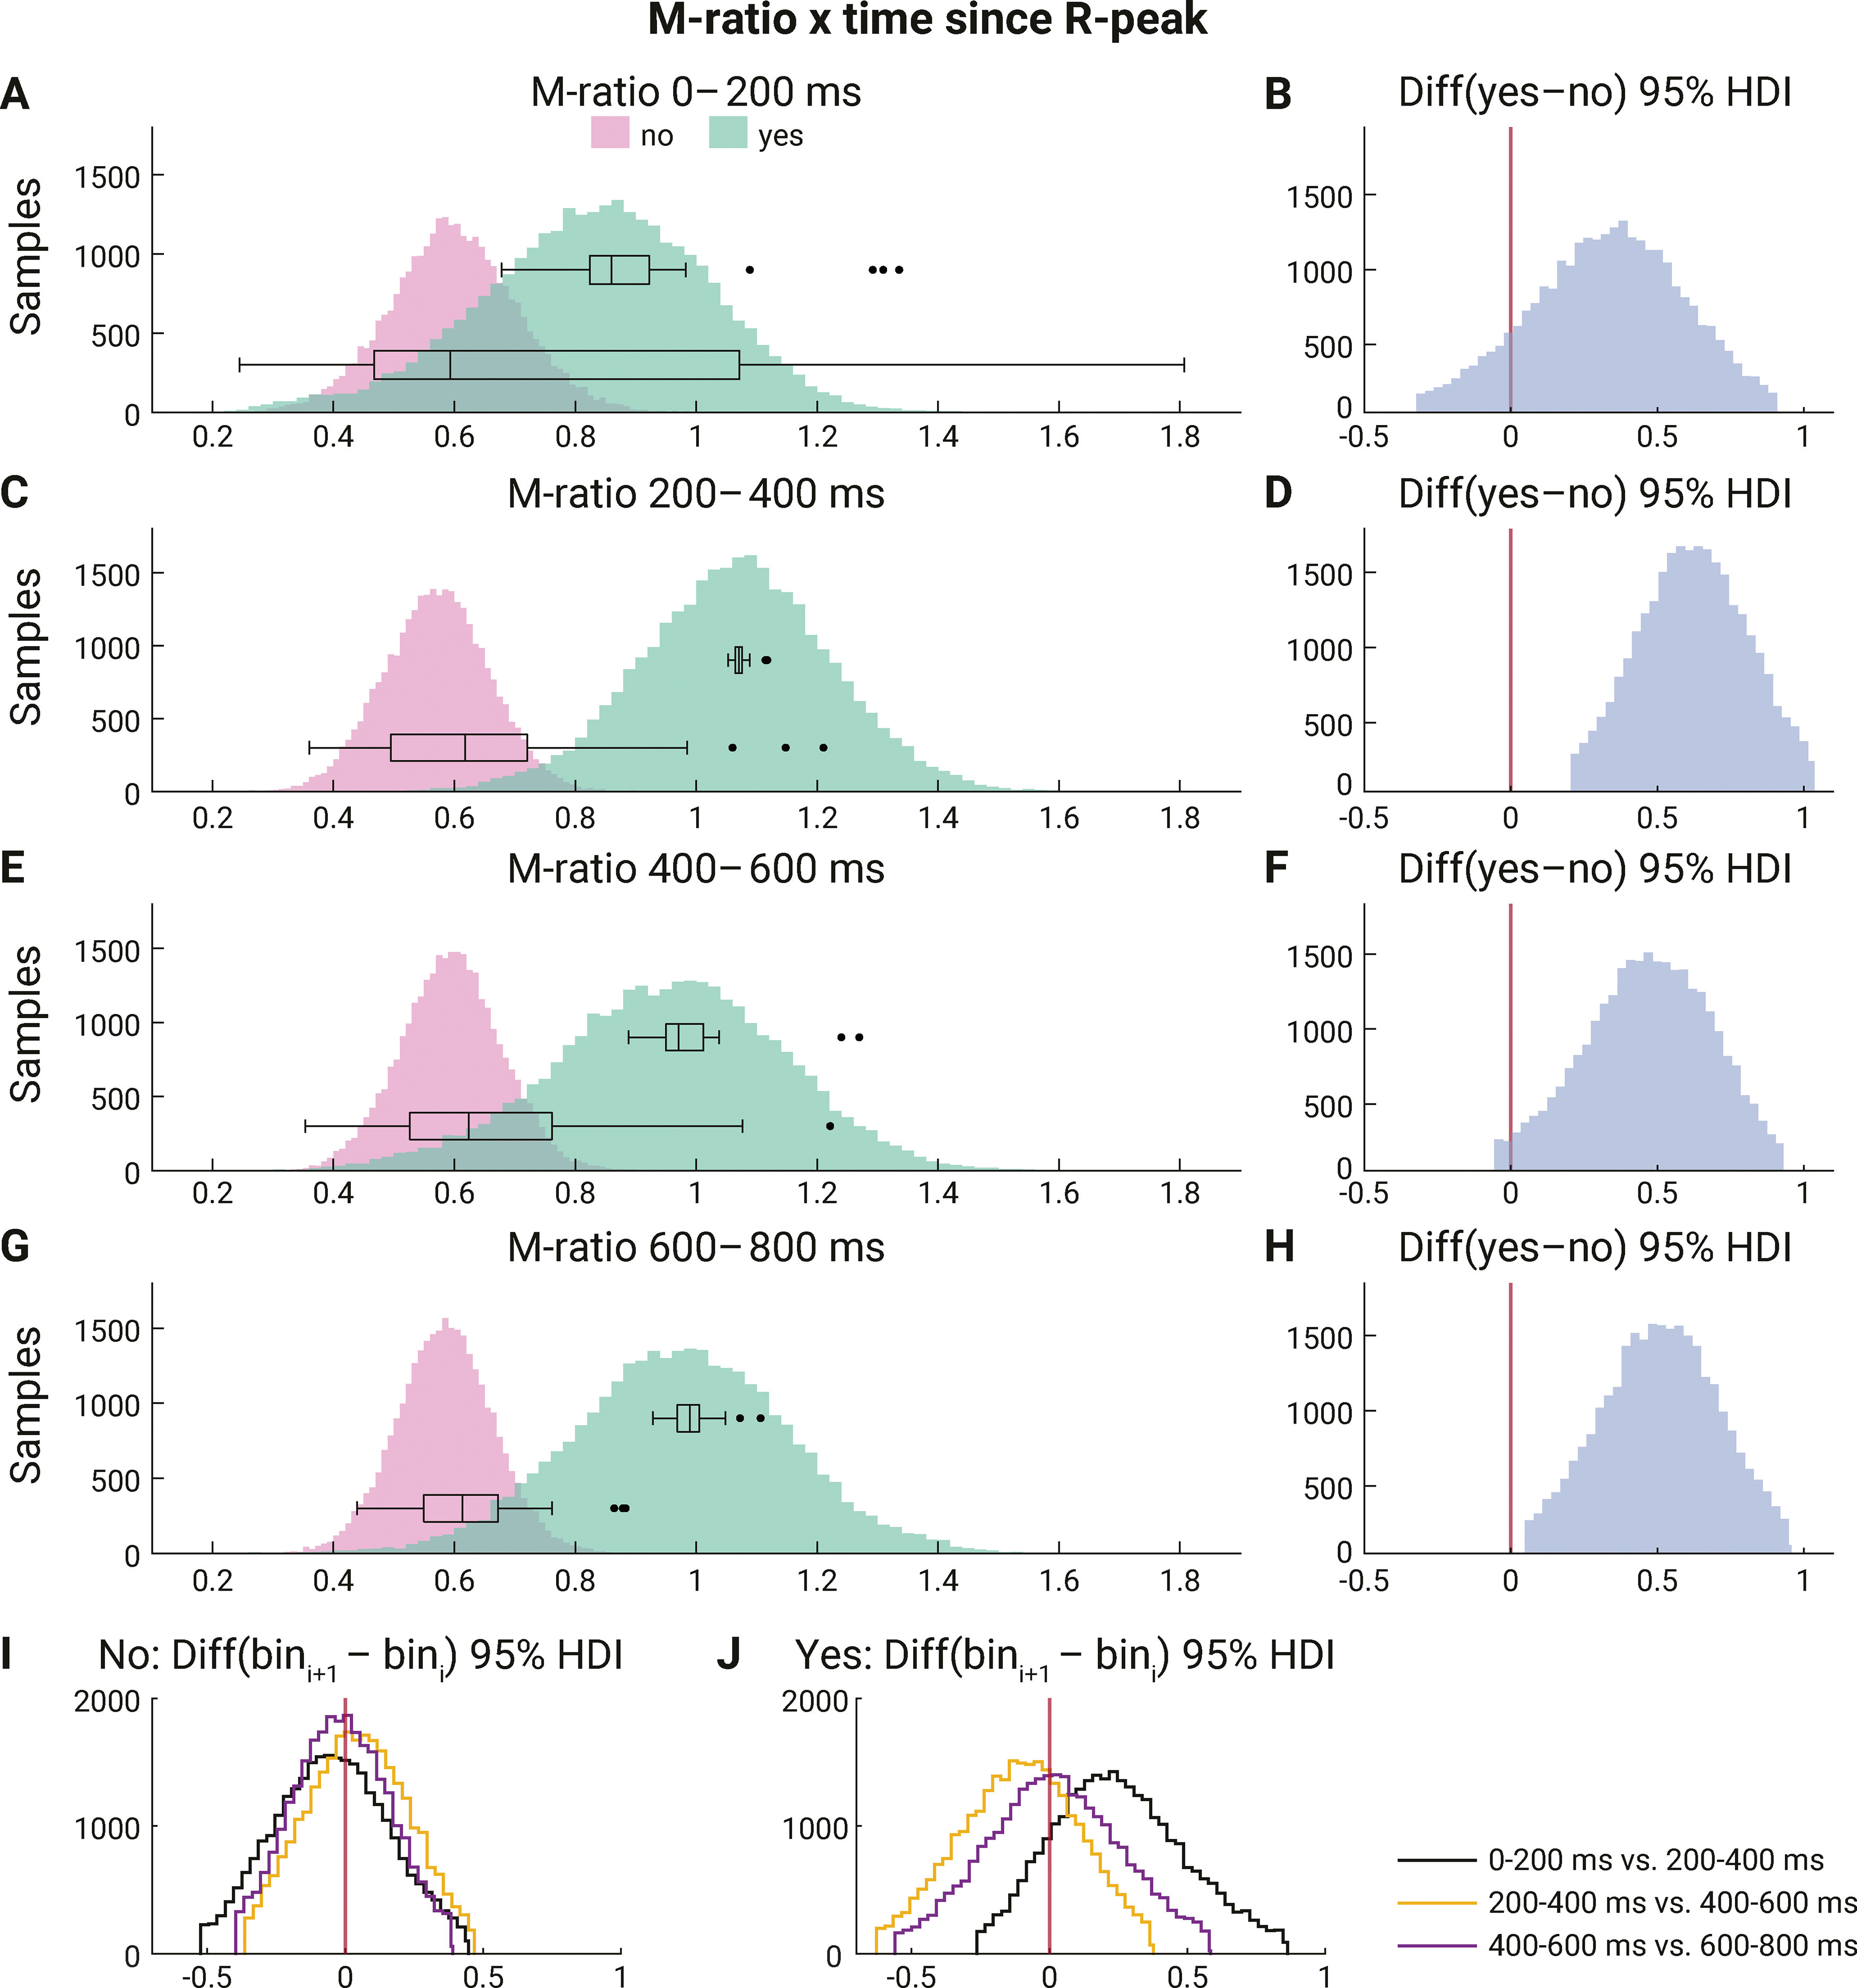
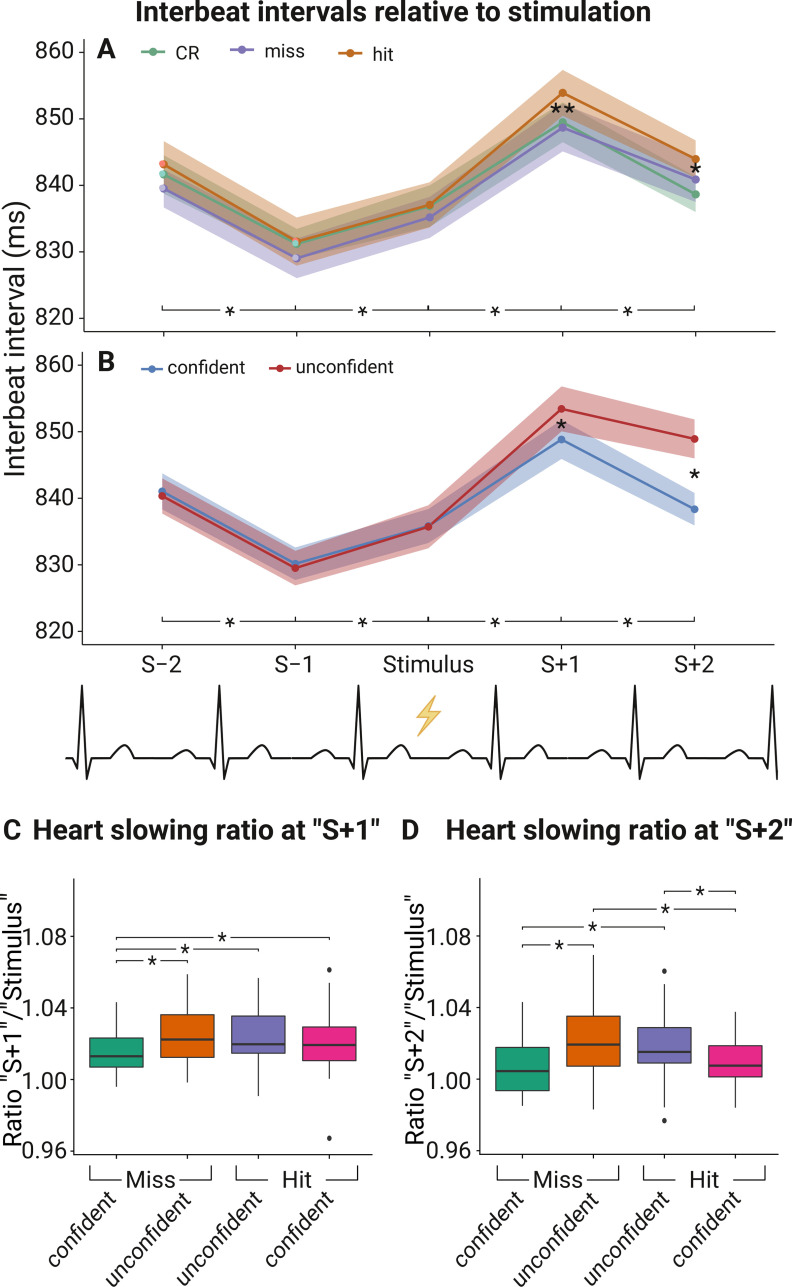
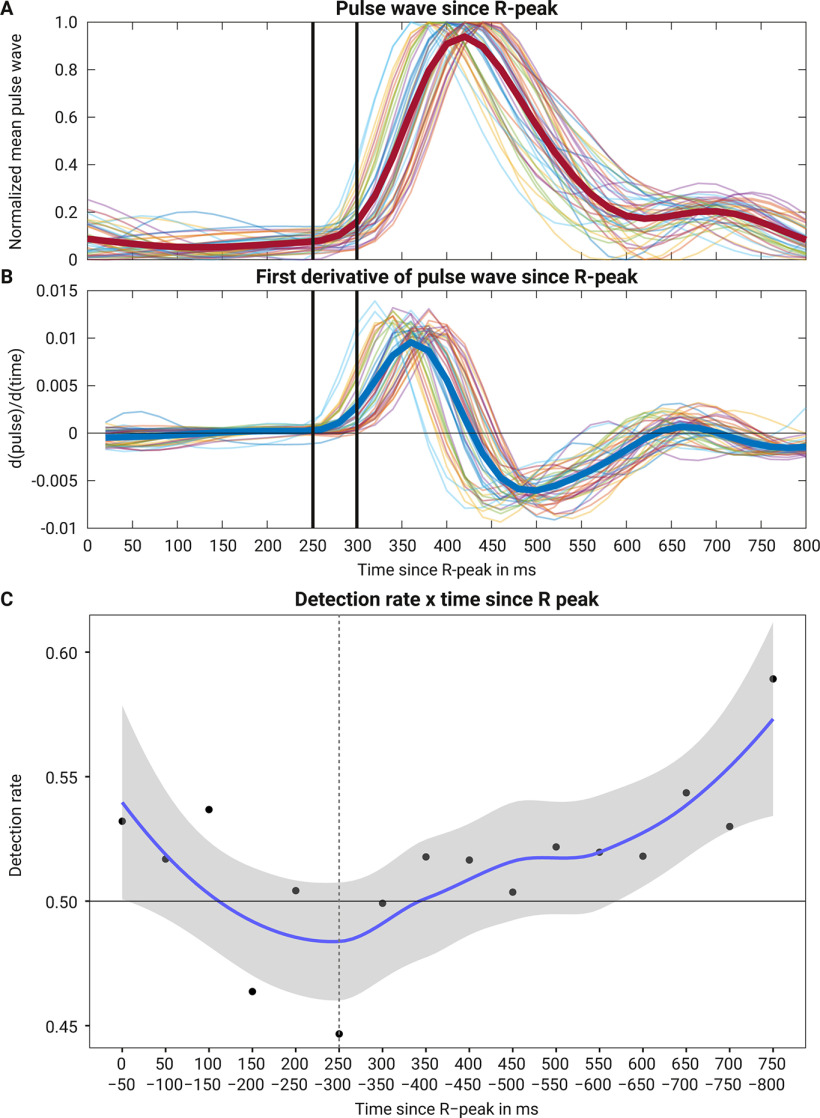
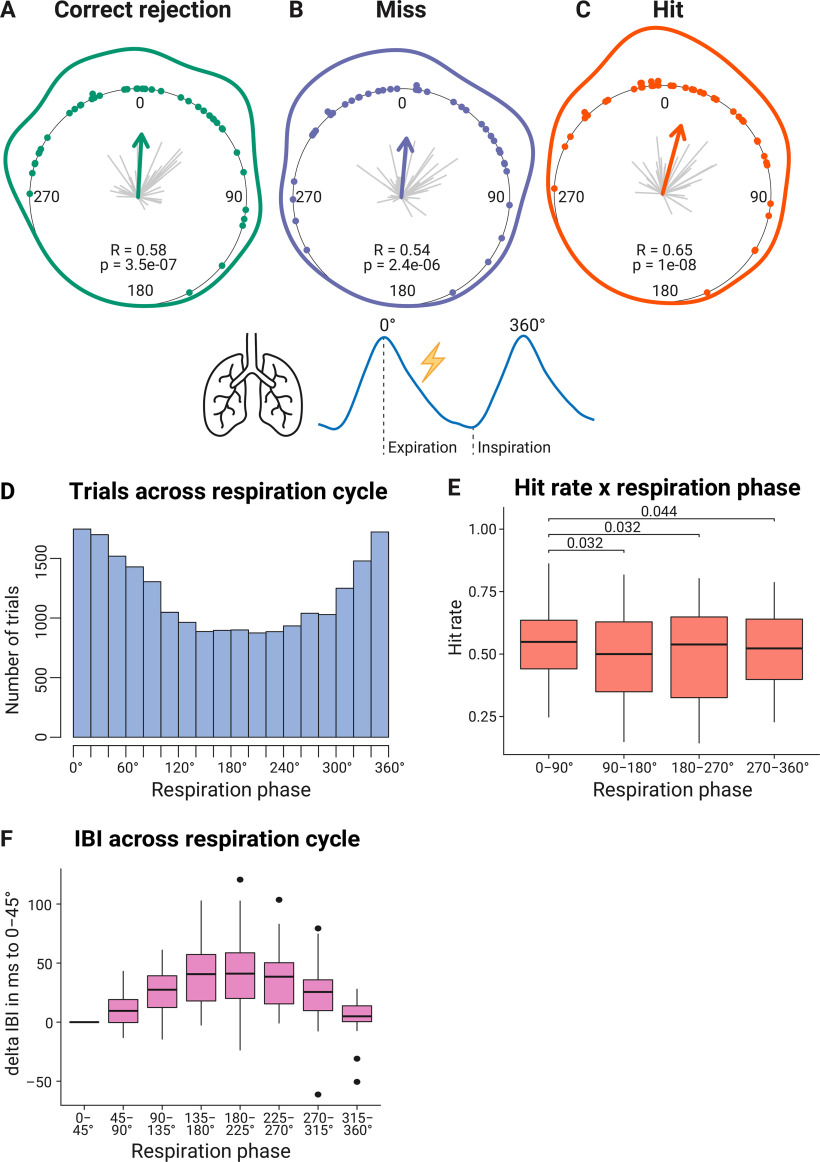
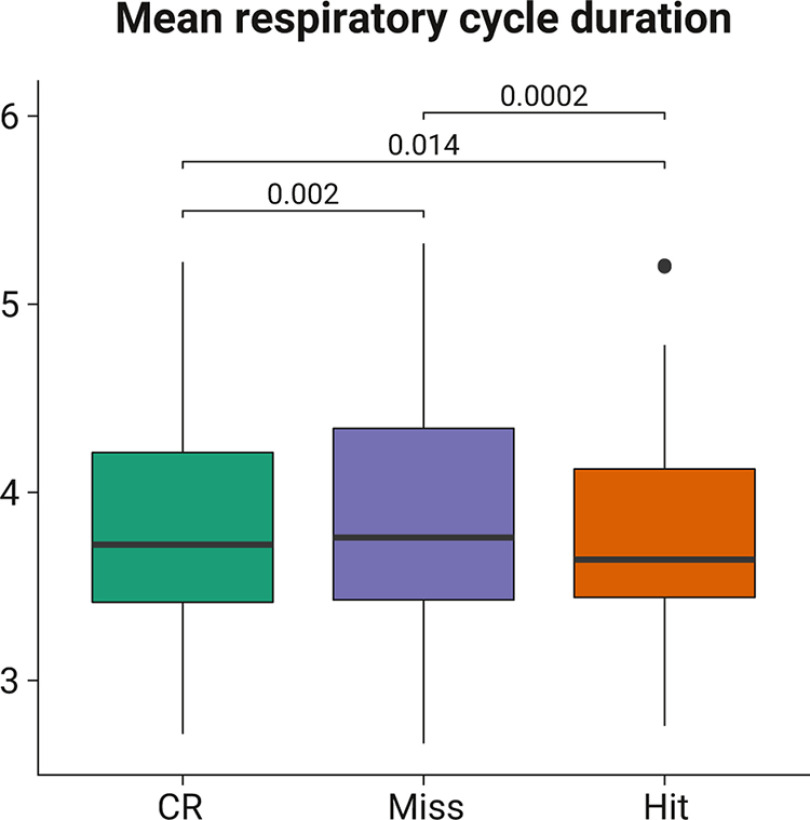
Previous studies have shown that timing of sensory stimulation during the cardiac cycle interacts with perception. Given the natural coupling of respiration and cardiac activity, we investigated here their joint effects on tactile perception. Forty-one healthy female and male human participants reported conscious perception of finger near-threshold electrical pulses (33% null trials) and decision confidence while electrocardiography, respiratory activity, and finger photoplethysmography were recorded. Participants adapted their respiratory cycle to expected stimulus onsets to preferentially occur during late inspiration/early expiration. This closely matched heart rate variation (sinus arrhythmia) across the respiratory cycle such that most frequent stimulation onsets occurred during the period of highest heart rate probably indicating highest alertness and cortical excitability. Tactile detection rate was highest during the first quadrant after expiration onset. Interindividually, stronger respiratory phase-locking to the task was associated with higher detection rates. Regarding the cardiac cycle, we confirmed previous findings that tactile detection rate was higher during diastole than systole and newly specified its minimum at 250-300 ms after the R-peak corresponding to the pulse wave arrival in the finger. Expectation of stimulation induced a transient heart deceleration which was more pronounced for unconfident decision ratings. Interindividually, stronger poststimulus modulations of heart rate were linked to higher detection rates. In summary, we demonstrate how tuning to the respiratory cycle and integration of respiratory-cardiac signals are used to optimize performance of a tactile detection task.SIGNIFICANCE STATEMENT Mechanistic studies on perception and cognition tend to focus on the brain neglecting contributions of the body. Here, we investigated how respiration and heartbeat influence tactile perception: respiration phase-locking to expected stimulus onsets corresponds to highest heart rate (and presumably alertness/cortical excitability) and correlates with detection performance. Tactile detection varies across the heart cycle with a minimum when the pulse reaches the finger and a maximum in diastole. Taken together with our previous finding of unchanged early event-related potentials across the cardiac cycle, we conclude that these effects are not a peripheral physiological artifact but a result of cognitive processes that model our body's internal state, make predictions to guide behavior, and might also tune respiration to serve the task.

Keywords: cardiac cycle; electrocardiogram; interoception; photoplethysmography; respiration; tactile perception.


Figures

Figure 1.
Figure 1.
Experimental procedure and physiological parameters visualized for one exemplary trial. The tiles represent the participant's visual display and the times given below indicate the presentation duration. The near-threshold electrical finger nerve stimulation was always 0.5 s after the cue onset (salmon-colored fixation cross). Here, only one of four button response mappings is displayed (Y = yes; N = no; U = unconfident; C = confident). In total, 400 near-threshold trials and 200 trials without stimulation (33% catch trials) were presented in randomized order. Exemplary traces of ECG, finger photoplethysmography (PPG), and respiration belt below the trial procedure indicate that stimulus detection was analyzed relative to cardiac and respiratory cycles (0°–360°).
Figure 2.
Figure 2.
Distribution of mean angles (stimulus onset relative to cardiac cycle) for (A) correct rejections (green), (B) misses (purple), and (C) hits (red). Each dot indicates the mean angle of one participant. The line around the inner circle shows the density distribution of these mean angles. The direction of the arrow in the center indicates the mean angle across the participants while the arrow length represents the mean resultant length R. The resulting p value of the Rayleigh test of uniformity is noted below.
Figure 3.
Figure 3.
Circular distribution within the cardiac cycle of unconfident/confident trials and unconfident/confident misses and hits (A–F), dependent probabilities of unconfident/confident miss/hit at four time intervals after the R-peak (G), and metacognitive efficiency across the cardiac cycle (H). The distributions of mean angles (stimulus onset relative to cardiac cycle) are shown for (A) all unconfident trials (correct rejections, misses, and hits), (B) unconfident misses (red), (C) unconfident hits (red), (D) all confident trials (correct rejections, misses, and hits), (E) confident misses (blue), and (F) confident hits (blue). In A–F, each dot indicates the mean angle of one participant. The line around the inner circle shows the density distribution of these mean angles. The direction of the arrow in the center indicates the mean angle across the participants while the arrow length represents the mean resultant length R. The resulting p value of the Rayleigh test of uniformity is noted below and written in bold if significant. G, Mean dependent probabilities for the four possible outcomes of near-threshold trials given a time interval since the previous R-peak. The numbers for one time interval do not add up exactly to 100% across confident/unconfident misses and hits because of rounding and showing the mean across participants. The asterisks between the bars for confident hits indicate significant t tests. (FDR-corrected p < 0.01).
Figure 4.
Figure 4.
Response-specific metacognitive efficiency (M-ratios) across the cardiac cycle. At four cardiac intervals after the R-peak (A, C, E, G), the posterior distributions of group-level M-ratios are shown for no (pink; correct rejection vs miss) and yes-responses (green; hit vs false alarm). On top of these histograms of MCMC samples, boxplots represent the participant-level M-ratios for yes/no-responses. M-ratios of 1 indicate that confidence ratings can perfectly discriminate between correct and incorrect responses. M-ratios below 1 indicate inefficient metacognition. The second column shows the difference between the posterior distributions (in log units) of yes/no-responses as the 95% HDIs at the four cardiac cycle intervals (B, D, F, H). The last row shows the 95% HDIs (in log units) between subsequent cardiac intervals (bini+1 – bini) for yes/no-responses (I, J). These 95% HDIs indicate a credible difference between the corresponding group-level M-ratios if zero (red vertical line) is not included (D, H).
Figure 5.
Figure 5.
IBIs before and after the stimulus onset for (A) correct rejections (green), misses (purple), and hits (orange), and for (B) confident (blue) and unconfident (red) decisions. Confidence bands reflect within-participant 95% confidence intervals. The label Stimulus on the y-axis indicates the cardiac cycle when the stimulation or cue only were present. The labels S – 1 and S + 1 indicate the preceding and following intervals, respectively. In A, the two asterisks at S + 1 indicate significant t tests between hits and misses (FDR-corrected p = 0.024), and between hits and correct rejections (FDR-corrected p = 0.017). The one asterisk at S + 2 in A indicates a significant t test between hits and correct rejections (FDR-corrected p = 0.014). In B, the asterisks at S + 1 and S + 2 indicate significant t tests between confident and unconfident decisions (S + 1: FDR-corrected p < 0.005; S + 2: FDR-corrected p = 6 × 10⁻⁷). The lines with asterisks on the bottom indicate significant t tests for subsequent IBIs within all conditions (FDR-corrected p < 0.05). In C, D, the ratio of IBIs at S + 1 and S + 2 relative to Stimulus are shown for unconfident/confident misses and hits. The boxplots indicate the median (centered line), the 25th/75th percentiles (box), 1.5 times the interquartile range or the maximum value if smaller (whiskers), and outliers (dots beyond the whisker range). The asterisks between the boxplots indicate significant t tests (FDR-corrected p < 0.05).
Figure 6.
Figure 6.
Pulse wave and detection relative to cardiac cycle. A, Mean pulse waves measured at the left middle finger across all participants (red thick line) and for each participant (colored thin lines) locked to preceding R-peak. B, First derivative of the mean pulse waves indicating the onset of the arriving pulse wave in the finger. The time window with the lowest detection rate is indicated with vertical thick black lines. C, Detection rate of near-threshold trials in 50-ms stimulus onset intervals since preceding R-peak. The black dots indicate the mean across participants. The blue line is the locally smoothed loess curve with a 95% confidence interval (gray) across these means.
Figure 7.
Figure 7.
Circular distribution of mean stimulus onsets relative to the respiratory cycle for (A) correct rejections (green), (B) misses (purple), and (C) hits (red). Zero degree corresponds to expiration onset. Each dot indicates the mean angle of one participant. The gray lines originating in the center of the inner circle represent the resultant lengths Ri for each participant's mean angle. A longer line indicates a less dispersed intraindividual distribution (Vi = 1 – Ri). The direction of the arrow in the center indicates the mean angle across the participants while the arrow length represents the mean resultant length R. The line around the inner circle shows the density distribution of these mean angles. The resulting p value of the Rayleigh test of uniformity is noted below. D, Histogram of respiration phases. Cumulative number of trials across all trials and participants for the relative position of the stimulus onset within the respiratory cycle binned in 20° intervals from 0° to 360°. The Rayleigh test across all trials and participants was significant (R = 0.18, p = 2 × 10−291). E, Detection rates for each quadrant of the respiratory cycle. Lines with p values above the boxplots indicate significant FDR-corrected t tests of all possible combinations. F, IBI differences for each eighth of the respiratory cycle relative to the first eighth (0°–45°). The boxplots (E, F) indicate the median (centered line), the 25th/75th percentiles (box), 1.5 times the interquartile range or the maximum value if smaller (whiskers), and outliers (dots beyond the whisker range).
Figure 8.
Figure 8.
Mean respiratory cycle duration in seconds for correct rejections (green), misses (purple), and hits (red). The boxplots indicate the median (centered line), the 25th/75th percentiles (box), 1.5 times the interquartile range or the maximum value if smaller (whiskers), and outliers (dots beyond the whisker range). Significant post hoc t tests are indicated above the boxplot with a black bar and the respective FDR-corrected p value.

Similar articles

Cited by

References

    1. Aitchison L, Bang D, Bahrami B, Latham PE (2015) Doubly Bayesian analysis of confidence in perceptual decision-making. PLoS Comput Biol 11:e1004519. 10.1371/journal.pcbi.1004519 - DOI - PMC - PubMed
    1. Al E, Iliopoulos F, Forschack N, Nierhaus T, Grund M, Motyka P, Gaebler M, Nikulin VV, Villringer A (2020) Heart-brain interactions shape somatosensory perception and evoked potentials. Proc Natl Acad Sci USA 117:10575–10584. 10.1073/pnas.1915629117 - DOI - PMC - PubMed
    1. Al E, Iliopoulos F, Nikulin VV, Villringer A (2021) Heartbeat and somatosensory perception. Neuroimage 238:118247. 10.1016/j.neuroimage.2021.118247 - DOI - PubMed
    1. Allen M, Frank D, Schwarzkopf DS, Fardo F, Winston JS, Hauser TU, Rees G (2016) Unexpected arousal modulates the influence of sensory noise on confidence. Elife 5:e18103. 10.7554/eLife.18103 - DOI - PMC - PubMed
    1. Allen M, Levy A, Parr T, Friston KJ (2019) The body's eye: the computational anatomy of interoceptive inference. bioRxiv. 603928. 10.1101/603928 - DOI - PMC - PubMed

Publication types

LinkOut - more resources